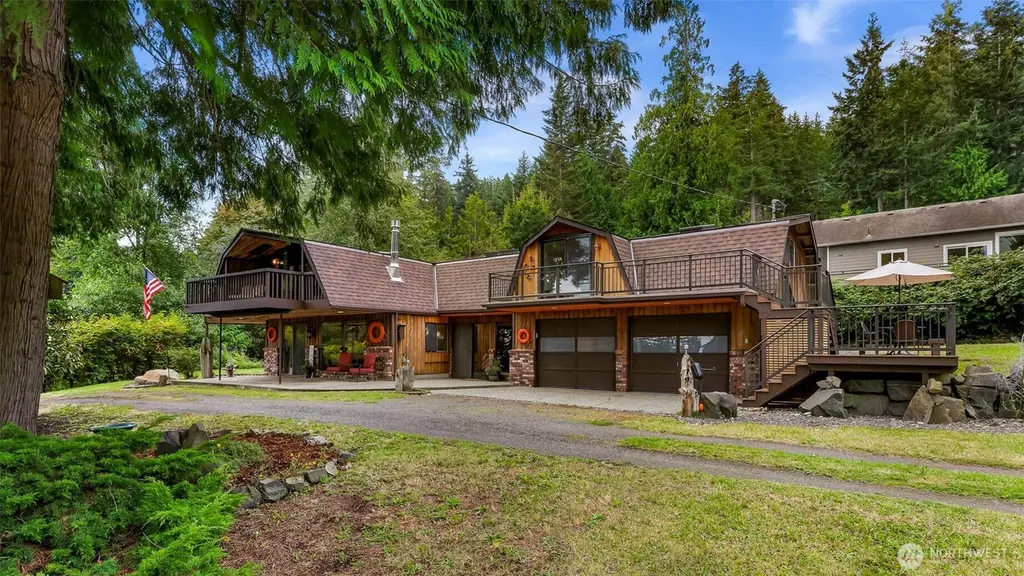
1207 Beach Ave · Marietta-Alderwood, WA
Flood risk 1/10 · Minimal
- FEMA flood zone
- X (unshaded)
- Chance of flooding over 30 yrs
- 0.0%
- Est. flood insurance / yr
- $507 – $1,088
Fire risk 3/10 · Minor
- Est. fire insurance / yr
- $604 – $1,122
Heat risk 2/10 · Minimal
- Hot days now (above 81°F)
- 9 days/yr
- Hot days in 30 yrs
- 24 days/yr
Wind risk 1/10 · Minimal
- Chance of severe wind over 30 yrs
- —
Air-quality risk 5/10 · Moderate
- Unhealthy air days now
- 7 days/yr
- Unhealthy air days in 30 yrs
- 7 days/yr
Risk factors via First Street. Map © Google.
Why this score? — see what drove the D grade
The composite is a weighted blend of 9 inputs, each scored 0–100. Each bar is that input's sub-score; the figure is the points it added to the 100-point composite (weight × sub-score).
- ARV discount +15.0/15.0
- Appreciation +10.0/10.0
- Schools +4.6/10.0
- Cash flow +3.4/30.0
- Rent growth +2.5/5.0
- Livability +2.5/5.0
- Condition / age +2.5/5.0
- 1% rule +0.0/10.0
- DSCR +0.0/10.0
$459,000
🖨 Deal sheet 📄 Offer letter ✓ Due diligence
Listing remarks
Wake up to Hales Passage views from your primary bedroom at 1207 Beach Ave - a 3 bedroom, 1.5 bath retreat tucked into the evergreens of Lummi Island's Scenic Estates community, on a large . 37 acre private lot. The peek a book water views carry into the living areas too, and the patio is where you'll unwind surrounded by mature evergreens with the passage just beyond. At 1,944 sq ft there's room to spread out - 2 full living areas, 2 car garage, enclosed breezeway, skylights, fireplaces, and a layout that works for full time living, a weekend escape, or as a short term rental. Scenic Estates include a private boat launch and marina, a freshwater swim lake, clubhouse, and direct beach acces
Key facts
- Swimming lake
- Private boat launch
- Enclosed breezeway
Tags
Neighborhood map
What this means for you Summary
Snapshot
- This is a 2-bed/1.0-bath single-family listed at $459k.
Deal economics
- At list price, monthly cash flow is $-1k ($-17k/yr) — negative.
- To cash-flow at today's rent, offer at most $209k (54.4% below list).
- To meet the 1% rule (rent ≥ 1% of price), the offer needs to be $230k (49.9% below list).
- Recommended offer: $209k (54.4% below list) — sets the bar for cash-flow.
- Cap rate 2.6% vs local median 2.1% in Marietta-Alderwood — meaningfully above typical; check what's discounted (condition, days-on-market, listing class) to confirm the premium yield is real.
Location & tenants
- Location reads: area grade D — affects rentability + tenant quality, not the cash-flow math above.
- Ferndale School District (suburban): math 43% / reading 58% proficiency, ranked #138 of 291 in WA (top 47%) — acceptable for families but not a draw, mixed tenant base, ~2y average lease.
- Market conditions: 31 active listings in the ZIP; 1 comparable units currently listed for rent nearby; 1,190 units permitted in Whatcom County in 2024 (327 in 5+ unit buildings).
Forward outlook
- In year one you build about $49k of equity ($3k loan paydown + $46k appreciation (10.0% local appreciation)).
- Whatcom County population projected at +28% by 2050 — long-run rental-demand tailwind backs the buy-and-hold thesis.
- By year 2, paydown + projected appreciation supports a ~$79k cash-out refi (75% LTV) — recoverable capital for the next deal without selling this one.
Negotiation context
- It's been on market 288 days — a 12% lower offer ($404k) is reasonable based on typical stale-listing flexibility.
- 2 sale attempts; this cycle's ask has dropped $80k (15%) from the opening price — seller is motivated, your offer sets the floor, not the list.
- Current owner paid $170k; list at $459k implies a 170% gain — meaningful room to come down on a strong offer.
Questions for the listing agent
- What do current leases actually rent for vs. the listed asking? Can we see a recent rent roll and the last 12 months of T-12 income?
- It's been on market 288 days. Have you received any prior offers? Is the seller open to a 54% concession, seller financing, or rate buy-down credit?
- Built in 1973 — when were the roof, HVAC, electrical panel, plumbing, and water heater last replaced?
- What does the HOA fee cover, when was the last increase, and are there any pending special assessments or reserve-fund shortfalls?
- Why hasn't it sold? Are there any deal-killer items the seller is aware of (foundation, flood, title, zoning, code violations)?
- Is there a deadline driving the sale (1031 exchange, divorce, estate, relocation)? That informs how much negotiation room exists.
- The area grade is low — what's the realistic commute time and amenity access for the typical tenant pool here? Any planned neighborhood developments (good or bad) we should know about?
- What's the average days-on-market for RENTAL listings here right now (not sales)? A rising rental-DOM trend means longer vacancies and softer asking-rent achievability than the comps imply.
- What's the recent tenant-quality profile in this submarket — average credit score on applications, eviction rate, late-payment / NSF rate, and stable-employment percentage? A property-management company in the area should have these aggregated.
- How much new for-sale + rental construction is in the pipeline within 1–3 miles? Heavy new supply typically softens prices + rents 12–24 months out; constrained supply supports both.
Investment metrics
- 1% rule
- 0.50% ✗
- Cap rate
- 2.60%
- Cash-on-cash
- -13.19%
- DSCR
- 0.41
- GRM
- 16.6
CMA / ARV
- ARV (median comp)
- $666,656
- List price
- $459,000
- Delta
- -31.15%
- Verdict
- UNDERPRICED
- Comps
- 13 within 1.0 mi
Show comp detail 1 sale within ~0.75 mi
| Address | Dist | Beds/Ba | Sqft | Sold | Price | $/sf | Match |
|---|---|---|---|---|---|---|---|
| 3074 Mt Vista Dr | 0.33mi | 2/2.0 | 1,864 (-6%) | 8mo | $700,000 | $376 | 64 |
Match score weights: distance 35% · size 25% · config 20% · recency 20%. Top-matched comps best support the ARV.
Projected returns pro-forma
10.0% appreciation · 3.0% rent growth · sell at horizon
- IRR
- 15.1%
- Equity multiple
- 2.25×
- Total profit
- $160,084
- Equity at exit
- $413,504
- IRR
- 14.8%
- Equity multiple
- 5.22×
- Total profit
- $542,311
- Equity at exit
- $891,736
Cash invested: $128,520 (down + closing). Projections, not guarantees.
Landlord ↔ Tenant lean methodology
- Overall (STATE)
- 28 Tenant-Leaning
- State Washington
- 28 Tenant-Leaning · D+8
- County
- — inherits STATE
- City
- — inherits STATE
ZIP-level market 98262
- Active inventory
- 31
- Price-to-rent
- 16.6×
Monthly cashflow live
- Estimated rent
- $2,300 medium interval (Pro) →
- Mortgage (P&I)
- −$2,407
- Tax from tax record
- −$554 /mo · $6,652/yr
- Insurance
- −$191
- HOA
- −$77
- Vacancy / Maint / Mgmt
- −$483
- Net cashflow
- $-1,413
Break-even live
UW: 25.0% down · 7.5% · 30yr · 1.5% tax · 5.0% vac · 8.0% maint · 8.0% mgmt
Financing live
Cash to close
- Down payment
- $114,750
- Closing costs
- $13,770
- Reserves months
- —
- Total cash needed
- —
Loan-product check · same deal, 3 products live
Conventional
25% down · 7.5% · 30yr
- Down + closing
- —
- Monthly P&I
- —
- Monthly cashflow
- —
- DSCR
- —
- Eligible?
- —
Personal DTI + credit; lowest rate.
DSCR
20% down · 8.5% · 30yr
- Down + closing
- —
- Monthly P&I
- —
- Monthly cashflow
- —
- DSCR
- —
- Eligible?
- —
No personal income docs; deal must DSCR.
Hard money
10% down · 12.0% · 12mo
- Down + closing
- —
- Monthly P&I
- —
- Monthly cashflow
- —
- DSCR
- —
- Eligible?
- —
Short-term bridge; refi at stabilization.
Rent comps 1 comps
| Address | Beds | Baths | Sqft | Rent | $/sqft | DOM | Units | Dist |
|---|---|---|---|---|---|---|---|---|
| 2958 Dogwood Ter Lummi Island, WA | 2.0 | 1.0 | 1325 | $2,300 | $1.74 | 13d | 1 | 0.22mi |
HOA detail
- Monthly dues
- $77 · $924/yr
- Likely covers
- water
Listing history 17 events
-
2026-06-18days on market $459,000 Active 288 DOM
-
2026-06-17days on market $459,000 Active 287 DOM
-
2026-06-16days on market $459,000 Active 286 DOM
-
2026-06-15days on market $459,000 Active 285 DOM
-
2026-06-14days on market $459,000 Active 283 DOM
-
2026-06-13days on market $459,000 Active 282 DOM
-
2026-06-10days on market $459,000 Active 280 DOM
-
2026-06-09days on market $459,000 Active 279 DOM
-
2026-06-08days on market $459,000 Active 278 DOM
-
2026-06-07statusdays on market $459,000 Active 277 DOM
-
2026-04-14price $475,000
-
2026-03-28price $485,000
-
2026-01-12status Active
-
2025-12-31status Pending
-
2025-12-04price $499,000
-
2025-08-11$539,000 Active
-
2002-02-22soldstatus $170,000
ⓘ Source: listings_history table (triggers on properties + properties_extension) + one-shot
backfill from property_details.listing_events for pre-trigger history.
Tax reassessment forecast WA · Resets to sale price
- Current annual tax
- $6,652 · $554/mo
- Projected year-2 tax
- $6,652 · $554/mo
- Expected delta
- $0/yr ($0/mo · 0.0%)
ⓘ Screening estimate from a state-policy table — verify with the county assessor before closing.
Climate risk First Street
- Flood 1/10 Low FEMA zone X (unshaded) · 0% chance over 30 yrs
- Wildfire 3/10 Moderate
- Heat 2/10 Low 9 d/yr ≥81°F today · 24 d/yr by 30 yrs out
- Wind 1/10 Low
- Air quality 5/10 Major 7 unhealthy d/yr today · 7 by 30 yrs out
Nearby sold comps map
Loading sold comps map…
Walkable amenities ~0.75 mi
Loading nearby amenities…
Taxation est. · year 1
- Rental income
- $27,600
- − Mortgage interest
- −$25,711
- − Property taxes
- −$6,652
- − Insurance
- −$2,295
- − Repairs & maintenance
- −$2,208
- − Management
- −$2,208
- − HOA
- −$924
- − Depreciation
- −$13,353
- Taxable loss
- −$25,751
- Est. tax savings @ 24.0%
- +$6,180
- After-tax cash flow
- $-10,771/yr
For passive investors: Depreciation is non-cash, so a rental often shows a tax loss while cash-flowing — sheltering income. Rental losses are passive: they offset passive income freely, and up to $25,000/yr can offset ordinary (W-2) income if you actively participate and your MAGI is under $100k (phasing out to $0 by $150k); unused losses carry forward. On sale, claimed depreciation is recaptured at up to 25%, and gains may owe capital-gains tax (a 1031 exchange can defer both). Figures are a year-1 estimate at your 24.0% rate — not tax advice; consult a CPA.
Schools (NCES district)
- District
- Ferndale School District
- NCES district ID
- 5302850
- Math proficiency
- 43% ▲ 1.00%
- Reading proficiency
- 58% ▲ 4.00%
- Median HH income
- $59,413
- Composite
- 46.06/100
- National rank
- #5494
- State rank
- #138 of 291 in WA
Livability — Marietta-Alderwood
No livability data for this city. (Only ~50 U.S. cities are tracked.)
Census & demographics
- Population (ZIP)
- 1,020
Population outlook (Whatcom County) Hauer SSP2
- Today (2025)
- 240,408 people
- By 2030
- 254,667 · +5.9%
- By 2040
- 281,365 · +17.0%
- By 2050
- 307,592 · +27.9%
- By 2075
- 375,576 · +56.2%
- By 2100
- 421,637 · +75.4%
Race, ethnicity, and origin ACS 2023
- Neighborhood character
- Predominantly White (84%)
- Race & ethnicity
- White 84% Hispanic / Latino 7% Two or more races 4% Asian 3%
- Hispanic origin (detail)
- Mexican 4%
- Common ancestry
- Italian 10% Slovak 5% Iranian 5%
- Foreign-born
- 11% · Canada, China
- Languages at home
- 94% English-only · Spanish 3% Chinese 2% Other Asian/Pacific 1%
Political lean MEDSL · Whatcom
- 2024 margin
- Strong D (+24.9) · D 60.8% · R 35.9% · Other 3.3%
- 2008→2024 swing
- +6.9pp toward D · 2008: 18.0pp · 2024: 24.9pp
- All cycles
- 2024: D+24.9 2020: D+23.9 2016: D+17.7 2012: D+12.1 2008: D+18.0
Not yet ingested
- Civics
- —
Market trends
- HPI YoY
- ▲ 114.22%
- Current HPI
- 434.67
- Rent YoY
- —
- Metro
- —
- State GDP YoY
- ▲ 4.65%
- F500 in state
- 22
Industry mix (Fortune 500 HQ in WA)
| Industry | F500 HQs | Revenue |
|---|---|---|
| Retail | 2 | $269B |
|
||
| Technology / Retail | 1 | $638B |
|
||
| Technology | 1 | $245B |
|
||
| Telecommunications | 1 | $38B |
|
||
| Food / Beverage | 1 | $36B |
|
||
| Automotive / Trucks | 1 | $34B |
|
||
Price history
+179.4% since first listed7 events — show timeline
- 2026-04-14 Price Changed $475,000 NWMLS as Distributed by MLS Grid
- 2026-03-28 Price Changed $485,000 NWMLS as Distributed by MLS Grid
- 2026-01-12 Relisted — NWMLS as Distributed by MLS Grid
- 2025-12-31 Pending — NWMLS as Distributed by MLS Grid
- 2025-12-04 Price Changed $499,000 NWMLS as Distributed by MLS Grid
- 2025-08-11 Listed $539,000 NWMLS as Distributed by MLS Grid
- 2002-02-22 Sold (Public Records) $170,000 Public Records
Property tax history
+5.1%/yrLatest (2026): $6,652 · +36.3% YoY. Source: county tax records.
Cash-flow waterfall
monthlySold comps — $/sqft
last 12 mo · ≤1 miLoading sold comps…