 Duplex
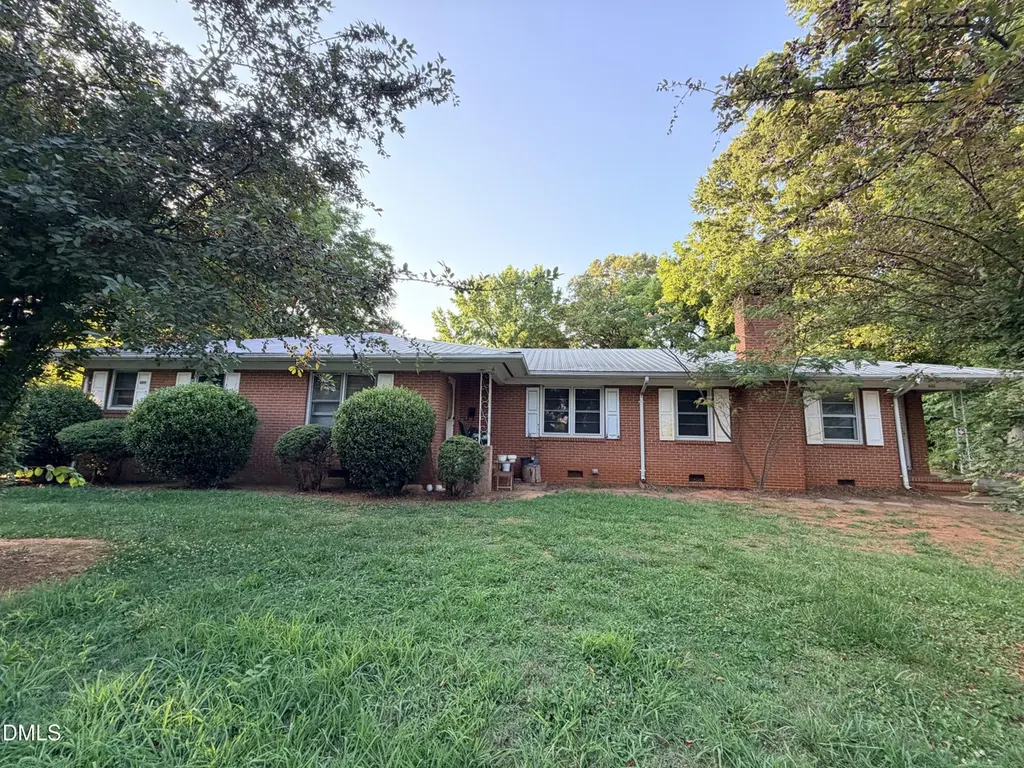
611 E Raleigh St · Siler City, NC
Flood risk 1/10 · Minimal
- FEMA flood zone
- X (unshaded)
- Chance of flooding over 30 yrs
- 0.0%
- Est. flood insurance / yr
- $507 – $1,088
Fire risk 1/10 · Minimal
- Est. fire insurance / yr
- $906 – $1,684
Heat risk 5/10 · Moderate
- Hot days now (above 103°F)
- 7 days/yr
- Hot days in 30 yrs
- 17 days/yr
Wind risk 6/10 · Moderate
- Chance of severe wind over 30 yrs
- 27.0%
Air-quality risk 1/10 · Minimal
- Unhealthy air days now
- 0 days/yr
- Unhealthy air days in 30 yrs
- 0 days/yr
Risk factors via First Street. Map © Google.
Why this score? — see what drove the C- grade
The composite is a weighted blend of 9 inputs, each scored 0–100. Each bar is that input's sub-score; the figure is the points it added to the 100-point composite (weight × sub-score).
- Cash flow +21.8/30.0
- ARV discount +7.5/15.0
- DSCR +7.0/10.0
- 1% rule +5.0/10.0
- Schools +4.2/10.0
- Livability +3.4/5.0
- Rent growth +2.5/5.0
- Condition / age +2.5/5.0
- Appreciation +0.0/10.0
$259,000
🖨 Deal sheet (PDF) 📄 Offer letter ✓ Due diligence
Multi-family units
County records classify this as Multi-Family (2-4 Unit). Listing-text estimate: 2 units. confirmed
Listing remarks MLS
Paved drive, New Roof, one utility buidling. One side has an attached carport and the other has a detached carport. Renter has a month to month lease and loves where she lives. Her lease has run out. One side is vacant. Total sq. footage of this Duplex is 2350
Key facts
- 0.45 acre lot
- Built 1959
- Listed 7 days
Property features AI
Finance
- Other: Located in Chatham County
- HOA & community: No homeowners association
Exterior
- Utilities: Public water; Public sewer
- Home design: Duplex; Multi/split levels
- Construction: Brick construction; Brick/mortar foundation; Metal roof; Built area approximately 2,407
- Exterior features: Public maintained road access; Zoning: R-10; Approximately 0.45-acre lot
Interior
- Bedrooms: 4 bedrooms (all on the main level)
- Flooring: Plank; Vinyl
- Bathrooms: 2 full bathrooms
- Heating & cooling: Central heating (forced air); Central air conditioning
- Interior features: Plank and vinyl flooring
Neighborhood map
What this means for you Summary
Snapshot
- This is a 2 × 2-bed/1.5-bath units multifamily listed at $259k.
Deal economics
- At list price, monthly cash flow is $404 ($5k/yr) — positive. Per door: $202/mo.
- The deal already cash-flows at list — no discount required.
- Meets the 1% rule at list price ($3k rent vs $259k).
- Cap rate 8.2% vs local median 2.7% in Siler City — top-decile yield for the area; either an underpriced asset or a hidden risk that comps aren't pricing in. Stress-test before assuming the spread holds.
Location & tenants
- Location reads 68/100 on livability (#203 in NC) — a middle-class / working-renter tenant base. Strengths: cost of living A+, housing A+, health & safety A+; Watch: crime F, amenities F, commute F.
- Chatham County Schools (rural): math 45% / reading 51% proficiency, ranked #68 of 178 in NC (top 38%) — families likely to look elsewhere, expect single-tenant / working-renter base with shorter leases.
- Zoned schools: Virginia Cross Elementary (math 22% / reading 25%, grade F, #1,160 of 1,410 statewide, top 83%, 455 students, 93% FRL); Chatham Middle (math 29% / reading 36%, grade F, #312 of 475 statewide, top 66%, 556 students, 89% FRL); Jordan Matthews High (math 42% / reading 51%, grade D-, #344 of 535 statewide, top 64%, 913 students, 76% FRL) — zoned schools average 86% FRL vs 45% district-wide (41 pts higher); higher-poverty schools than district average — tighter screening recommended.
- Zoned-school proficiency averages 34% at this address vs 48% district-wide (-14 pts) — the specific schools serving this property underperform the Chatham County Schools average; the district grade overstates school quality for this exact location.
- Market conditions: 114 active listings in the ZIP; 458 units permitted in Chatham County in 2024 (0 in 5+ unit buildings).
Forward outlook
- Local home prices are declining (-3.0%/yr); year-one equity from $2k of loan paydown is wiped out by about $8k of value loss. Plan a longer hold.
- Chatham County population projected at +26% by 2050 — long-run rental-demand tailwind backs the buy-and-hold thesis.
Negotiation context
- Only 7 days on market — expect competitive offers; lowballing is unlikely to land.
- 3 sale attempts since 20y ago with the ask held roughly flat each time — persistent listings suggest the price (not the market) is what's stuck; bring a comps-based counter.
- Current owner paid $105k; list at $259k implies a 147% gain — meaningful room to come down on a strong offer.
Risks & watch-outs
- Watch-outs: built in 1959 — expect roof / HVAC / electrical / plumbing capex.
- Climate carrying-cost: major wind risk, 27% chance of damaging wind over 30y; extreme-heat days projected 7→17/yr by 2055 (HVAC capex compounding) — expect insurance premiums to compound above CPI over the hold.
Questions for the listing agent
- Can we see the unit-by-unit rent roll, current vacancy, and any below-market leases? What's the average tenancy length?
- What capital expenditures (roof, boiler, parking lot, exteriors) have been made in the last 5 years, and what's planned in the next 2?
- Built in 1959 — when were the roof, HVAC, electrical panel, plumbing, and water heater last replaced?
- Is there a deadline driving the sale (1031 exchange, divorce, estate, relocation)? That informs how much negotiation room exists.
- Schools are D-rated, which usually means shorter tenancies and higher turnover. Who's the typical renter profile here, and what's been the actual vacancy rate?
- Crime grade is F in this area — have there been break-ins, vandalism, or insurance claims at this property in the last 3 years? What carrier currently insures it and at what premium?
- What's the average days-on-market for RENTAL listings here right now (not sales)? A rising rental-DOM trend means longer vacancies and softer asking-rent achievability than the comps imply.
- What's the recent tenant-quality profile in this submarket — average credit score on applications, eviction rate, late-payment / NSF rate, and stable-employment percentage? A property-management company in the area should have these aggregated.
- How much new apartment / multifamily construction is in the pipeline within 1–3 miles? Heavy new supply (>2% of stock underway) typically softens rents 12–24 months out; light construction supports rent growth.
Investment metrics
- 1% rule
- 1.00% ✓
- Cap rate
- 8.17%
- Cash-on-cash
- 6.69%
- DSCR
- 1.30
- GRM
- 8.3
CMA / ARV
No comps found within radius.
Projected returns pro-forma
-3.0% appreciation · 3.0% rent growth · sell at horizon
- IRR
- -6.0%
- Equity multiple
- 0.78×
- Total profit
- $-16,266
- Equity at exit
- $38,618
- IRR
- 3.6%
- Equity multiple
- 1.26×
- Total profit
- $18,790
- Equity at exit
- $22,394
Cash invested: $72,520 (down + closing). Projections, not guarantees.
Landlord ↔ Tenant lean methodology
- Overall (STATE)
- 85 Strongly Landlord-Friendly
- State North Carolina
- 85 Strongly Landlord-Friendly · R+3
- County
- — inherits STATE
- City
- — inherits STATE
ZIP-level market 27344
- Home prices YoY
- -4.2%
- Active inventory
- 114
- Price-to-rent
- 16.7×
Monthly cashflow live
- Estimated rent
- $2,591 high interval (Pro) →
- Mortgage (P&I)
- −$1,358
- Tax from tax record
- −$176 /mo · $2,117/yr
- Insurance
- −$108
- HOA
- −$0
- Vacancy / Maint / Mgmt
- −$544
- Net cashflow
- $404
Break-even live
Sensitivity live
| Price | -10% $551 | -5% $478 | +0% $404 | +5% $331 | +10% $258 |
|---|---|---|---|---|---|
| Rent | -10% $200 | -5% $302 | +0% $404 | +5% $507 | +10% $609 |
| Rate | -1.0pp $535 | -0.5pp $470 | base $404 | +0.5pp $337 | +1.0pp $269 |
2-unit breakdown (identical units grouped — click to expand)
| Units | Beds | Baths | Est. rent |
|---|---|---|---|
| 2× units | 2 | 1.5 | $2,592 |
| #1 | 2 | 1.5 | $1,296 |
| #2 | 2 | 1.5 | $1,296 |
| Total (2 units) | $2,591 | ||
UW: 25.0% down · 7.5% · 30yr · 1.5% tax · 5.0% vac · 8.0% maint · 8.0% mgmt
Financing live
Cash to close
- Down payment
- $64,750
- Closing costs
- $7,770
- Reserves months
- —
- Total cash needed
- —
Loan-product check · same deal, 3 products live
Conventional
25% down · 7.5% · 30yr
- Down + closing
- —
- Monthly P&I
- —
- Monthly cashflow
- —
- DSCR
- —
- Eligible?
- —
Personal DTI + credit; lowest rate.
DSCR
20% down · 8.5% · 30yr
- Down + closing
- —
- Monthly P&I
- —
- Monthly cashflow
- —
- DSCR
- —
- Eligible?
- —
No personal income docs; deal must DSCR.
Hard money
10% down · 12.0% · 12mo
- Down + closing
- —
- Monthly P&I
- —
- Monthly cashflow
- —
- DSCR
- —
- Eligible?
- —
Short-term bridge; refi at stabilization.
Listing history 7 events
-
2026-06-21statusdays on market $259,000 Pending 7 DOM
-
2026-06-18days on market $259,000 Active 6 DOM
-
2026-06-17days on market $259,000 Active 5 DOM
-
2026-06-16days on market $259,000 Active 4 DOM
-
2026-06-16days on market $259,000 Active 3 DOM
-
2026-06-13remarks 695-char remark
-
2026-06-13$259,000 Active 1 DOM
ⓘ Source: listings_history table (triggers on properties + properties_extension) + one-shot
backfill from property_details.listing_events for pre-trigger history.
Tax reassessment forecast NC · Resets to sale price
- Current annual tax
- $2,117 · $176/mo
- Projected year-2 tax
- $2,124 · $177/mo
- Expected delta
- +$7/yr (+$1/mo · 0.3%)
ⓘ Screening estimate from a state-policy table — verify with the county assessor before closing.
Climate risk First Street
- Flood 1/10 Low FEMA zone X (unshaded) · 0% chance over 30 yrs
- Wildfire 1/10 Low
- Heat 5/10 Major 7 d/yr ≥103°F today · 17 d/yr by 30 yrs out
- Wind 6/10 Major 27% chance of damaging wind over 30 yrs
- Air quality 1/10 Low 0 unhealthy d/yr today · 0 by 30 yrs out
Nearby sold comps map
Loading sold comps map…
Walkable amenities ~0.75 mi
Loading nearby amenities…
Taxation est. · year 1
- Rental income
- $31,092
- − Mortgage interest
- −$14,508
- − Property taxes
- −$2,117
- − Insurance
- −$1,295
- − Repairs & maintenance
- −$2,487
- − Management
- −$2,487
- − Depreciation
- −$7,535
- Taxable income
- $663
- Est. tax owed @ 24.0%
- −$159
- After-tax cash flow
- $4,693/yr
For passive investors: Depreciation is non-cash, so a rental often shows a tax loss while cash-flowing — sheltering income. Rental losses are passive: they offset passive income freely, and up to $25,000/yr can offset ordinary (W-2) income if you actively participate and your MAGI is under $100k (phasing out to $0 by $150k); unused losses carry forward. On sale, claimed depreciation is recaptured at up to 25%, and gains may owe capital-gains tax (a 1031 exchange can defer both). Figures are a year-1 estimate at your 24.0% rate — not tax advice; consult a CPA.
Schools (NCES district)
- District
- Chatham County Schools
- NCES district ID
- 3700750
- Math proficiency
- 45% ▼ -1.00%
- Reading proficiency
- 51% ▲ 1.00%
- Median HH income
- $57,371
- Composite
- 41.82/100
- National rank
- #3390
- State rank
- #68 of 178 in NC
Livability — Siler City
- Score
- 68/100
- State rank
- #203
- US rank
- #9963
Category grades
Schools grade is shown separately in the Schools card above.
Census & demographics
- Census place
- Siler City, NC
- Population (ZIP)
- 18,804
Population outlook (Chatham County) Hauer SSP2
- Today (2025)
- 84,640 people
- By 2030
- 90,521 · +6.9%
- By 2040
- 99,791 · +17.9%
- By 2050
- 106,565 · +25.9%
- By 2075
- 119,165 · +40.8%
- By 2100
- 122,958 · +45.3%
Race, ethnicity, and origin ACS 2023
- Neighborhood character
- Diverse neighborhood (Simpson 0.66)
- Race & ethnicity
- White 45% Hispanic / Latino 33% Black 16% Two or more races 12%
- Hispanic origin (detail)
- Mexican 18%
- Common ancestry
- Slovak 3% Serbian 2% Lithuanian 1%
- Foreign-born
- 18% · Canada
- Languages at home
- 68% English-only · Spanish 31% German/W. Germanic 1%
Political lean MEDSL · Chatham
- 2024 margin
- D (+12.5) · D 55.7% · R 43.2% · Other 1.1%
- 2008→2024 swing
- +2.8pp toward D · 2008: 9.7pp · 2024: 12.5pp
- All cycles
- 2024: D+12.5 2020: D+11.5 2016: D+10.1 2012: D+4.8 2008: D+9.7
Not yet ingested
- Civics
- —
Market trends
- HPI YoY
- ▼ -12.47%
- Current HPI
- 285.6479
- Rent YoY
- —
- Metro
- —
- State GDP YoY
- ▲ 3.28%
- F500 in state
- 26
Industry mix (Fortune 500 HQ in NC)
| Industry | F500 HQs | Revenue |
|---|---|---|
| Financial Services | 2 | $213B |
|
||
| Retail | 2 | $95B |
|
||
| Industrial Conglomerate | 1 | $38B |
|
||
| Metals / Steel | 1 | $35B |
|
||
| Utilities | 1 | $30B |
|
||
| Industrial Machinery | 1 | $19B |
|
||
Price history
+89.7% since first listed7 events — show timeline
- 2026-06-12 Listed $259,000 TMLS
- 2007-02-21 Sold (Public Records) $105,000 Public Records
- 2007-02-20 Sold (MLS) $105,000 AMLSNC
- 2007-02-20 Sold (MLS) $105,000 TMLS
- 2007-01-22 Listing Removed — TMLS
- 2006-04-26 Listed $136,500 AMLSNC
- 2006-04-26 Listed $136,500 TMLS
Property tax history
+9.0%/yrLatest (2021): $2,117 · +17.7% YoY. Source: county tax records.
Cash-flow waterfall
monthlySold comps — $/sqft
last 12 mo · ≤1 miLoading sold comps…