117 NW 50th St · Deerfield Beach, FL
Flood risk 1/10 · Minimal
- FEMA flood zone
- X (shaded)
- Chance of flooding over 30 yrs
- 0.0%
- Est. flood insurance / yr
- $507 – $1,088
Fire risk 1/10 · Minimal
- Est. fire insurance / yr
- $947 – $1,759
Heat risk 9/10 · Severe
- Hot days now (above 107°F)
- 7 days/yr
- Hot days in 30 yrs
- 25 days/yr
Wind risk 10/10 · Severe
- Chance of severe wind over 30 yrs
- 99.0%
Air-quality risk 2/10 · Minimal
- Unhealthy air days now
- 1 days/yr
- Unhealthy air days in 30 yrs
- 3 days/yr
Risk factors via First Street. Map © Google.
Why this score? — see what drove the D+ grade
The composite is a weighted blend of 9 inputs, each scored 0–100. Each bar is that input's sub-score; the figure is the points it added to the 100-point composite (weight × sub-score).
- Cash flow +15.0/30.0
- ARV discount +7.5/15.0
- 1% rule +5.0/10.0
- DSCR +5.0/10.0
- Schools +4.1/10.0
- Livability +3.8/5.0
- Rent growth +2.9/5.0
- Condition / age +2.5/5.0
- Appreciation +0.0/10.0
$20,000
🖨 Deal sheet (PDF) 📄 Offer letter ✓ Due diligence
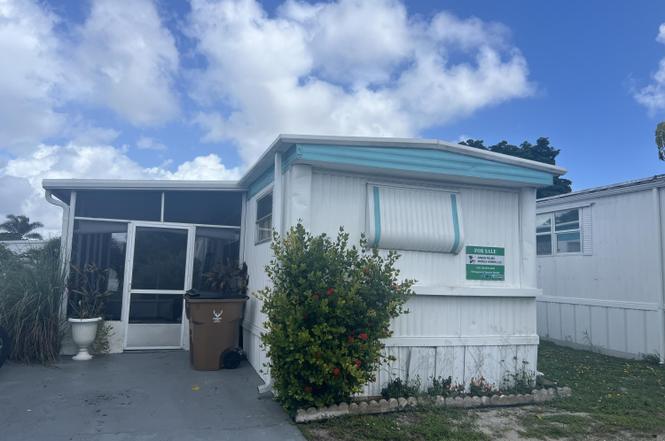
Listing remarks
THIS IS A 2/2 SINGLE SIZE MOBILE HOME, WELL MAINTAINED WITH 2 BEDROOMS, 2 BATH'S, NEW ROOF AND NEW A/C. DRIVEWAY TO FIT 2 CARS AND COVERED PORCH. WONDERFUL CLUBE HOUSE AND A LARGE POOL. LOCATED IN COUNTRY KNOLLS, A 55+ COMMUNITY. ONLY FEW MILES FROM THE DESIRABLE BEACH OF DEERFIELD, HOSPITAL, MAJOR ROADS, RESTAURANTS, AND MUCH MORE. CALL TODAY FOR AN APPOINTMENT. LOT RENTAL $955 MONTLY.
Key facts
- Covered porch
- Large pool
- New a/c
Tags
Property features AI
Finance
- Other: Living area reported as 800 (building area total 900)
- HOA & community: Senior community; Pets allowed with breed restrictions
Exterior
- Parking: Has garage; 2 garage spaces; Has carport; 2 covered parking spaces; Attached carport; Covered parking; Carport
- Utilities: Public water; Public sewer; Sewer available; Water available
- Home design: Mobile Home; Single-story; Faces east; Resale condition; Model LRKW
- Construction: Vinyl siding; Modular construction; Metal roof; Skirt: other; Mobile home remains on site; Mobile length 51; Mobile width 13; Total stories: 1
- Exterior features: Open porch; Porch
Interior
- Kitchen: Electric range; Microwave; Refrigerator
- Bedrooms: 2 bedrooms on the main level
- Flooring: Laminate flooring
- Bathrooms: 2 full bathrooms on the main level
- Heating & cooling: Central electric heating; Electric cooling with wall/window unit(s)
- Interior features: No additional interior features listed; Unfurnished
- Laundry & utility: Laundry inside
Neighborhood map
What this means for you Summary
Snapshot
- This is a 2-bed/2.0-bath manufactured listed at $20k.
Deal economics
- At list price, monthly cash flow is $2k ($20k/yr) — positive.
- The deal already cash-flows at list — no discount required.
- Meets the 1% rule at list price ($2k rent vs $20k).
- Recommended offer: $18k (12.0% below list) — sets the bar for market timing.
- Cap rate 105.3% vs local median 4.1% in Deerfield Beach — top-decile yield for the area; either an underpriced asset or a hidden risk that comps aren't pricing in. Stress-test before assuming the spread holds.
Location & tenants
- Location reads 75/100 on livability (#250 in FL, #3,970 nationally) — a middle-class / working-renter tenant base. Strengths: housing A+, health & safety A+, cost of living A; Watch: amenities D-, employment D-.
- Broward (suburban): math 42% / reading 53% proficiency, ranked #46 of 73 in FL (top 63%) — families likely to look elsewhere, expect single-tenant / working-renter base with shorter leases.
- Zoned schools: Nova Blanche Forman Elementary (math 35% / reading 55%, grade D-, #1,271 of 2,144 statewide, top 60%, 769 students, 72% FRL); Lyons Creek Middle School (math 49% / reading 53%, grade C, #237 of 571 statewide, top 43%, 1,757 students, 60% FRL); Deerfield Beach High School (math 12% / reading 37%, grade F, #505 of 667 statewide, top 79%, 2,251 students, 69% FRL) — zoned schools average 67% FRL vs 51% district-wide (16 pts higher); higher-poverty schools than district average — tighter screening recommended.
- Market conditions: Rents rising (+1.8%/yr); 595 active listings in the ZIP; 40 comparable units currently listed for rent nearby; rentals at typical pace (median 26d on market — plan ~3-4 weeks tenant-placement turnaround); 2,111 units permitted in Broward County in 2024 (1,265 in 5+ unit buildings).
- This rent runs 38% of the median local income ($71k/yr) — at the standard rent-burdened threshold; future hikes will face affordability resistance.
Forward outlook
- Local home prices are declining (-3.0%/yr); year-one equity from $138 of loan paydown is wiped out by about $600 of value loss. Plan a longer hold.
- Broward County population projected at +34% by 2050 — long-run rental-demand tailwind backs the buy-and-hold thesis.
- At projected returns (-3.0% appreciation + 1.8% rent growth), your $6k cash investment doubles in ~1 year — after that, you're playing with house money.
Negotiation context
- It's been on market 251 days — a 12% lower offer ($18k) is reasonable based on typical stale-listing flexibility.
Risks & watch-outs
- Climate carrying-cost: severe wind risk, 99% chance of damaging wind over 30y; extreme-heat days projected 7→25/yr by 2055 (HVAC capex compounding) — expect insurance premiums to compound above CPI over the hold.
Questions for the listing agent
- It's been on market 251 days. Have you received any prior offers? Is the seller open to a 12% concession, seller financing, or rate buy-down credit?
- Built in 1972 — when were the roof, HVAC, electrical panel, plumbing, and water heater last replaced?
- Why hasn't it sold? Are there any deal-killer items the seller is aware of (foundation, flood, title, zoning, code violations)?
- Is there a deadline driving the sale (1031 exchange, divorce, estate, relocation)? That informs how much negotiation room exists.
- Schools are D-rated, which usually means shorter tenancies and higher turnover. Who's the typical renter profile here, and what's been the actual vacancy rate?
- The area grade is low — what's the realistic commute time and amenity access for the typical tenant pool here? Any planned neighborhood developments (good or bad) we should know about?
- What's the average days-on-market for RENTAL listings here right now (not sales)? A rising rental-DOM trend means longer vacancies and softer asking-rent achievability than the comps imply.
- What's the recent tenant-quality profile in this submarket — average credit score on applications, eviction rate, late-payment / NSF rate, and stable-employment percentage? A property-management company in the area should have these aggregated.
- How much new for-sale + rental construction is in the pipeline within 1–3 miles? Heavy new supply typically softens prices + rents 12–24 months out; constrained supply supports both.
Investment metrics
- 1% rule
- 11.32% ✓
- Cap rate
- 105.34%
- Cash-on-cash
- 353.74%
- DSCR
- 16.74
- GRM
- 0.7
CMA / ARV
- ARV (on-the-fly)
- $70,400
- Comps found
- 1
Show comp detail 1 sale within ~0.75 mi
| Address | Dist | Beds/Ba | Sqft | Sold | Price | $/sf | Match |
|---|---|---|---|---|---|---|---|
| 118 NW 50th Ct | 0.02mi | 2/2.0 | 850 (+6%) | 13mo | $75,000 | $88 | 78 |
Match score weights: distance 35% · size 25% · config 20% · recency 20%. Top-matched comps best support the ARV.
Projected returns pro-forma
-3.0% appreciation · 1.75% rent growth · sell at horizon
- IRR
- —
- Equity multiple
- 18.70×
- Total profit
- $99,119
- Equity at exit
- $2,982
- IRR
- —
- Equity multiple
- 38.60×
- Total profit
- $210,576
- Equity at exit
- $1,729
Cash invested: $5,600 (down + closing). Projections, not guarantees.
Landlord ↔ Tenant lean methodology
- Overall (STATE)
- 87 Strongly Landlord-Friendly
- State Florida
- 87 Strongly Landlord-Friendly · R+3
- County
- — inherits STATE
- City
- — inherits STATE
ZIP-level market 33064
- Home prices YoY
- -18.7%
- Rents YoY
- 1.8%
- Active inventory
- 595
- Price-to-rent
- 0.7×
Monthly cashflow live
- Estimated rent
- $2,265 high interval (Pro) →
- Mortgage (P&I)
- −$105
- Tax est. 1.5%
- −$25 /mo · $300/yr
- Insurance
- −$8
- HOA
- −$0
- Vacancy / Maint / Mgmt
- −$476
- Net cashflow
- $1,651
Break-even live
Sensitivity live
| Price | -10% $1,665 | -5% $1,658 | +0% $1,651 | +5% $1,644 | +10% $1,637 |
|---|---|---|---|---|---|
| Rent | -10% $1,472 | -5% $1,561 | +0% $1,651 | +5% $1,740 | +10% $1,830 |
| Rate | -1.0pp $1,661 | -0.5pp $1,656 | base $1,651 | +0.5pp $1,646 | +1.0pp $1,640 |
UW: 25.0% down · 7.5% · 30yr · 1.5% tax · 5.0% vac · 8.0% maint · 8.0% mgmt
Financing live
Cash to close
- Down payment
- $5,000
- Closing costs
- $600
- Reserves months
- —
- Total cash needed
- —
Loan-product check · same deal, 3 products live
Conventional
25% down · 7.5% · 30yr
- Down + closing
- —
- Monthly P&I
- —
- Monthly cashflow
- —
- DSCR
- —
- Eligible?
- —
Personal DTI + credit; lowest rate.
DSCR
20% down · 8.5% · 30yr
- Down + closing
- —
- Monthly P&I
- —
- Monthly cashflow
- —
- DSCR
- —
- Eligible?
- —
No personal income docs; deal must DSCR.
Hard money
10% down · 12.0% · 12mo
- Down + closing
- —
- Monthly P&I
- —
- Monthly cashflow
- —
- DSCR
- —
- Eligible?
- —
Short-term bridge; refi at stabilization.
Rent comps 40 comps
| Address | Beds | Baths | Sqft | Rent | $/sqft | DOM | Units | Dist |
|---|---|---|---|---|---|---|---|---|
| 4905 NE 2nd Way Pompano Beach, FL | 2.0 | 1.0 | 1100 | $2,150 | $1.95 | 25d | 1 | 0.30mi |
| 4740 NE 2nd Ter Deerfield Beach, FL | 3.0 | 2.0 | 1000 | $3,250 | $3.25 | 25d | 1 | 0.32mi |
| 4740 NE 2nd Ter Deerfield Beach, FL | 3.0 | 2.0 | 1000 | $3,250 | $3.25 | 5d | 1 | 0.32mi |
| 640 Cypress Club Way Unit G Pompano Beach, FL | 2.0 | 2.0 | 891 | $1,950 | $2.19 | 25d | 1 | 0.43mi |
| 551 NW 46th St Deerfield Beach, FL | 2.0 | 2.0 | 952 | $2,485 | $2.61 | 25d | 1 | 0.44mi |
| 660 Cypress Club Way Unit L11 Deerfield Beach, FL | 1.0 | 1.0 | 605 | $1,625 | $2.69 | 13d | 1 | 0.47mi |
| 631 Cypress Lake Blvd Unit O17 Deerfield Beach, FL | 2.0 | 2.0 | 807 | $2,100 | $2.60 | 25d | 1 | 0.50mi |
| 631 Cypress Lake Blvd Unit P17 Deerfield Beach, FL | 2.0 | 2.0 | 807 | $1,950 | $2.42 | 13d | 1 | 0.50mi |
| 616 NW 47th St Deerfield Beach, FL | 2.0 | 2.0 | 793 | $2,495 | $3.15 | 6d | 1 | 0.53mi |
| 624 NW 47th St Deerfield Beach, FL | 2.0 | 2.0 | 793 | $2,100 | $2.65 | 16d | 1 | 0.53mi |
| 800 Cypress Park Way Unit F1 Deerfield Beach, FL | 2.0 | 2.0 | 807 | $2,000 | $2.48 | 25d | 1 | 0.55mi |
| 800 Cypress Park Way Unit M Pompano Beach, FL | 2.0 | 2.0 | 807 | $2,000 | $2.48 | 3d | 1 | 0.55mi |
| 671 Cypress Lake Blvd Unit D21 Deerfield Beach, FL | 3.0 | 2.0 | 974 | $2,250 | $2.31 | 13d | 1 | 0.55mi |
| 4332 NW 1st Ter Deerfield Beach, FL | 3.0 | 2.0 | 1095 | $3,000 | $2.74 | 6d | 1 | 0.57mi |
| 4332 NW 1st Ter Deerfield Beach, FL | 3.0 | 2.0 | 1095 | $3,000 | $2.74 | 25d | 1 | 0.57mi |
| 661 Cypress Lake Blvd Unit I20 Deerfield Beach, FL | 3.0 | 2.0 | 974 | $2,300 | $2.36 | 25d | 1 | 0.57mi |
| 661 Cypress Lake Blvd Unit I20 Deerfield Beach, FL | 3.0 | 2.0 | 974 | $2,250 | $2.31 | 2d | 1 | 0.57mi |
| 4325 NW 5th Ave Deerfield Beach, FL | 2.0 | 2.0 | 953 | $2,249 | $2.36 | 12d | 1 | 0.60mi |
| 731 Cypress Ln Unit D Pompano Beach, FL | 1.0 | 1.0 | 605 | $1,650 | $2.73 | 20d | 1 | 0.60mi |
| 840 Cypress Park Way Unit N3 Deerfield Beach, FL | 2.0 | 2.0 | 807 | $1,950 | $2.42 | 0d | 1 | 0.62mi |
| 331 NW 42nd Ct Unit 101 Pompano Beach, FL | 2.0 | 1.0 | 800 | $1,799 | $2.25 | 16d | 1 | 0.65mi |
| 311 NW 42nd Ct #101 Deerfield Beach, FL | 2.0 | 1.0 | 800 | $1,799 | $2.25 | 25d | 1 | 0.66mi |
| 351 NW 42nd Ct Apt 205 Pompano Beach, FL | 2.0 | 1.0 | 800 | $1,899 | $2.37 | 16d | 1 | 0.66mi |
| 520 NE 45th St Deerfield Beach, FL | 3.0 | 2.0 | 1030 | $2,800 | $2.72 | 25d | 1 | 0.66mi |
| 145 NW 41st Ct #11 Deerfield Beach, FL | 3.0 | 1.5 | 1004 | $2,490 | $2.48 | 21d | 1 | 0.67mi |
| 1230 S Military Trl #2014 Deerfield Beach, FL | 2.0 | 2.0 | 937 | $2,400 | $2.56 | 25d | 1 | 0.69mi |
| 1230 S Military Trl #2014 Deerfield Beach, FL | 2.0 | 2.0 | 937 | $2,400 | $2.56 | 18d | 1 | 0.69mi |
| 1234 S Military Trl #1811 Deerfield Beach, FL | 2.0 | 2.0 | 1099 | $2,500 | $2.27 | 25d | 1 | 0.70mi |
| 1250 S Military Trl #1612 Deerfield Beach, FL | 2.0 | 1.5 | 1035 | $2,500 | $2.42 | 6d | 1 | 0.70mi |
| 1244 S Military Trl #724 Deerfield Beach, FL | 2.0 | 1.5 | 916 | $1,950 | $2.13 | 15d | 1 | 0.70mi |
| 5350 NE 5th Ter Pompano Beach, FL | 2.0 | 1.0 | 950 | $1,900 | $2.00 | 25d | 1 | 0.72mi |
| 1266 S Military Trl Deerfield Beach, FL | 1.0–2.0 | 1.0–2.0 | 1050 | $2,550 | $2.43 | 23d | 2 | 0.73mi |
| 651 NW 42nd Ct #214 Deerfield Beach, FL | 2.0 | 1.0 | 721 | $1,695 | $2.35 | 25d | 1 | 0.74mi |
| 4450 Military Trl Unit 22 Pompano Beach, FL | 2.0 | 1.0 | 940 | $1,950 | $2.07 | 25d | 1 | 0.74mi |
| 831 SW 14th Ct Deerfield Beach, FL | 3.0 | 2.0 | 1056 | $2,850 | $2.70 | 25d | 1 | 0.76mi |
| 1272 S Military Trl #313 Deerfield Beach, FL | 2.0 | 2.0 | 900 | $2,390 | $2.66 | 23d | 1 | 0.77mi |
| 2355 SW 15th St Deerfield Beach, FL | 2.0 | 2.0 | 1100 | $2,098 | $1.91 | 25d | 2 | 0.78mi |
| 1100 S Military Trl Deerfield Beach, FL | 2.0–3.0 | 1.0–2.0 | 1119 | $2,250 | $2.01 | 25d | 2 | 0.78mi |
| 4394 NW 9th Ave Unit 20-1A Deerfield Beach, FL | 2.0 | 2.0 | 950 | $1,700 | $1.79 | 25d | 1 | 0.80mi |
| 4354 NW 9th Ave Unit 12-3D Pompano Beach, FL | 2.0 | 2.0 | 1040 | $2,000 | $1.92 | 25d | 1 | 0.80mi |
Listing history 13 events
-
2026-06-13statusdays on market $20,000 Pending 251 DOM
-
2026-06-09days on market $20,000 Active 249 DOM
-
2026-06-07days on market $20,000 Active 247 DOM
-
2026-06-04days on market $20,000 Active 244 DOM
-
2026-06-03days on market $20,000 Active 243 DOM
-
2026-06-02days on market $20,000 Active 242 DOM
-
2026-06-01days on market $20,000 Active 241 DOM
-
2026-05-31days on market $20,000 Active 240 DOM
-
2026-05-11price $20,000
-
2026-03-31price $28,000
-
2026-02-18price $35,000
-
2026-01-07price $39,900
-
2025-10-03$50,000 Active
ⓘ Source: listings_history table (triggers on properties + properties_extension) + one-shot
backfill from property_details.listing_events for pre-trigger history.
Climate risk First Street
- Flood 1/10 Low FEMA zone X (shaded) · 0% chance over 30 yrs
- Wildfire 1/10 Low
- Heat 9/10 Extreme 7 d/yr ≥107°F today · 25 d/yr by 30 yrs out
- Wind 10/10 Extreme 99% chance of damaging wind over 30 yrs
- Air quality 2/10 Low 1 unhealthy d/yr today · 3 by 30 yrs out
Nearby sold comps map
Loading sold comps map…
Walkable amenities ~0.75 mi
Loading nearby amenities…
Taxation est. · year 1
- Rental income
- $27,175
- − Mortgage interest
- −$1,120
- − Property taxes
- −$300
- − Insurance
- −$100
- − Repairs & maintenance
- −$2,174
- − Management
- −$2,174
- − Depreciation
- −$582
- Taxable income
- $20,725
- Est. tax owed @ 24.0%
- −$4,974
- After-tax cash flow
- $14,835/yr
For passive investors: Depreciation is non-cash, so a rental often shows a tax loss while cash-flowing — sheltering income. Rental losses are passive: they offset passive income freely, and up to $25,000/yr can offset ordinary (W-2) income if you actively participate and your MAGI is under $100k (phasing out to $0 by $150k); unused losses carry forward. On sale, claimed depreciation is recaptured at up to 25%, and gains may owe capital-gains tax (a 1031 exchange can defer both). Figures are a year-1 estimate at your 24.0% rate — not tax advice; consult a CPA.
Schools (NCES district)
- District
- Broward
- NCES district ID
- 1200180
- Math proficiency
- 42% ▼ -18.00%
- Reading proficiency
- 53% ▼ -5.00%
- Median HH income
- $52,139
- Composite
- 40.88/100
- National rank
- #3621
- State rank
- #46 of 73 in FL
Livability — Deerfield Beach
- Score
- 75/100
- State rank
- #250
- US rank
- #3970
Category grades
Schools grade is shown separately in the Schools card above.
Census & demographics
- Census place
- Deerfield Beach, FL
- County
- Broward County · 1,963,430 people
- City population
- 61,449
- Metro
- Miami-Fort Lauderdale-Pompano Beach, FL
- Population (ZIP)
- 64,563
- Household income
- $71,301
- Rent vs Own
- Severe rent burden
- 2907.0
Population outlook (Broward County) Hauer SSP2
- Today (2025)
- 2,207,033 people
- By 2030
- 2,360,704 · +7.0%
- By 2040
- 2,661,208 · +20.6%
- By 2050
- 2,946,698 · +33.5%
- By 2075
- 3,602,273 · +63.2%
- By 2100
- 3,970,984 · +79.9%
Race, ethnicity, and origin ACS 2023
- Neighborhood character
- Highly diverse neighborhood (Simpson 0.75)
- Race & ethnicity
- White 34% Hispanic / Latino 27% Black 25% Two or more races 24% Asian 2%
- Hispanic origin (detail)
- Mexican 4% Puerto Rican 4% Cuban 4% Dominican 2%
- Common ancestry
- Hispanic 13% Estonian 10% Romanian 1%
- Foreign-born
- 43% · Canada, Jamaica, Dominican Republic
- Languages at home
- 45% English-only · Spanish 23% French/Haitian/Cajun 16% Other Indo-European 13%
Political lean MEDSL · Broward
- 2024 margin
- D (+17.0) · D 58.0% · R 41.0%
- 2008→2024 swing
- -17.8pp toward R · 2008: 34.7pp · 2024: 17.0pp
- All cycles
- 2024: D+17.0 2020: D+29.8 2016: D+35.0 2012: D+34.9 2008: D+34.7
Not yet ingested
- Civics
- —
Market trends
- HPI YoY
- ▼ -109.09%
- Current HPI
- 474.7007
- Rent YoY
- ▲ 1.75%
- Metro
- Miami-Fort Lauderdale-Pompano Beach, FL
- State GDP YoY
- ▲ 3.28%
- F500 in state
- 36
Industry mix (Fortune 500 HQ in FL)
| Industry | F500 HQs | Revenue |
|---|---|---|
| Industrial Technology | 2 | $29B |
|
||
| Insurance | 2 | $17B |
|
||
| Retail | 1 | $60B |
|
||
| Technology Distribution | 1 | $58B |
|
||
| Homebuilding | 1 | $35B |
|
||
| Technology Manufacturing | 1 | $35B |
|
||
Price history
-60.0% since first listed5 events — show timeline
- 2026-05-11 Price Changed $20,000 Beaches MLS
- 2026-03-31 Price Changed $28,000 Beaches MLS
- 2026-02-18 Price Changed $35,000 Beaches MLS
- 2026-01-07 Price Changed $39,900 Beaches MLS
- 2025-10-03 Listed $50,000 Beaches MLS
Cash-flow waterfall
monthlySold comps — $/sqft
last 12 mo · ≤1 miLoading sold comps…