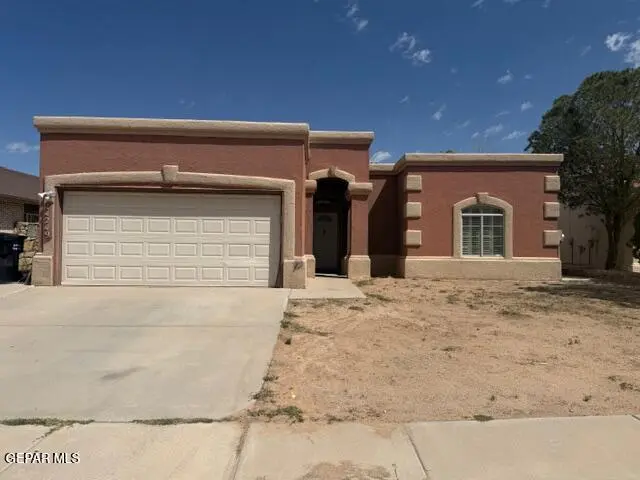
14249 Desert Sage Dr · Horizon City, TX
Flood risk 1/10 · Minimal
- FEMA flood zone
- X
- Chance of flooding over 30 yrs
- 0.0%
- Est. flood insurance / yr
- $507 – $1,088
Fire risk 4/10 · Minor
- Est. fire insurance / yr
- $1,222 – $2,270
Heat risk 5/10 · Moderate
- Hot days now (above 100°F)
- 6 days/yr
- Hot days in 30 yrs
- 22 days/yr
Wind risk 1/10 · Minimal
- Chance of severe wind over 30 yrs
- —
Air-quality risk 3/10 · Minor
- Unhealthy air days now
- 2 days/yr
- Unhealthy air days in 30 yrs
- 2 days/yr
Risk factors via First Street. Map © Google.
Why this score? — see what drove the D grade
The composite is a weighted blend of 9 inputs, each scored 0–100. Each bar is that input's sub-score; the figure is the points it added to the 100-point composite (weight × sub-score).
- Cash flow +13.6/30.0
- ARV discount +7.5/15.0
- 1% rule +5.5/10.0
- DSCR +4.1/10.0
- Livability +3.3/5.0
- Rent growth +3.2/5.0
- Condition / age +2.5/5.0
- Schools +1.5/10.0
- Appreciation +0.0/10.0
$180,000
🖨 Deal sheet (PDF) 📄 Offer letter ✓ Due diligence
Listing remarks
I invite you to view this home located in an established subdivision in Horizon City. The property features three bedrooms, two full bathrooms, refrigerated air, double car garage, and a spacious backyard. Please note that the home requires some repairs and upgrades, which is reflected in the current sales price.
Key facts
- Refrigerated air
- Repairs and upgrades
- Spacious backyard
Tags
Property features AI
Finance
- Other: Fixer upper; See remarks
- HOA & community: No HOA fees
Exterior
- Parking: 2-car garage
- Utilities: Has heating; Has cooling
- Home design: Single family residence
- Construction: Stucco and frame construction; Rolled/hot mop and flat roof; Total building area 1425
- Exterior features: Walled backyard; Back yard fencing; Open patio
Interior
- Kitchen: Dishwasher; Free-standing gas oven; Microwave
- Flooring: Tile
- Bathrooms: 2 full bathrooms
- Heating & cooling: Central heating; Refrigerated cooling; Ceiling fans
- Interior features: Ceiling fans; Pantry; Walk-in closets; Single-pane windows
Neighborhood map
What this means for you Summary
Snapshot
- This is a 3-bed/2.0-bath single-family listed at $180k.
Deal economics
- At list price, monthly cash flow is $11 ($132/yr) — positive.
- The deal already cash-flows at list — no discount required.
- Meets the 1% rule at list price ($2k rent vs $180k).
- Recommended offer: $175k (3.0% below list) — sets the bar for market timing.
Location & tenants
- Location reads 66/100 on livability (#619 in TX) — a middle-class / working-renter tenant base. Strengths: crime A+, cost of living A+, housing A+; Watch: employment D, amenities F, commute F.
- Clint ISD (suburban): math 14% / reading 22% proficiency, ranked #792 of 826 in TX (top 96%) — low school quality limits family demand, transient renter base, plan for 1-2y turnover.
- Zoned schools: Desert Hills El (math 23% / reading 24%, grade F, #3,247 of 4,322 statewide, top 76%, 907 students, 78% FRL); Horizon Middle (math 16% / reading 20%, grade F, #1,491 of 1,662 statewide, top 91%, 670 students, 84% FRL); Horizon H S (math 14% / reading 26%, grade F, #1,397 of 1,632 statewide, top 87%, 1,677 students, 85% FRL) — zoned schools average 82% FRL vs 59% district-wide (23 pts higher); higher-poverty schools than district average — tighter screening recommended.
- Market conditions: Rents rising (+2.9%/yr); 2098 active listings in the ZIP; 28 comparable units currently listed for rent nearby; rentals at typical pace (median 16d on market — plan ~3-4 weeks tenant-placement turnaround); solid renter incomes; 2,196 units permitted in El Paso County in 2024 (143 in 5+ unit buildings).
Forward outlook
- Local home prices are declining (-3.0%/yr); year-one equity from $1k of loan paydown is wiped out by about $5k of value loss. Plan a longer hold.
- El Paso County population projected at +10% by 2050 — modest demand growth; plan on rents tracking national, not racing it.
Negotiation context
- It's been on market 42 days — a 3% lower offer ($175k) is reasonable based on typical stale-listing flexibility.
- 4 sale attempts since 19y ago with the ask held roughly flat each time — persistent listings suggest the price (not the market) is what's stuck; bring a comps-based counter.
Risks & watch-outs
- Watch-outs: property tax is 3.1% of price.
- Climate carrying-cost: extreme-heat days projected 6→22/yr by 2055 (HVAC capex compounding) — expect insurance premiums to compound above CPI over the hold.
Questions for the listing agent
- It's been on market 42 days. Have you received any prior offers? Is the seller open to a 3% concession, seller financing, or rate buy-down credit?
- Property tax is high relative to price — has the assessment been appealed recently, and will the sale trigger a re-assessment?
- Is there a deadline driving the sale (1031 exchange, divorce, estate, relocation)? That informs how much negotiation room exists.
- Schools are D-rated, which usually means shorter tenancies and higher turnover. Who's the typical renter profile here, and what's been the actual vacancy rate?
- The area grade is low — what's the realistic commute time and amenity access for the typical tenant pool here? Any planned neighborhood developments (good or bad) we should know about?
- What's the average days-on-market for RENTAL listings here right now (not sales)? A rising rental-DOM trend means longer vacancies and softer asking-rent achievability than the comps imply.
- What's the recent tenant-quality profile in this submarket — average credit score on applications, eviction rate, late-payment / NSF rate, and stable-employment percentage? A property-management company in the area should have these aggregated.
- How much new for-sale + rental construction is in the pipeline within 1–3 miles? Heavy new supply typically softens prices + rents 12–24 months out; constrained supply supports both.
Investment metrics
- 1% rule
- 1.05% ✓
- Cap rate
- 6.37%
- Cash-on-cash
- 0.26%
- DSCR
- 1.01
- GRM
- 8.0
CMA / ARV
No comps found within radius.
Projected returns pro-forma
-3.0% appreciation · 2.93% rent growth · sell at horizon
- IRR
- -15.9%
- Equity multiple
- 0.44×
- Total profit
- $-28,426
- Equity at exit
- $26,839
- IRR
- -7.4%
- Equity multiple
- 0.53×
- Total profit
- $-23,690
- Equity at exit
- $15,563
Cash invested: $50,400 (down + closing). Projections, not guarantees.
Landlord ↔ Tenant lean methodology
- Overall (STATE)
- 87 Strongly Landlord-Friendly
- State Texas
- 87 Strongly Landlord-Friendly · R+5
- County
- — inherits STATE
- City
- — inherits STATE
ZIP-level market 79928
- Home prices YoY
- -16.9%
- Rents YoY
- 2.9%
- Active inventory
- 2098
- Price-to-rent
- 8.0×
Monthly cashflow live
- Estimated rent
- $1,887 high interval (Pro) →
- Mortgage (P&I)
- −$944
- Tax from tax record
- −$461 /mo · $5,527/yr
- Insurance
- −$75
- HOA
- −$0
- Vacancy / Maint / Mgmt
- −$396
- Net cashflow
- $11
Break-even live
Sensitivity live
| Price | -10% $113 | -5% $62 | +0% $11 | +5% $-40 | +10% $-91 |
|---|---|---|---|---|---|
| Rent | -10% $-138 | -5% $-64 | +0% $11 | +5% $86 | +10% $160 |
| Rate | -1.0pp $102 | -0.5pp $57 | base $11 | +0.5pp $-36 | +1.0pp $-83 |
UW: 25.0% down · 7.5% · 30yr · 1.5% tax · 5.0% vac · 8.0% maint · 8.0% mgmt
Financing live
Cash to close
- Down payment
- $45,000
- Closing costs
- $5,400
- Reserves months
- —
- Total cash needed
- —
Loan-product check · same deal, 3 products live
Conventional
25% down · 7.5% · 30yr
- Down + closing
- —
- Monthly P&I
- —
- Monthly cashflow
- —
- DSCR
- —
- Eligible?
- —
Personal DTI + credit; lowest rate.
DSCR
20% down · 8.5% · 30yr
- Down + closing
- —
- Monthly P&I
- —
- Monthly cashflow
- —
- DSCR
- —
- Eligible?
- —
No personal income docs; deal must DSCR.
Hard money
10% down · 12.0% · 12mo
- Down + closing
- —
- Monthly P&I
- —
- Monthly cashflow
- —
- DSCR
- —
- Eligible?
- —
Short-term bridge; refi at stabilization.
Rent comps 28 comps
| Address | Beds | Baths | Sqft | Rent | $/sqft | DOM | Units | Dist |
|---|---|---|---|---|---|---|---|---|
| 732 Desert Sage Dr Horizon City, TX | 4.0 | 2.0 | 1420 | $1,635 | $1.15 | 4d | 1 | 0.18mi |
| 732 Desert Sage Dr Horizon City, TX | 4.0 | 2.0 | 1420 | $1,635 | $1.15 | 12d | 1 | 0.18mi |
| 14324 Desert Shadow Dr Horizon City, TX | 3.0 | 2.0 | 1250 | $1,600 | $1.28 | 16d | 1 | 0.26mi |
| 644 Paseo Dulce Ave El Paso, TX | 4.0 | 2.0 | 1509 | $2,200 | $1.46 | 45d | 1 | 0.52mi |
| 840 Paseo Dulce Ave El Paso, TX | 4.0 | 2.0 | 1600 | $1,800 | $1.12 | 45d | 1 | 0.65mi |
| 909 Larkhall Pl El Paso, TX | 4.0 | 2.0 | 1614 | $1,900 | $1.18 | 45d | 1 | 0.73mi |
| 424 Cutler Pl Horizon City, TX | 3.0 | 2.0 | 1874 | $1,895 | $1.01 | 4d | 1 | 0.75mi |
| 544 Cedarwood Ave El Paso, TX | 3.0 | 2.0 | 1523 | $1,795 | $1.18 | 45d | 1 | 0.75mi |
| 13865 Lorenz Ave El Paso, TX | 4.0 | 2.0 | 1510 | $2,000 | $1.32 | 45d | 1 | 0.77mi |
| 14044 Peter Noyes Dr El Paso, TX | 4.0 | 2.0 | 1594 | $1,650 | $1.04 | 5d | 1 | 0.90mi |
| 305 De Palma Pl El Paso, TX | 4.0 | 2.0 | 1467 | $1,635 | $1.11 | 45d | 1 | 0.91mi |
| 304 Jim Hofher Pl El Paso, TX | 4.0 | 2.0 | 1466 | $1,600 | $1.09 | 5d | 1 | 0.92mi |
| 1088 Sky River St El Paso, TX | 4.0 | 2.0 | 1651 | $1,865 | $1.13 | 4d | 1 | 0.98mi |
| 14321 Bill Lazor Pkwy El Paso, TX | 3.0 | 2.0 | 1164 | $1,925 | $1.65 | 45d | 1 | 1.06mi |
| 1173 Summer Rain St Horizon City, TX | 4.0 | 2.0 | 1504 | $1,900 | $1.26 | 16d | 1 | 1.10mi |
| 1181 Summer Rain St Horizon City, TX | 3.0 | 2.0 | 1490 | $1,750 | $1.17 | 45d | 1 | 1.11mi |
| 1188 Summer Rain St Horizon City, TX | 3.0 | 2.0 | 1738 | $2,000 | $1.15 | 16d | 1 | 1.12mi |
| 13992 Margaret Ponce Ave El Paso, TX | 4.0 | 2.5 | 1765 | $2,500 | $1.42 | 4d | 1 | 1.15mi |
| 13709 Paseo Sereno Dr El Paso, TX | 4.0 | 2.0 | 1757 | $1,800 | $1.02 | 25d | 1 | 1.19mi |
| 737 Sculcoates St Horizon City, TX | 3.0 | 2.0 | 1354 | $1,735 | $1.28 | 45d | 1 | 1.21mi |
| 13668 Garforth Ave El Paso, TX | 3.0 | 2.0 | 1364 | $1,675 | $1.23 | 16d | 1 | 1.31mi |
| 14364 Nick Drahos Ln El Paso, TX | 3.0 | 2.0 | 1066 | $1,700 | $1.59 | 13d | 1 | 1.32mi |
| 1217 Golden Summer Ct Horizon City, TX | 4.0 | 3.0 | 1754 | $1,950 | $1.11 | 45d | 1 | 1.33mi |
| 13972 Summer Valley Dr El Paso, TX | 3.0 | 2.0 | 1723 | $2,300 | $1.33 | 16d | 1 | 1.36mi |
| 13677 Holbeck St El Paso, TX | 4.0 | 2.0 | 1869 | $2,060 | $1.10 | 45d | 1 | 1.37mi |
| 13520 Eastlake Blvd Horizon City, TX | 1.0–3.0 | 1.0–2.0 | 962 | $1,850 | $1.92 | 4d | 9 | 1.40mi |
| 13961 Victory Sky Ave El Paso, TX | 3.0 | 2.0 | 1330 | $1,850 | $1.39 | 16d | 1 | 1.43mi |
| 13988 Summer Hail Ave El Paso, TX | 3.0 | 2.0 | 1602 | $2,200 | $1.37 | 4d | 1 | 1.46mi |
Listing history 12 events
-
2026-06-22days on market $180,000 Active 42 DOM
-
2026-06-18days on market $180,000 Active 39 DOM
-
2026-06-17days on market $180,000 Active 38 DOM
-
2026-06-16days on market $180,000 Active 37 DOM
-
2026-06-15days on market $180,000 Active 36 DOM
-
2026-06-13status $180,000 Active 34 DOM
-
2026-04-24$180,000 Active 318-char remark
-
2018-12-06historical
-
2011-06-28soldstatus
-
2011-04-18historical
-
2011-04-17$115,000
-
2007-12-13$96,950
ⓘ Source: listings_history table (triggers on properties + properties_extension) + one-shot
backfill from property_details.listing_events for pre-trigger history.
Tax reassessment forecast TX · Resets to sale price
- Current annual tax
- $5,527 · $461/mo
- Projected year-2 tax
- $5,527 · $461/mo
- Expected delta
- $0/yr ($0/mo · 0.0%)
ⓘ Screening estimate from a state-policy table — verify with the county assessor before closing.
Climate risk First Street
- Flood 1/10 Low FEMA zone X · 0% chance over 30 yrs
- Wildfire 4/10 Moderate
- Heat 5/10 Major 6 d/yr ≥100°F today · 22 d/yr by 30 yrs out
- Wind 1/10 Low
- Air quality 3/10 Moderate 2 unhealthy d/yr today · 2 by 30 yrs out
Nearby sold comps map
Loading sold comps map…
Walkable amenities ~0.75 mi
Loading nearby amenities…
Taxation est. · year 1
- Rental income
- $22,641
- − Mortgage interest
- −$10,083
- − Property taxes
- −$5,527
- − Insurance
- −$900
- − Repairs & maintenance
- −$1,811
- − Management
- −$1,811
- − Depreciation
- −$5,236
- Taxable loss
- −$2,728
- Est. tax savings @ 24.0%
- +$655
- After-tax cash flow
- $787/yr
For passive investors: Depreciation is non-cash, so a rental often shows a tax loss while cash-flowing — sheltering income. Rental losses are passive: they offset passive income freely, and up to $25,000/yr can offset ordinary (W-2) income if you actively participate and your MAGI is under $100k (phasing out to $0 by $150k); unused losses carry forward. On sale, claimed depreciation is recaptured at up to 25%, and gains may owe capital-gains tax (a 1031 exchange can defer both). Figures are a year-1 estimate at your 24.0% rate — not tax advice; consult a CPA.
Schools (NCES district)
- District
- Clint ISD
- NCES district ID
- 4814430
- Math proficiency
- 14% ▼ -32.00%
- Reading proficiency
- 22% ▼ -15.00%
- Median HH income
- $37,490
- Composite
- 15.03/100
- National rank
- #9356
- State rank
- #792 of 826 in TX
Livability — Horizon City
- Score
- 66/100
- State rank
- #619
- US rank
- #11815
Category grades
Schools grade is shown separately in the Schools card above.
Census & demographics
- Census place
- Horizon City, TX
- County
- El Paso County · 761,266 people
- City population
- 86,599
- Metro
- El Paso, TX
- Population (ZIP)
- 86,599
- Household income
- $76,643
- Rent vs Own
- Severe rent burden
- 838.0
Population outlook (El Paso County) Hauer SSP2
- Today (2025)
- 897,899 people
- By 2030
- 922,694 · +2.8%
- By 2040
- 960,492 · +7.0%
- By 2050
- 982,919 · +9.5%
- By 2075
- 997,266 · +11.1%
- By 2100
- 900,630 · +0.3%
Race, ethnicity, and origin ACS 2023
- Neighborhood character
- Predominantly Hispanic (89%)
- Race & ethnicity
- Hispanic / Latino 89% Two or more races 39% White 7% Black 2% Native American 2%
- Hispanic origin (detail)
- Mexican 84%
- Foreign-born
- 23% · Canada
- Languages at home
- 25% English-only · Spanish 74% Other Asian/Pacific 1%
Political lean MEDSL · El Paso
- 2024 margin
- D (+15.1) · D 57.0% · R 41.8% · Other 1.2%
- 2008→2024 swing
- -17.4pp toward R · 2008: 32.5pp · 2024: 15.1pp
- All cycles
- 2024: D+15.1 2020: D+35.1 2016: D+43.2 2012: D+32.6 2008: D+32.5
Not yet ingested
- Civics
- —
Market trends
- HPI YoY
- ▼ -40.72%
- Current HPI
- 200.6454
- Rent YoY
- ▲ 2.93%
- Metro
- El Paso, TX
- State GDP YoY
- ▲ 3.95%
- F500 in state
- 110
Industry mix (Fortune 500 HQ in TX)
| Industry | F500 HQs | Revenue |
|---|---|---|
| Energy | 16 | $1,198B |
|
||
| Technology | 5 | $198B |
|
||
| Engineering / Construction | 4 | $72B |
|
||
| Energy Services | 3 | $60B |
|
||
| Utilities | 3 | $41B |
|
||
| Healthcare | 2 | $330B |
|
||
Price history
+85.7% since first listed8 events — show timeline
- 2026-06-13 Relisted — GEPARMLS
- 2026-05-28 Pending — GEPARMLS
- 2026-04-24 Listed $180,000 GEPARMLS
- 2018-12-06 Listing Removed — GEPARMLS
- 2011-06-28 Sold (Public Records) — Public Records
- 2011-04-18 Listing Removed — GEPARMLS
- 2011-04-17 Listed $115,000 GEPARMLS
- 2007-12-13 Listed $96,950 GEPARMLS
Property tax history
+4.5%/yrLatest (2025): $5,527 · +10.4% YoY. Source: county tax records.
Cash-flow waterfall
monthlySold comps — $/sqft
last 12 mo · ≤1 miLoading sold comps…