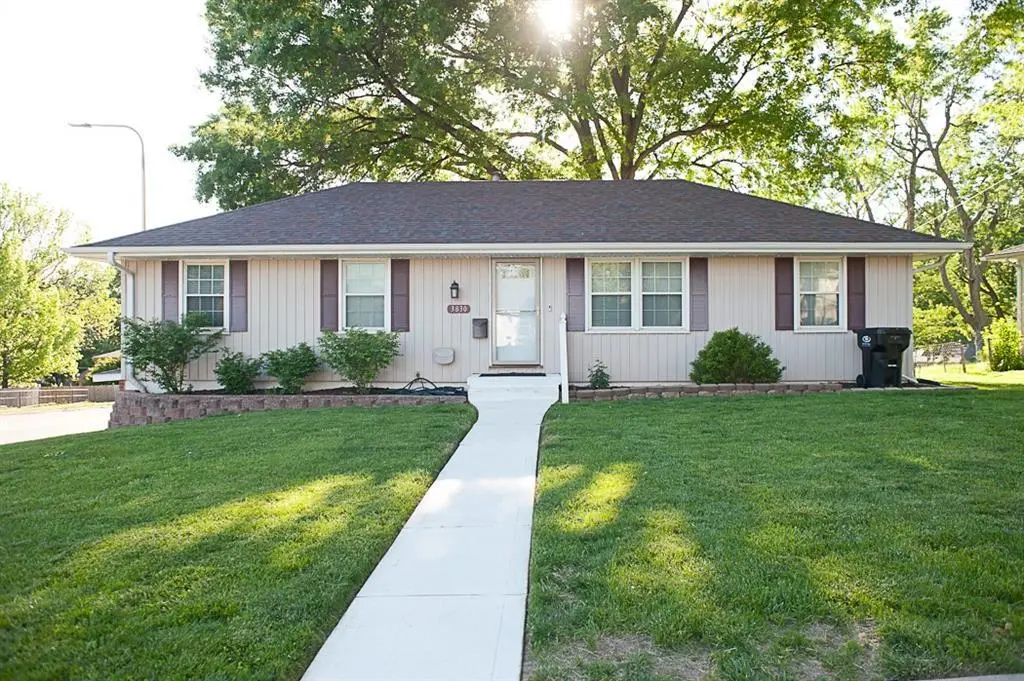
3830 S Breckenridge Dr · Independence, MO
Flood risk 1/10 · Minimal
- FEMA flood zone
- X (unshaded)
- Chance of flooding over 30 yrs
- 0.0%
- Est. flood insurance / yr
- $473 – $860
Fire risk 1/10 · Minimal
- Est. fire insurance / yr
- $1,054 – $1,958
Heat risk 4/10 · Minor
- Hot days now (above 107°F)
- 7 days/yr
- Hot days in 30 yrs
- 17 days/yr
Wind risk 2/10 · Minimal
- Chance of severe wind over 30 yrs
- —
Air-quality risk 3/10 · Minor
- Unhealthy air days now
- 3 days/yr
- Unhealthy air days in 30 yrs
- 3 days/yr
Risk factors via First Street. Map © Google.
Why this score? — see what drove the D- grade
The composite is a weighted blend of 9 inputs, each scored 0–100. Each bar is that input's sub-score; the figure is the points it added to the 100-point composite (weight × sub-score).
- ARV discount +10.4/15.0
- Cash flow +8.1/30.0
- Livability +4.1/5.0
- Rent growth +3.8/5.0
- Schools +2.7/10.0
- Condition / age +2.5/5.0
- DSCR +2.1/10.0
- 1% rule +1.9/10.0
- Appreciation +0.0/10.0
$235,000
🖨 Deal sheet (PDF) 📄 Offer letter ✓ Due diligence
Listing remarks MLS
Don’t pass up this beautiful home in a quiet cul-de-sac with maintenance free siding, newer roof, new interior paint and carpet. This home features two living spaces and a finished basement which could also be used as a non conforming bedroom. Washer and dryer hookups are located upstairs and downstairs and could be taken out on the upper level if desired. Enjoy watching your kiddos or fur babies have fun in the fenced in backyard. Close to restaurants and shopping for your convenience.
Key facts
- 0.25 acre lot
- 2 garage spots
- Built 1966
Property features AI
Exterior
- Parking: Attached garage that faces the side; 2-car garage
- Utilities: Public water; Public sewer
- Home design: Single-family residence; Raised ranch floor plan
- Construction: Vinyl siding; Composition roof
- Exterior features: Patio; Shed(s); Fenced yard (other)
Interior
- Kitchen: Kitchen with dining area combo
- Bedrooms: 3 bedrooms
- Bathrooms: 2 full bathrooms
- Heating & cooling: Natural gas heating; Electric cooling (central cooling present)
- Interior features: Window coverings
- Laundry & utility: Laundry on main level; Laundry in basement
Neighborhood map
What this means for you Summary
Snapshot
- This is a 3-bed/1.0-bath single-family listed at $235k.
Deal economics
- At list price, monthly cash flow is $-233 ($-3k/yr) — negative.
- To cash-flow at today's rent, offer at most $194k (17.5% below list).
- To meet the 1% rule (rent ≥ 1% of price), the offer needs to be $163k (30.7% below list).
- Recommended offer: $163k (30.7% below list) — sets the bar for 1% rule.
Location & tenants
- Location reads 82/100 on livability (#10 in MO, #1,296 nationally) — a professional / high-income tenant draw. Strengths: amenities A+, commute A+, cost of living A+; Watch: employment D+, crime F.
- Independence 30 (suburban): math 26% / reading 38% proficiency, ranked #252 of 324 in MO (top 78%) — families likely to look elsewhere, expect single-tenant / working-renter base with shorter leases.
- Zoned schools: Sycamore Hills Elem. (math 42% / reading 47%, grade F, #413 of 1,115 statewide, top 42%, 543 students, 55% FRL); Bridger Middle (math 32% / reading 38%, grade F, #240 of 391 statewide, top 62%, 770 students, 65% FRL); Truman High (math 18% / reading 34%, grade F, #430 of 521 statewide, top 83%, 1,662 students, 52% FRL) — zoned schools at 57% FRL track the district average.
- Market conditions: Rents rising fast (+5.1%/yr); 203 active listings in the ZIP; 18 comparable units currently listed for rent nearby; rentals at typical pace (median 23d on market — plan ~3-4 weeks tenant-placement turnaround); 4,002 units permitted in Jackson County in 2024 (2,271 in 5+ unit buildings).
- This rent runs 31% of the median local income ($62k/yr) — at the standard rent-burdened threshold; future hikes will face affordability resistance.
Forward outlook
- Local home prices are declining (-3.0%/yr); year-one equity from $2k of loan paydown is wiped out by about $7k of value loss. Plan a longer hold.
- Jackson County population projected at +4% by 2050 — modest demand growth; plan on rents tracking national, not racing it.
Negotiation context
- It's been on market 22 days — a 2% lower offer ($231k) is reasonable based on typical stale-listing flexibility.
- 2 sale attempts since 7y ago; this cycle's ask has dropped $25k (10%) from the opening price — seller is motivated, your offer sets the floor, not the list.
Questions for the listing agent
- What do current leases actually rent for vs. the listed asking? Can we see a recent rent roll and the last 12 months of T-12 income?
- Built in 1966 — when were the roof, HVAC, electrical panel, plumbing, and water heater last replaced?
- Is there a deadline driving the sale (1031 exchange, divorce, estate, relocation)? That informs how much negotiation room exists.
- Crime grade is F in this area — have there been break-ins, vandalism, or insurance claims at this property in the last 3 years? What carrier currently insures it and at what premium?
- The area grade is low — what's the realistic commute time and amenity access for the typical tenant pool here? Any planned neighborhood developments (good or bad) we should know about?
- What's the average days-on-market for RENTAL listings here right now (not sales)? A rising rental-DOM trend means longer vacancies and softer asking-rent achievability than the comps imply.
- What's the recent tenant-quality profile in this submarket — average credit score on applications, eviction rate, late-payment / NSF rate, and stable-employment percentage? A property-management company in the area should have these aggregated.
- How much new for-sale + rental construction is in the pipeline within 1–3 miles? Heavy new supply typically softens prices + rents 12–24 months out; constrained supply supports both.
Investment metrics
- 1% rule
- 0.69% ✗
- Cap rate
- 5.10%
- Cash-on-cash
- -4.25%
- DSCR
- 0.81
- GRM
- 12.0
CMA / ARV
- ARV (median comp)
- $250,969
- List price
- $235,000
- Delta
- -6.36%
- Verdict
- FAIR
- Comps
- 20 within 1.0 mi
Show comp detail 12 sales within ~0.75 mi
| Address | Dist | Beds/Ba | Sqft | Sold | Price | $/sf | Match |
|---|---|---|---|---|---|---|---|
| 15300 E 36th Ter S | 0.44mi | 3/1.0 | 1,220 (+2%) | 0mo | $219,900 | $180 | 76 |
| 3700 Randall Dr | 0.51mi | 3/1.5 | 1,180 (-2%) | 4mo | $245,000 | $208 | 68 |
| 3830 S Summit Ridge Dr | 0.26mi | 3/2.0 | 1,324 (+10%) | 8mo | $210,000 | $159 | 60 |
| 15804 E 42nd Pl | 0.35mi | 3/1.5 | 1,338 (+12%) | 8mo | $210,000 | $157 | 55 |
| 4222 E 42nd Street Ct | 0.65mi | 3/1.0 | 1,150 (-4%) | 10mo | $229,900 | $200 | 54 |
| 3527 S Adams Ave | 0.51mi | 3/1.5 | 1,035 (-14%) | 1mo | $195,000 | $188 | 50 |
| 3518 S Haden Dr | 0.44mi | 3/2.0 | 1,350 (+12%) | 6mo | $240,500 | $178 | 49 |
| 14805 E 40th St S | 0.63mi | 3/1.5 | 1,107 (-8%) | 8mo | $185,000 | $167 | 49 |
| 16515 E 35th Ter | 0.56mi | 3/1.0 | 1,353 (+13%) | 4mo | $215,000 | $159 | 49 |
| 16524 E 35th St | 0.64mi | 3/1.0 | 1,053 (-12%) | 5mo | $224,900 | $214 | 46 |
| 3506 S Haden Dr | 0.51mi | 3/2.0 | 1,028 (-14%) | 3mo | $205,000 | $199 | 46 |
| 16722 E 35th Ter | 0.67mi | 3/2.0 | 1,053 (-12%) | 10mo | $225,000 | $214 | 36 |
Match score weights: distance 35% · size 25% · config 20% · recency 20%. Top-matched comps best support the ARV.
Projected returns pro-forma
-3.0% appreciation · 5.09% rent growth · sell at horizon
- IRR
- -21.4%
- Equity multiple
- 0.25×
- Total profit
- $-49,473
- Equity at exit
- $35,039
- IRR
- -11.1%
- Equity multiple
- 0.28×
- Total profit
- $-47,384
- Equity at exit
- $20,319
Cash invested: $65,800 (down + closing). Projections, not guarantees.
Landlord ↔ Tenant lean methodology
- Overall (STATE)
- 81 Strongly Landlord-Friendly
- State Missouri
- 81 Strongly Landlord-Friendly · R+10
- County
- — inherits STATE
- City
- — inherits STATE
ZIP-level market 64055
- Rents YoY
- 5.1%
- Active inventory
- 203
- Price-to-rent
- 12.0×
Monthly cashflow live
- Estimated rent
- $1,629 high interval (Pro) →
- Mortgage (P&I)
- −$1,232
- Tax from tax record
- −$190 /mo · $2,281/yr
- Insurance
- −$98
- HOA
- −$0
- Vacancy / Maint / Mgmt
- −$342
- Net cashflow
- $-233
Break-even live
Sensitivity live
| Price | -10% $-100 | -5% $-167 | +0% $-233 | +5% $-300 | +10% $-366 |
|---|---|---|---|---|---|
| Rent | -10% $-362 | -5% $-298 | +0% $-233 | +5% $-169 | +10% $-104 |
| Rate | -1.0pp $-115 | -0.5pp $-173 | base $-233 | +0.5pp $-294 | +1.0pp $-356 |
UW: 25.0% down · 7.5% · 30yr · 1.5% tax · 5.0% vac · 8.0% maint · 8.0% mgmt
Financing live
Cash to close
- Down payment
- $58,750
- Closing costs
- $7,050
- Reserves months
- —
- Total cash needed
- —
Loan-product check · same deal, 3 products live
Conventional
25% down · 7.5% · 30yr
- Down + closing
- —
- Monthly P&I
- —
- Monthly cashflow
- —
- DSCR
- —
- Eligible?
- —
Personal DTI + credit; lowest rate.
DSCR
20% down · 8.5% · 30yr
- Down + closing
- —
- Monthly P&I
- —
- Monthly cashflow
- —
- DSCR
- —
- Eligible?
- —
No personal income docs; deal must DSCR.
Hard money
10% down · 12.0% · 12mo
- Down + closing
- —
- Monthly P&I
- —
- Monthly cashflow
- —
- DSCR
- —
- Eligible?
- —
Short-term bridge; refi at stabilization.
Rent comps 18 comps
| Address | Beds | Baths | Sqft | Rent | $/sqft | DOM | Units | Dist |
|---|---|---|---|---|---|---|---|---|
| 3605 S Stayton Ave Independence, MO | 3.0 | 2.0 | 1078 | $1,631 | $1.51 | 9d | 1 | 0.38mi |
| 3100 Quail Creek Dr Independence, MO | 1.0–2.0 | 1.0 | 961 | $1,330 | $1.38 | 14d | 1 | 0.76mi |
| 14405 E 37th St S Independence, MO | 3.0 | 1.0 | 1300 | $1,800 | $1.38 | 4d | 1 | 0.82mi |
| 16504 E 33rd St S Independence, MO | 4.0 | 2.0 | 1495 | $2,055 | $1.37 | 3d | 1 | 0.89mi |
| 2905 S Lee's Summit Rd Independence, MO | 1.0–3.0 | 1.0–2.0 | 853 | $1,746 | $2.05 | 3d | 48 | 1.10mi |
| 15404 E 48th St Kansas City, MO | 2.0 | 1.5 | 1325 | $1,350 | $1.02 | 25d | 1 | 1.11mi |
| 15312 E 48th St Kansas City, MO | 3.0 | 2.0 | 1160 | $1,700 | $1.47 | 14d | 1 | 1.13mi |
| 4020 S Crackerneck Rd Independence, MO | 3.0 | 3.0 | 1488 | $2,200 | $1.48 | 3d | 1 | 1.14mi |
| 16301 E 29 St S Independence, MO | 1.0–2.0 | 1.0 | 718 | $1,400 | $1.95 | 18d | 16 | 1.15mi |
| 3926 S Redwood Dr Independence, MO | 2.0 | 1.0 | 945 | $1,050 | $1.11 | 25d | 1 | 1.19mi |
| 16301 E 48th Ter Kansas City, MO | 1.0–2.0 | 1.0–2.0 | 945 | $1,270 | $1.34 | 23d | 7 | 1.23mi |
| 16421 E 29th Ter S Independence, MO | 3.0 | 2.0 | 1225 | $1,606 | $1.31 | 45d | 1 | 1.24mi |
| 16428 E 29th Street Ct S Unit B Independence, MO | 2.0 | 1.5 | 826 | $1,277 | $1.55 | 25d | 1 | 1.32mi |
| 4580 Bass Pro Dr Independence, MO | 1.0–2.0 | 1.0–2.0 | 1114 | $1,829 | $1.64 | 3d | 10 | 1.33mi |
| 3551 S Lynn St Unit 3551 Independence, MO | 2.0 | 1.0 | 850 | $899 | $1.06 | 45d | 1 | 1.37mi |
| 13511 E 41st Ter S Independence, MO | 3.0 | 2.0 | 925 | $1,530 | $1.65 | 25d | 1 | 1.40mi |
| 5006 Breckenridge Ave Kansas City, MO | 3.0 | 2.0 | 1220 | $1,695 | $1.39 | 23d | 1 | 1.40mi |
| 4232 S Liberty St Independence, MO | 3.0 | 1.0 | 1152 | $1,525 | $1.32 | 25d | 1 | 1.45mi |
Listing history 12 events
-
2026-06-05statusdays on market $235,000 Pending 22 DOM
-
2026-06-03days on market $235,000 Active Under Contract 21 DOM
-
2026-06-02days on market $235,000 Active Under Contract 20 DOM
-
2026-06-01days on market $235,000 Active Under Contract 19 DOM
-
2026-05-31days on market $235,000 Active Under Contract 18 DOM
-
2026-05-14$260,000 Active 818-char remark
-
2026-04-21historical $260,000 818-char remark
-
2020-01-17soldstatus Sold 497-char remark
Show marketing remark (497 chars)
Don’t pass up this beautiful home in a quiet cul-de-sac with maintenance free siding, newer roof, new interior paint and carpet. This home features two living spaces and a finished basement which could also be used as a non conforming bedroom. Washer and dryer hookups are located upstairs and downstairs and could be taken out on the upper level if desired. Enjoy watching your kiddos or fur babies have fun in the fenced in backyard. Close to restaurants and shopping for your convenience.
-
2020-01-17soldstatus
Show marketing remark (497 chars)
Don’t pass up this beautiful home in a quiet cul-de-sac with maintenance free siding, newer roof, new interior paint and carpet. This home features two living spaces and a finished basement which could also be used as a non conforming bedroom. Washer and dryer hookups are located upstairs and downstairs and could be taken out on the upper level if desired. Enjoy watching your kiddos or fur babies have fun in the fenced in backyard. Close to restaurants and shopping for your convenience.
-
2019-12-14status Pending 497-char remark
Show marketing remark (497 chars)
Don’t pass up this beautiful home in a quiet cul-de-sac with maintenance free siding, newer roof, new interior paint and carpet. This home features two living spaces and a finished basement which could also be used as a non conforming bedroom. Washer and dryer hookups are located upstairs and downstairs and could be taken out on the upper level if desired. Enjoy watching your kiddos or fur babies have fun in the fenced in backyard. Close to restaurants and shopping for your convenience.
-
2019-12-12$159,000 Active 497-char remark
Show marketing remark (497 chars)
Don’t pass up this beautiful home in a quiet cul-de-sac with maintenance free siding, newer roof, new interior paint and carpet. This home features two living spaces and a finished basement which could also be used as a non conforming bedroom. Washer and dryer hookups are located upstairs and downstairs and could be taken out on the upper level if desired. Enjoy watching your kiddos or fur babies have fun in the fenced in backyard. Close to restaurants and shopping for your convenience.
-
2019-09-20soldstatus
ⓘ Source: listings_history table (triggers on properties + properties_extension) + one-shot
backfill from property_details.listing_events for pre-trigger history.
Tax reassessment forecast MO · Resets to sale price
- Current annual tax
- $2,281 · $190/mo
- Projected year-2 tax
- $2,281 · $190/mo
- Expected delta
- $0/yr ($0/mo · 0.0%)
ⓘ Screening estimate from a state-policy table — verify with the county assessor before closing.
Climate risk First Street
- Flood 1/10 Low FEMA zone X (unshaded) · 0% chance over 30 yrs
- Wildfire 1/10 Low
- Heat 4/10 Moderate 7 d/yr ≥107°F today · 17 d/yr by 30 yrs out
- Wind 2/10 Low
- Air quality 3/10 Moderate 3 unhealthy d/yr today · 3 by 30 yrs out
Nearby sold comps map
Loading sold comps map…
Walkable amenities ~0.75 mi
Loading nearby amenities…
Taxation est. · year 1
- Rental income
- $19,552
- − Mortgage interest
- −$13,164
- − Property taxes
- −$2,281
- − Insurance
- −$1,175
- − Repairs & maintenance
- −$1,564
- − Management
- −$1,564
- − Depreciation
- −$6,836
- Taxable loss
- −$7,032
- Est. tax savings @ 24.0%
- +$1,688
- After-tax cash flow
- $-1,110/yr
For passive investors: Depreciation is non-cash, so a rental often shows a tax loss while cash-flowing — sheltering income. Rental losses are passive: they offset passive income freely, and up to $25,000/yr can offset ordinary (W-2) income if you actively participate and your MAGI is under $100k (phasing out to $0 by $150k); unused losses carry forward. On sale, claimed depreciation is recaptured at up to 25%, and gains may owe capital-gains tax (a 1031 exchange can defer both). Figures are a year-1 estimate at your 24.0% rate — not tax advice; consult a CPA.
Schools (NCES district)
- District
- Independence 30
- NCES district ID
- 2915480
- Math proficiency
- 26% ▼ -8.00%
- Reading proficiency
- 38% ▼ -5.00%
- Median HH income
- $41,843
- Composite
- 27.04/100
- National rank
- #7054
- State rank
- #252 of 324 in MO
Livability — Independence
- Score
- 82/100
- State rank
- #10
- US rank
- #1296
Category grades
Schools grade is shown separately in the Schools card above.
Census & demographics
- Census place
- Independence, MO
- County
- Jackson County · 687,798 people
- City population
- 117,675
- Metro
- Kansas City, MO-KS
- Population (ZIP)
- 35,960
- Household income
- $62,439
- Rent vs Own
- Severe rent burden
- 1404.0
Population outlook (Jackson County) Hauer SSP2
- Today (2025)
- 719,589 people
- By 2030
- 731,456 · +1.6%
- By 2040
- 746,689 · +3.8%
- By 2050
- 749,289 · +4.1%
- By 2075
- 736,227 · +2.3%
- By 2100
- 668,210 · -7.1%
Race, ethnicity, and origin ACS 2023
- Neighborhood character
- Predominantly White (71%)
- Race & ethnicity
- White 71% Black 13% Hispanic / Latino 10% Two or more races 8% Asian 1%
- Hispanic origin (detail)
- Mexican 7% Puerto Rican 2%
- Common ancestry
- Italian 9% Lithuanian 2% Slovak 2%
- Foreign-born
- 4% · Canada
- Languages at home
- 94% English-only · Spanish 4%
Political lean MEDSL · Jackson
- 2024 margin
- D (+19.3) · D 58.9% · R 39.5% · Other 1.6%
- 2008→2024 swing
- -6.1pp toward R · 2008: 25.4pp · 2024: 19.3pp
- All cycles
- 2024: D+19.3 2020: D+22.0 2016: D+16.6 2012: D+19.0 2008: D+25.4
Not yet ingested
- Civics
- —
Market trends
- HPI YoY
- ▼ -180.54%
- Current HPI
- 245.3636
- Rent YoY
- ▲ 5.09%
- Metro
- Kansas City, MO-KS
- State GDP YoY
- ▲ 1.84%
- F500 in state
- 20
Industry mix (Fortune 500 HQ in MO)
| Industry | F500 HQs | Revenue |
|---|---|---|
| Healthcare | 1 | $163B |
|
||
| Insurance | 1 | $21B |
|
||
| Industrial Technology | 1 | $17B |
|
||
| Retail | 1 | $16B |
|
||
| Industrial Distribution | 1 | $10B |
|
||
| Utilities | 1 | $9B |
|
||
Price history
+47.8% since first listed11 events — show timeline
- 2026-06-05 Pending — Heartland MLS as Distributed by MLS Grid
- 2026-05-29 Contingent — Heartland MLS as Distributed by MLS Grid
- 2026-05-23 Price Changed $235,000 Heartland MLS as Distributed by MLS Grid
- 2026-05-21 Price Changed $250,000 Heartland MLS as Distributed by MLS Grid
- 2026-05-14 Listed $260,000 Heartland MLS as Distributed by MLS Grid
- 2026-04-21 Coming Soon $260,000 Heartland MLS as Distributed by MLS Grid
- 2020-01-17 Sold (Public Records) — Public Records
- 2020-01-17 Sold (MLS) — Heartland MLS as Distributed by MLS Grid
- 2019-12-14 Pending — Heartland MLS as Distributed by MLS Grid
- 2019-12-12 Listed $159,000 Heartland MLS as Distributed by MLS Grid
- 2019-09-20 Sold (Public Records) — Public Records
Property tax history
+3.9%/yrLatest (2025): $2,281 · -9.8% YoY. Source: county tax records.
Cash-flow waterfall
monthlySold comps — $/sqft
last 12 mo · ≤1 miLoading sold comps…