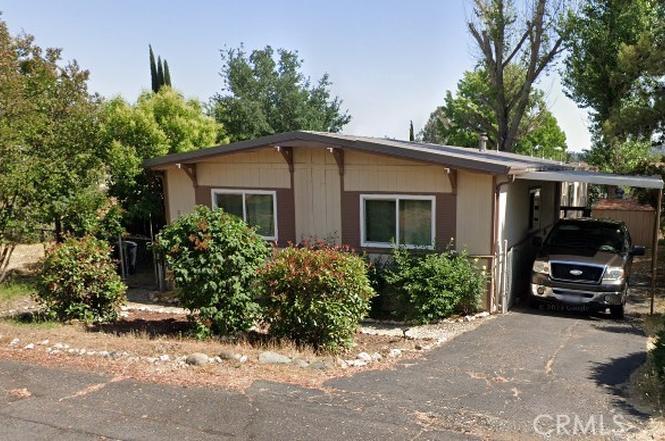
892 Morado · Copperopolis, CA
Flood risk 1/10 · Minimal
- FEMA flood zone
- X (shaded)
- Chance of flooding over 30 yrs
- 0.0%
- Est. flood insurance / yr
- $507 – $1,088
Fire risk 9/10 · Severe
- Est. fire insurance / yr
- $659 – $1,223
Heat risk 7/10 · Major
- Hot days now (above 103°F)
- 7 days/yr
- Hot days in 30 yrs
- 16 days/yr
Wind risk 1/10 · Minimal
- Chance of severe wind over 30 yrs
- —
Air-quality risk 10/10 · Severe
- Unhealthy air days now
- 30 days/yr
- Unhealthy air days in 30 yrs
- 35 days/yr
Risk factors via First Street. Map © Google.
Why this score? — see what drove the B+ grade
The composite is a weighted blend of 9 inputs, each scored 0–100. Each bar is that input's sub-score; the figure is the points it added to the 100-point composite (weight × sub-score).
- Cash flow +30.0/30.0
- ARV discount +15.0/15.0
- DSCR +10.0/10.0
- 1% rule +9.8/10.0
- Schools +4.5/10.0
- Livability +2.9/5.0
- Rent growth +2.5/5.0
- Condition / age +2.5/5.0
- Appreciation +0.0/10.0
$167,670
🖨 Deal sheet 📄 Offer letter ✓ Due diligence
Key facts
- 4,356 sq ft lot
- Built 1987
- Listed 246 days
Property features AI
Finance
- Other: Total units: 1; Lot size described as 0-1 Unit/Acre; Lot size source: Seller; Elevation units: Feet; Parcel number: 061031017000; Total stories: 1
- Financial info: Assessments: Unknown
- HOA & community: Community offers biking
Exterior
- Utilities: Water source: Other; Sewer: Unknown (Sewer or Septic - Unknown)
- Home design: Manufactured house; Single-story; No accessory dwelling unit
- Construction: Year built source: Seller; Living area source: Assessor's data; No common walls
- Exterior features: No pool
Interior
- Kitchen: Kitchen
- Bedrooms: 3 bedrooms on the main level
- Bathrooms: 2 full bathrooms on the main level
- Interior features: One-level home; Entry on main level
- Laundry & utility: No laundry hook-ups or room listed
Neighborhood map
What this means for you Summary
Snapshot
- This is a 3-bed/2.0-bath manufactured listed at $168k.
Deal economics
- At list price, monthly cash flow is $678 ($8k/yr) — positive.
- The deal already cash-flows at list — no discount required.
- Meets the 1% rule at list price ($2k rent vs $168k).
- Recommended offer: $148k (12.0% below list) — sets the bar for market timing.
- Cap rate 11.1% vs local median 2.0% in Copperopolis — top-decile yield for the area; either an underpriced asset or a hidden risk that comps aren't pricing in. Stress-test before assuming the spread holds.
Location & tenants
- Location reads 58/100 on livability (#691 in CA) — a working-class tenant base; expect higher turnover. Strengths: housing A+, employment A-, crime B+; Watch: schools D+, amenities F, commute F.
- Bret Harte Union High (town): math 35% / reading 65% proficiency, ranked #429 of 1,400 in CA (top 31%) — acceptable for families but not a draw, mixed tenant base, ~2y average lease.
- Market conditions: 235 active listings in the ZIP; 77 units permitted in Calaveras County in 2024 (0 in 5+ unit buildings).
Forward outlook
- Local home prices are declining (-3.0%/yr); year-one equity from $1k of loan paydown is wiped out by about $5k of value loss. Plan a longer hold.
- Calaveras County population projected at -18% by 2050 — secular population decline; favor cash flow + early exit over multi-decade hold.
- At projected returns (-3.0% appreciation + 3.0% rent growth), your $47k cash investment doubles in ~7 years — after that, you're playing with house money.
Negotiation context
- It's been on market 246 days — a 12% lower offer ($148k) is reasonable based on typical stale-listing flexibility.
Risks & watch-outs
- Climate carrying-cost: severe wildfire risk; extreme-heat days projected 7→16/yr by 2055 (HVAC capex compounding) — expect insurance premiums to compound above CPI over the hold.
Questions for the listing agent
- It's been on market 246 days. Have you received any prior offers? Is the seller open to a 12% concession, seller financing, or rate buy-down credit?
- Why hasn't it sold? Are there any deal-killer items the seller is aware of (foundation, flood, title, zoning, code violations)?
- Is there a deadline driving the sale (1031 exchange, divorce, estate, relocation)? That informs how much negotiation room exists.
- Schools are D-rated, which usually means shorter tenancies and higher turnover. Who's the typical renter profile here, and what's been the actual vacancy rate?
- What's the average days-on-market for RENTAL listings here right now (not sales)? A rising rental-DOM trend means longer vacancies and softer asking-rent achievability than the comps imply.
- What's the recent tenant-quality profile in this submarket — average credit score on applications, eviction rate, late-payment / NSF rate, and stable-employment percentage? A property-management company in the area should have these aggregated.
- How much new for-sale + rental construction is in the pipeline within 1–3 miles? Heavy new supply typically softens prices + rents 12–24 months out; constrained supply supports both.
Investment metrics
- 1% rule
- 1.48% ✓
- Cap rate
- 11.14%
- Cash-on-cash
- 17.32%
- DSCR
- 1.77
- GRM
- 5.6
CMA / ARV
- ARV (on-the-fly)
- $313,968
- Comps found
- 3
Show comp detail 3 sales within ~0.75 mi
| Address | Dist | Beds/Ba | Sqft | Sold | Price | $/sf | Match |
|---|---|---|---|---|---|---|---|
| 241 Copper Crest Dr | 0.32mi | 3/2.0 | 1,350 (-9%) | 4mo | $285,000 | $211 | 67 |
| 255 Deer Field Cir | 0.29mi | 4/2.0 (+1) | 1,370 (-8%) | 11mo | $330,000 | $241 | 59 |
| 962 Sequoia Cir | 0.18mi | 2/2.0 (-1) | 1,310 (-12%) | 19mo | $235,000 | $179 | 51 |
Match score weights: distance 35% · size 25% · config 20% · recency 20%. Top-matched comps best support the ARV.
Projected returns pro-forma
-3.0% appreciation · 3.0% rent growth · sell at horizon
- IRR
- 8.7%
- Equity multiple
- 1.34×
- Total profit
- $16,109
- Equity at exit
- $25,000
- IRR
- 18.0%
- Equity multiple
- 2.49×
- Total profit
- $70,064
- Equity at exit
- $14,497
Cash invested: $46,948 (down + closing). Projections, not guarantees.
Landlord ↔ Tenant lean methodology
- Overall (STATE)
- 18 Strongly Tenant-Friendly
- State California
- 18 Strongly Tenant-Friendly · D+13
- County
- — inherits STATE
- City
- — inherits STATE
ZIP-level market 95228
- Active inventory
- 235
- Price-to-rent
- 5.6×
Monthly cashflow live
- Estimated rent
- $2,476 medium interval (Pro) →
- Mortgage (P&I)
- −$879
- Tax from tax record
- −$329 /mo · $3,948/yr
- Insurance
- −$70
- HOA
- −$0
- Vacancy / Maint / Mgmt
- −$520
- Net cashflow
- $678
Break-even live
UW: 25.0% down · 7.5% · 30yr · 1.5% tax · 5.0% vac · 8.0% maint · 8.0% mgmt
Financing live
Cash to close
- Down payment
- $41,918
- Closing costs
- $5,030
- Reserves months
- —
- Total cash needed
- —
Loan-product check · same deal, 3 products live
Conventional
25% down · 7.5% · 30yr
- Down + closing
- —
- Monthly P&I
- —
- Monthly cashflow
- —
- DSCR
- —
- Eligible?
- —
Personal DTI + credit; lowest rate.
DSCR
20% down · 8.5% · 30yr
- Down + closing
- —
- Monthly P&I
- —
- Monthly cashflow
- —
- DSCR
- —
- Eligible?
- —
No personal income docs; deal must DSCR.
Hard money
10% down · 12.0% · 12mo
- Down + closing
- —
- Monthly P&I
- —
- Monthly cashflow
- —
- DSCR
- —
- Eligible?
- —
Short-term bridge; refi at stabilization.
Listing history 21 events
-
2026-06-18days on market $167,670 Active 246 DOM
-
2026-06-17days on market $167,670 Active 245 DOM
-
2026-06-16days on market $167,670 Active 244 DOM
-
2026-06-15days on market $167,670 Active 243 DOM
-
2026-06-14days on market $167,670 Active 241 DOM
-
2026-06-10days on market $167,670 Active 238 DOM
-
2026-06-09days on market $167,670 Active 237 DOM
-
2026-06-08days on market $167,670 Active 236 DOM
-
2026-06-07days on market $167,670 Active 235 DOM
-
2026-06-05days on market $167,670 Active 232 DOM
-
2026-06-03days on market $167,670 Active 231 DOM
-
2026-06-02days on market $167,670 Active 230 DOM
-
2026-06-01days on market $167,670 Active 229 DOM
-
2026-05-31days on market $167,670 Active 228 DOM
-
2026-05-30days on market $167,670 Active 227 DOM
-
2026-05-21price $167,670
-
2025-10-15$174,960 Active
-
2024-03-06soldstatus $275,000
-
2008-07-25soldstatus $150,000
-
2006-06-28soldstatus $68,000
-
2003-02-07soldstatus $50,000
ⓘ Source: listings_history table (triggers on properties + properties_extension) + one-shot
backfill from property_details.listing_events for pre-trigger history.
Tax reassessment forecast CA · Resets to sale price
- Current annual tax
- $3,948 · $329/mo
- Projected year-2 tax
- $3,948 · $329/mo
- Expected delta
- $0/yr ($0/mo · 0.0%)
ⓘ Screening estimate from a state-policy table — verify with the county assessor before closing.
Climate risk First Street
- Flood 1/10 Low FEMA zone X (shaded) · 0% chance over 30 yrs
- Wildfire 9/10 Extreme
- Heat 7/10 Severe 7 d/yr ≥103°F today · 16 d/yr by 30 yrs out
- Wind 1/10 Low
- Air quality 10/10 Extreme 30 unhealthy d/yr today · 35 by 30 yrs out
Nearby sold comps map
Loading sold comps map…
Walkable amenities ~0.75 mi
Loading nearby amenities…
Taxation est. · year 1
- Rental income
- $29,710
- − Mortgage interest
- −$9,392
- − Property taxes
- −$3,948
- − Insurance
- −$838
- − Repairs & maintenance
- −$2,377
- − Management
- −$2,377
- − Depreciation
- −$4,878
- Taxable income
- $5,900
- Est. tax owed @ 24.0%
- −$1,416
- After-tax cash flow
- $6,717/yr
For passive investors: Depreciation is non-cash, so a rental often shows a tax loss while cash-flowing — sheltering income. Rental losses are passive: they offset passive income freely, and up to $25,000/yr can offset ordinary (W-2) income if you actively participate and your MAGI is under $100k (phasing out to $0 by $150k); unused losses carry forward. On sale, claimed depreciation is recaptured at up to 25%, and gains may owe capital-gains tax (a 1031 exchange can defer both). Figures are a year-1 estimate at your 24.0% rate — not tax advice; consult a CPA.
Schools (NCES district)
- District
- Bret Harte Union High
- NCES district ID
- 0605940
- Math proficiency
- 35% ▲ 5.00%
- Reading proficiency
- 65% ▲ 5.00%
- Median HH income
- $56,974
- Composite
- 45.41/100
- National rank
- #5708
- State rank
- #429 of 1400 in CA
Livability — Copperopolis
- Score
- 58/100
- State rank
- #691
- US rank
- #21010
Category grades
Schools grade is shown separately in the Schools card above.
Census & demographics
- Census place
- Copperopolis, CA
- Population (ZIP)
- 4,880
Population outlook (Calaveras County) Hauer SSP2
- Today (2025)
- 43,163 people
- By 2030
- 41,703 · -3.4%
- By 2040
- 38,202 · -11.5%
- By 2050
- 35,385 · -18.0%
- By 2075
- 30,807 · -28.6%
- By 2100
- 25,755 · -40.3%
Race, ethnicity, and origin ACS 2023
- Neighborhood character
- Predominantly White (71%)
- Race & ethnicity
- White 71% Hispanic / Latino 25% Two or more races 15% Black 2%
- Hispanic origin (detail)
- Mexican 21%
- Common ancestry
- Iranian 4% Romanian 4% Russian 3%
- Foreign-born
- 3% · Canada
- Languages at home
- 91% English-only · Spanish 9% Tagalog/Filipino 1%
Political lean MEDSL · Calaveras
- 2024 margin
- Strong R (+28.1) · D 34.7% · R 62.8% · Other 2.5%
- 2008→2024 swing
- -15.2pp toward R · 2008: -13.0pp · 2024: -28.1pp
- All cycles
- 2024: R+28.1 2020: R+23.8 2016: R+23.9 2012: R+17.0 2008: R+13.0
Not yet ingested
- Civics
- —
Market trends
- HPI YoY
- ▼ -141.73%
- Current HPI
- 176.1251
- Rent YoY
- —
- Metro
- —
- State GDP YoY
- ▲ 3.21%
- F500 in state
- 116
Industry mix (Fortune 500 HQ in CA)
| Industry | F500 HQs | Revenue |
|---|---|---|
| Technology | 27 | $1,492B |
|
||
| Financial Services | 3 | $174B |
|
||
| Retail | 3 | $44B |
|
||
| Insurance | 3 | $26B |
|
||
| Media / Entertainment | 2 | $115B |
|
||
| Pharmaceuticals / Biotech | 2 | $62B |
|
||
Price history
+235.3% since first listed6 events — show timeline
- 2026-05-21 Price Changed $167,670 CRMLS
- 2025-10-15 Listed $174,960 CRMLS
- 2024-03-06 Sold (Public Records) $275,000 Public Records
- 2008-07-25 Sold (Public Records) $150,000 Public Records
- 2006-06-28 Sold (Public Records) $68,000 Public Records
- 2003-02-07 Sold (Public Records) $50,000 Public Records
Property tax history
+11.0%/yrLatest (2025): $3,948 · +80.4% YoY. Source: county tax records.
Cash-flow waterfall
monthlySold comps — $/sqft
last 12 mo · ≤1 miLoading sold comps…