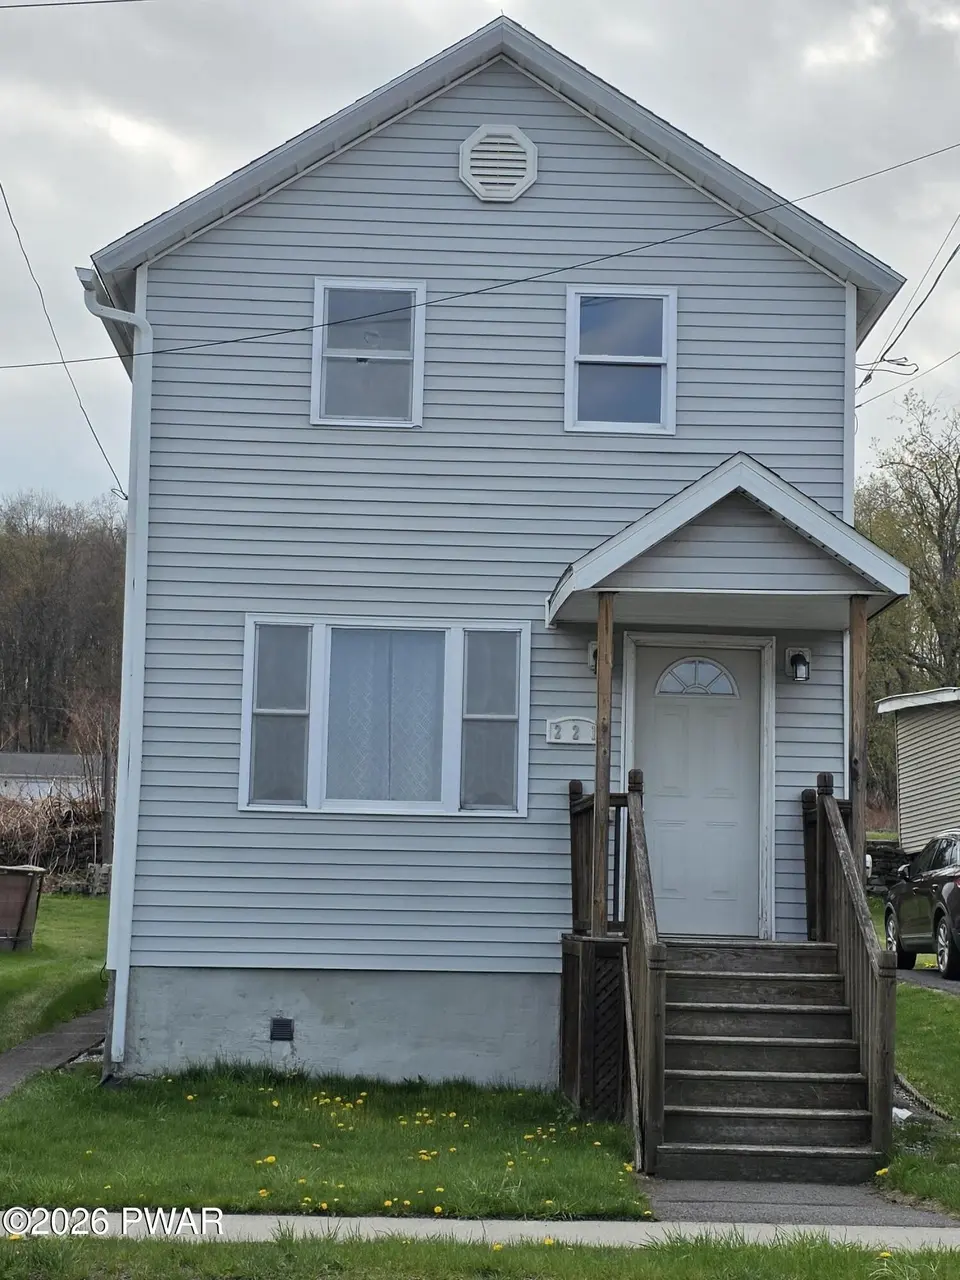
221 S Main St · Forest City, PA
Flood risk 1/10 · Minimal
- FEMA flood zone
- X (unshaded)
- Chance of flooding over 30 yrs
- 0.0%
- Est. flood insurance / yr
- $473 – $860
Fire risk 1/10 · Minimal
- Est. fire insurance / yr
- $511 – $949
Heat risk 2/10 · Minimal
- Hot days now (above 88°F)
- 8 days/yr
- Hot days in 30 yrs
- 18 days/yr
Wind risk 2/10 · Minimal
- Chance of severe wind over 30 yrs
- 3.0%
Air-quality risk 2/10 · Minimal
- Unhealthy air days now
- 1 days/yr
- Unhealthy air days in 30 yrs
- 1 days/yr
Risk factors via First Street. Map © Google.
Why this score? — see what drove the D grade
The composite is a weighted blend of 9 inputs, each scored 0–100. Each bar is that input's sub-score; the figure is the points it added to the 100-point composite (weight × sub-score).
- Cash flow +12.7/30.0
- Appreciation +10.0/10.0
- DSCR +3.8/10.0
- Schools +3.6/10.0
- 1% rule +3.3/10.0
- Livability +3.3/5.0
- Rent growth +2.5/5.0
- Condition / age +2.5/5.0
- ARV discount +0.8/15.0
$168,000
🖨 Deal sheet 📄 Offer letter ✓ Due diligence
Listing remarks MLS
IN TOWN CHARMER - OVER AN ACRE - GREAT STARTER - Check out this 3 bedroom, 1.5 bath home located Forest City! Well maintained and plenty of modern upgrades like vinyl siding and replacement windows as well as a new LP hot water baseboard heat and new electric water heater. Outside, enjoy the back patio and huge upper lot (possible subdivision of additional parcel). , Beds Description: 2+BED 2nd, Baths: 1 Bath Level 1, Baths: 1/2 Bath Lev 2
Key facts
- Updated electrical
- Newer furnace
- Expansive upper lot
Tags
Property features AI
Finance
- Other: Lot of about 1.06 acres
Exterior
- Parking: Off-street parking; Shared paved driveway
- Utilities: Public water; Sewer connected; 100 Amp electric service
- Home design: Single-family residence; Residential zoning
- Construction: Vinyl siding
- Exterior features: Shared paved driveway; Off-street parking
Interior
- Kitchen: Electric oven; Refrigerator
- Flooring: Carpet; Tile; Laminate
- Bathrooms: 1 full bathroom; 1 half bathroom
- Heating & cooling: Natural gas heating
- Interior features: Eat-in kitchen; Unfinished basement
Neighborhood map
What this means for you Summary
Snapshot
- This is a 3-bed/1.5-bath other listed at $168k.
Deal economics
- At list price, monthly cash flow is $-18 ($-212/yr) — negative.
- To cash-flow at today's rent, offer at most $165k (1.9% below list).
- To meet the 1% rule (rent ≥ 1% of price), the offer needs to be $140k (16.7% below list).
- Recommended offer: $140k (16.7% below list) — sets the bar for 1% rule.
Location & tenants
- Location reads 66/100 on livability (#1,019 in PA) — a middle-class / working-renter tenant base. Strengths: crime A+, cost of living A+, housing A+; Watch: amenities F, commute F, employment D-.
- Forest City Regional SD (suburban): math 34% / reading 51% proficiency, ranked #308 of 539 in PA (top 57%) — families likely to look elsewhere, expect single-tenant / working-renter base with shorter leases.
- Market conditions: 53 active listings in the ZIP; 1 comparable units currently listed for rent nearby; 80 units permitted in Susquehanna County in 2024 (5 in 5+ unit buildings).
Forward outlook
- In year one you build about $18k of equity ($1k loan paydown + $17k appreciation (10.0% local appreciation)).
- Susquehanna County population projected at -30% by 2050 — secular population decline; favor cash flow + early exit over multi-decade hold.
- At projected returns (10.0% appreciation + 3.0% rent growth), your $47k cash investment doubles in ~3 years — after that, you're playing with house money.
- By year 3, paydown + projected appreciation supports a ~$45k cash-out refi (75% LTV) — recoverable capital for the next deal without selling this one.
Negotiation context
- It's been on market 53 days — a 3% lower offer ($163k) is reasonable based on typical stale-listing flexibility.
- 4 sale attempts since 11y ago with the ask held roughly flat each time — persistent listings suggest the price (not the market) is what's stuck; bring a comps-based counter.
Risks & watch-outs
- Watch-outs: built in 1900 — expect roof / HVAC / electrical / plumbing capex.
Questions for the listing agent
- What do current leases actually rent for vs. the listed asking? Can we see a recent rent roll and the last 12 months of T-12 income?
- It's been on market 53 days. Have you received any prior offers? Is the seller open to a 17% concession, seller financing, or rate buy-down credit?
- Built in 1900 — when were the roof, HVAC, electrical panel, plumbing, and water heater last replaced?
- Is there a deadline driving the sale (1031 exchange, divorce, estate, relocation)? That informs how much negotiation room exists.
- The area grade is low — what's the realistic commute time and amenity access for the typical tenant pool here? Any planned neighborhood developments (good or bad) we should know about?
- What's the average days-on-market for RENTAL listings here right now (not sales)? A rising rental-DOM trend means longer vacancies and softer asking-rent achievability than the comps imply.
- What's the recent tenant-quality profile in this submarket — average credit score on applications, eviction rate, late-payment / NSF rate, and stable-employment percentage? A property-management company in the area should have these aggregated.
- How much new for-sale + rental construction is in the pipeline within 1–3 miles? Heavy new supply typically softens prices + rents 12–24 months out; constrained supply supports both.
Investment metrics
- 1% rule
- 0.83% ✗
- Cap rate
- 6.17%
- Cash-on-cash
- -0.45%
- DSCR
- 0.98
- GRM
- 10.0
CMA / ARV
- ARV (median comp)
- $146,269
- List price
- $168,000
- Delta
- 14.86%
- Verdict
- OVERPRICED
- Comps
- 20 within 1.0 mi
Projected returns pro-forma
10.0% appreciation · 3.0% rent growth · sell at horizon
- IRR
- 24.0%
- Equity multiple
- 2.92×
- Total profit
- $90,370
- Equity at exit
- $151,348
- IRR
- 21.3%
- Equity multiple
- 6.68×
- Total profit
- $267,007
- Equity at exit
- $326,387
Cash invested: $47,040 (down + closing). Projections, not guarantees.
Landlord ↔ Tenant lean methodology
- Overall (STATE)
- 62 Landlord-Friendly
- State Pennsylvania
- 62 Landlord-Friendly · EVEN
- County
- — inherits STATE
- City
- — inherits STATE
ZIP-level market 18421
- Home prices YoY
- 20.9%
- Active inventory
- 53
- Price-to-rent
- 10.0×
Monthly cashflow live
- Estimated rent
- $1,400 medium interval (Pro) →
- Mortgage (P&I)
- −$881
- Tax from tax record
- −$173 /mo · $2,072/yr
- Insurance
- −$70
- HOA
- −$0
- Vacancy / Maint / Mgmt
- −$294
- Net cashflow
- $-18
Break-even live
UW: 25.0% down · 7.5% · 30yr · 1.5% tax · 5.0% vac · 8.0% maint · 8.0% mgmt
Financing live
Cash to close
- Down payment
- $42,000
- Closing costs
- $5,040
- Reserves months
- —
- Total cash needed
- —
Loan-product check · same deal, 3 products live
Conventional
25% down · 7.5% · 30yr
- Down + closing
- —
- Monthly P&I
- —
- Monthly cashflow
- —
- DSCR
- —
- Eligible?
- —
Personal DTI + credit; lowest rate.
DSCR
20% down · 8.5% · 30yr
- Down + closing
- —
- Monthly P&I
- —
- Monthly cashflow
- —
- DSCR
- —
- Eligible?
- —
No personal income docs; deal must DSCR.
Hard money
10% down · 12.0% · 12mo
- Down + closing
- —
- Monthly P&I
- —
- Monthly cashflow
- —
- DSCR
- —
- Eligible?
- —
Short-term bridge; refi at stabilization.
Rent comps 1 comps
| Address | Beds | Baths | Sqft | Rent | $/sqft | DOM | Units | Dist |
|---|---|---|---|---|---|---|---|---|
| 139 Dundaff St Unit 1 Forest City, PA | 2.0 | 2.0 | 1218 | $1,400 | $1.15 | 13d | 1 | 0.53mi |
Listing history 24 events
-
2026-06-18days on market $168,000 Active 53 DOM
-
2026-06-17days on market $168,000 Active 52 DOM
-
2026-06-16days on market $168,000 Active 51 DOM
-
2026-06-15days on market $168,000 Active 50 DOM
-
2026-06-14days on market $168,000 Active 48 DOM
-
2026-06-13days on market $168,000 Active 47 DOM
-
2026-06-10days on market $168,000 Active 45 DOM
-
2026-06-09days on market $168,000 Active 44 DOM
-
2026-06-08days on market $168,000 Active 43 DOM
-
2026-06-07days on market $168,000 Active 42 DOM
-
2026-06-03days on market $168,000 Active 38 DOM
-
2026-06-02days on market $168,000 Active 37 DOM
-
2026-06-01days on market $168,000 Active 36 DOM
-
2026-05-31days on market $168,000 Active 35 DOM
-
2026-05-30pricedays on market $168,000 Active 34 DOM
-
2026-04-27$175,000 Active 865-char remark
-
2022-08-25soldstatus $148,654
-
2022-08-24soldstatus $145,900
Show marketing remark (443 chars)
IN TOWN CHARMER - OVER AN ACRE - GREAT STARTER - Check out this 3 bedroom, 1.5 bath home located Forest City! Well maintained and plenty of modern upgrades like vinyl siding and replacement windows as well as a new LP hot water baseboard heat and new electric water heater. Outside, enjoy the back patio and huge upper lot (possible subdivision of additional parcel). , Beds Description: 2+BED 2nd, Baths: 1 Bath Level 1, Baths: 1/2 Bath Lev 2
-
2022-08-24soldstatus
Show marketing remark (443 chars)
IN TOWN CHARMER - OVER AN ACRE - GREAT STARTER - Check out this 3 bedroom, 1.5 bath home located Forest City! Well maintained and plenty of modern upgrades like vinyl siding and replacement windows as well as a new LP hot water baseboard heat and new electric water heater. Outside, enjoy the back patio and huge upper lot (possible subdivision of additional parcel). , Beds Description: 2+BED 2nd, Baths: 1 Bath Level 1, Baths: 1/2 Bath Lev 2
-
2022-04-18$139,900
Show marketing remark (443 chars)
IN TOWN CHARMER - OVER AN ACRE - GREAT STARTER - Check out this 3 bedroom, 1.5 bath home located Forest City! Well maintained and plenty of modern upgrades like vinyl siding and replacement windows as well as a new LP hot water baseboard heat and new electric water heater. Outside, enjoy the back patio and huge upper lot (possible subdivision of additional parcel). , Beds Description: 2+BED 2nd, Baths: 1 Bath Level 1, Baths: 1/2 Bath Lev 2
-
2018-01-16soldstatus $84,460
-
2018-01-11soldstatus $84,460
-
2015-07-24$69,500
ⓘ Source: listings_history table (triggers on properties + properties_extension) + one-shot
backfill from property_details.listing_events for pre-trigger history.
Tax reassessment forecast PA · Partial reset (capped growth)
- Current annual tax
- $2,072 · $173/mo
- Projected year-2 tax
- $2,363 · $197/mo
- Expected delta
- +$291/yr (+$24/mo · 14.1%)
ⓘ Screening estimate from a state-policy table — verify with the county assessor before closing.
Climate risk First Street
- Flood 1/10 Low FEMA zone X (unshaded) · 0% chance over 30 yrs
- Wildfire 1/10 Low
- Heat 2/10 Low 8 d/yr ≥88°F today · 18 d/yr by 30 yrs out
- Wind 2/10 Low 3% chance of damaging wind over 30 yrs
- Air quality 2/10 Low 1 unhealthy d/yr today · 1 by 30 yrs out
Nearby sold comps map
Loading sold comps map…
Walkable amenities ~0.75 mi
Loading nearby amenities…
Taxation est. · year 1
- Rental income
- $16,800
- − Mortgage interest
- −$9,411
- − Property taxes
- −$2,072
- − Insurance
- −$840
- − Repairs & maintenance
- −$1,344
- − Management
- −$1,344
- − Depreciation
- −$4,887
- Taxable loss
- −$3,098
- Est. tax savings @ 24.0%
- +$743
- After-tax cash flow
- $531/yr
For passive investors: Depreciation is non-cash, so a rental often shows a tax loss while cash-flowing — sheltering income. Rental losses are passive: they offset passive income freely, and up to $25,000/yr can offset ordinary (W-2) income if you actively participate and your MAGI is under $100k (phasing out to $0 by $150k); unused losses carry forward. On sale, claimed depreciation is recaptured at up to 25%, and gains may owe capital-gains tax (a 1031 exchange can defer both). Figures are a year-1 estimate at your 24.0% rate — not tax advice; consult a CPA.
Schools (NCES district)
- District
- Forest City Regional SD
- NCES district ID
- 4209930
- Math proficiency
- 34% ▼ -17.00%
- Reading proficiency
- 51% ▼ -11.00%
- Median HH income
- $47,744
- Composite
- 36.29/100
- National rank
- #4701
- State rank
- #308 of 539 in PA
Livability — Forest City
- Score
- 66/100
- State rank
- #1019
- US rank
- #11278
Category grades
Schools grade is shown separately in the Schools card above.
Census & demographics
- Census place
- Forest City, PA
- Population (ZIP)
- 4,475
Population outlook (Susquehanna County) Hauer SSP2
- Today (2025)
- 37,552 people
- By 2030
- 35,270 · -6.1%
- By 2040
- 30,663 · -18.3%
- By 2050
- 26,492 · -29.5%
- By 2075
- 19,658 · -47.7%
- By 2100
- 15,179 · -59.6%
Race, ethnicity, and origin ACS 2023
- Neighborhood character
- Predominantly White (93%)
- Race & ethnicity
- White 93% Hispanic / Latino 4% Two or more races 3%
- Common ancestry
- Romanian 11% Italian 3% Scotch-Irish 2%
- Foreign-born
- 3% · Canada, Vietnam
- Languages at home
- 97% English-only · Spanish 1% Vietnamese 1% Russian/Polish/Slavic 1%
Political lean MEDSL · Susquehanna
- 2024 margin
- Solid R (+44.7) · D 27.2% · R 71.9%
- 2008→2024 swing
- -33.0pp toward R · 2008: -11.7pp · 2024: -44.7pp
- All cycles
- 2024: R+44.7 2020: R+41.2 2016: R+42.9 2012: R+21.4 2008: R+11.7
Not yet ingested
- Civics
- —
Market trends
- HPI YoY
- ▲ 48.80%
- Current HPI
- 282.5624
- Rent YoY
- —
- Metro
- —
- State GDP YoY
- ▲ 1.68%
- F500 in state
- 34
Industry mix (Fortune 500 HQ in PA)
| Industry | F500 HQs | Revenue |
|---|---|---|
| Healthcare | 2 | $309B |
|
||
| Insurance | 2 | $27B |
|
||
| Telecommunications / Media | 1 | $124B |
|
||
| Industrial Distribution | 1 | $22B |
|
||
| Financial Services | 1 | $20B |
|
||
| Chemicals / Materials | 1 | $18B |
|
||
Price history
+141.7% since first listed10 events — show timeline
- 2026-05-29 Price Changed $168,000 PWMLS
- 2026-04-27 Listed $175,000 PWMLS
- 2022-08-25 Sold (Public Records) $148,654 Public Records
- 2022-08-24 Sold (MLS) — PWMLS
- 2022-08-24 Sold (MLS) $145,900 PWMLS
- 2022-04-18 Listed $139,900 PWMLS
- 2022-04-18 Listed $139,900 PWMLS
- 2018-01-16 Sold (Public Records) $84,460 Public Records
- 2018-01-11 Sold (MLS) $84,460 GSBR as distributed by MLS GRID
- 2015-07-24 Listed $69,500 GSBR as distributed by MLS GRID
Property tax history
+4.3%/yrLatest (2026): $2,072 · +4.0% YoY. Source: county tax records.
Cash-flow waterfall
monthlySold comps — $/sqft
last 12 mo · ≤1 miLoading sold comps…