 🏷️ Likely Rental
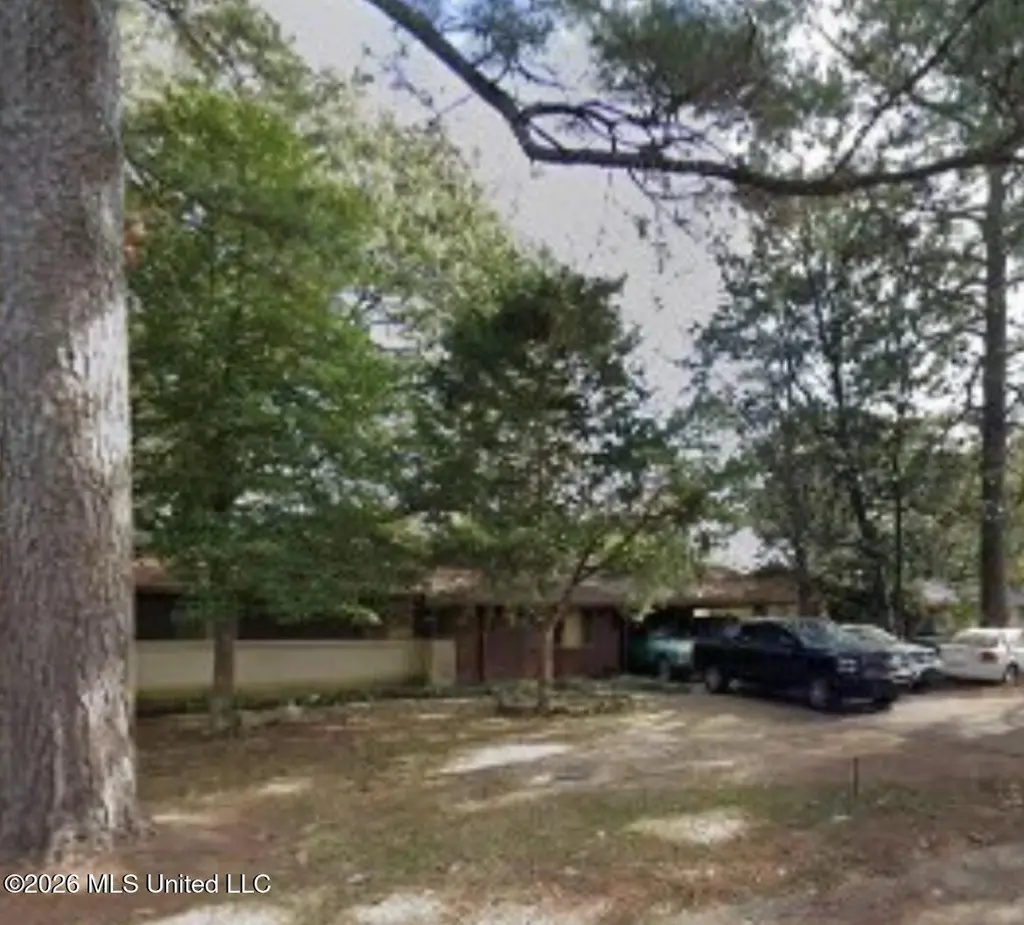
1942 Marshall Pl · Jackson, MS
Flood risk 1/10 · Minimal
- FEMA flood zone
- X (unshaded)
- Chance of flooding over 30 yrs
- 0.0%
- Est. flood insurance / yr
- $507 – $1,088
Fire risk 2/10 · Minimal
- Est. fire insurance / yr
- $1,241 – $2,305
Heat risk 7/10 · Major
- Hot days now (above 109°F)
- 7 days/yr
- Hot days in 30 yrs
- 20 days/yr
Wind risk 8/10 · Major
- Chance of severe wind over 30 yrs
- 80.0%
Air-quality risk 2/10 · Minimal
- Unhealthy air days now
- 0 days/yr
- Unhealthy air days in 30 yrs
- 1 days/yr
Risk factors via First Street. Map © Google.
Why this score? — see what drove the B+ grade
The composite is a weighted blend of 9 inputs, each scored 0–100. Each bar is that input's sub-score; the figure is the points it added to the 100-point composite (weight × sub-score).
- Cash flow +30.0/30.0
- 1% rule +10.0/10.0
- DSCR +10.0/10.0
- Appreciation +10.0/10.0
- ARV discount +7.5/15.0
- Livability +3.4/5.0
- Rent growth +2.5/5.0
- Condition / age +2.5/5.0
- Schools +1.1/10.0
$49,000
🖨 Deal sheet 📄 Offer letter ✓ Due diligence
Listing remarks MLS
SELLER FINANCING ($25,000 down and $350 monthly payments) Turnkey Investment Opportunity Add a performing asset to your portfolio with this income-producing property featuring a long-term tenant of 7 years currently paying $850 per month. Consistent rental history provides immediate cash flow from day one. Whether you're expanding your rental portfolio or entering the investment space, this property offers stability and proven performance. ''AS IS'', ''WHERE IS'' Contact your Realtor for additional details, financials, and showing information.
Key facts
- 0.23 acre lot
- 2 parking spots
- Built 1962
Neighborhood map
What this means for you Summary
Snapshot
- This is a 3-bed/2.0-bath single-family listed at $49k.
Deal economics
- At list price, monthly cash flow is $540 ($6k/yr) — positive.
- The deal already cash-flows at list — no discount required.
- Meets the 1% rule at list price ($1k rent vs $49k).
- Recommended offer: $45k (9.0% below list) — sets the bar for market timing.
- Cap rate 19.5% vs local median 9.9% in Jackson — top-decile yield for the area; either an underpriced asset or a hidden risk that comps aren't pricing in. Stress-test before assuming the spread holds.
Location & tenants
- Location reads 68/100 on livability (#66 in MS) — a middle-class / working-renter tenant base. Strengths: commute A+, cost of living A+, housing A+; Watch: schools F, amenities F, employment F.
- Jackson Public School District (urban): math 9% / reading 18% proficiency, ranked #112 of 130 in MS (top 86%) — low school quality limits family demand, transient renter base, plan for 1-2y turnover; 88% free/reduced lunch — lower-income household profile, screen leases tightly.
- Market conditions: 81 active listings in the ZIP; 5 comparable units currently listed for rent nearby; rentals at typical pace (median 14d on market — plan ~3-4 weeks tenant-placement turnaround); lower-income renter base — watch delinquency; 167 units permitted in Hinds County in 2024 (0 in 5+ unit buildings).
- At $1,145/mo this rent would consume 47% of the median local household income ($30k/yr) (locally 1138% of renters already pay >50% of income on rent) — very limited rent-growth headroom before tenants either downsize or default.
Forward outlook
- In year one you build about $5k of equity ($339 loan paydown + $5k appreciation (10.0% local appreciation)).
- Hinds County population projected to shrink 6% by 2050 — rents likely to lag national; underwrite the cash flow, not the appreciation.
- At projected returns (10.0% appreciation + 3.0% rent growth), your $14k cash investment doubles in ~2 years — after that, you're playing with house money.
- By year 6, paydown + projected appreciation supports a ~$31k cash-out refi (75% LTV) — recoverable capital for the next deal without selling this one.
Negotiation context
- It's been on market 104 days — a 9% lower offer ($45k) is reasonable based on typical stale-listing flexibility.
- 2 sale attempts since 8y ago; this cycle's ask has dropped $13k (21%) from the opening price — seller is motivated, your offer sets the floor, not the list.
Risks & watch-outs
- Climate carrying-cost: severe wind risk, 80% chance of damaging wind over 30y; extreme-heat days projected 7→20/yr by 2055 (HVAC capex compounding) — expect insurance premiums to compound above CPI over the hold.
Questions for the listing agent
- It's been on market 104 days. Have you received any prior offers? Is the seller open to a 9% concession, seller financing, or rate buy-down credit?
- Built in 1962 — when were the roof, HVAC, electrical panel, plumbing, and water heater last replaced?
- Why hasn't it sold? Are there any deal-killer items the seller is aware of (foundation, flood, title, zoning, code violations)?
- Is there a deadline driving the sale (1031 exchange, divorce, estate, relocation)? That informs how much negotiation room exists.
- Schools are F-rated, which usually means shorter tenancies and higher turnover. Who's the typical renter profile here, and what's been the actual vacancy rate?
- What's the average days-on-market for RENTAL listings here right now (not sales)? A rising rental-DOM trend means longer vacancies and softer asking-rent achievability than the comps imply.
- What's the recent tenant-quality profile in this submarket — average credit score on applications, eviction rate, late-payment / NSF rate, and stable-employment percentage? A property-management company in the area should have these aggregated.
- How much new for-sale + rental construction is in the pipeline within 1–3 miles? Heavy new supply typically softens prices + rents 12–24 months out; constrained supply supports both.
Investment metrics
- 1% rule
- 2.34% ✓
- Cap rate
- 19.51%
- Cash-on-cash
- 47.19%
- DSCR
- 3.10
- GRM
- 3.6
CMA / ARV
- ARV (median comp)
- $111,439
- List price
- $49,000
- Delta
- -56.03%
- Verdict
- UNDERPRICED
- Comps
- 8 within 1.0 mi
Show comp detail 3 sales within ~0.75 mi
| Address | Dist | Beds/Ba | Sqft | Sold | Price | $/sf | Match |
|---|---|---|---|---|---|---|---|
| 1942 Marshall Pl | 0.00mi | 3/2.0 | 1,055 (0%) | 0mo | $49,000 | $46 | 100 |
| 3537 Rita Dr | 0.38mi | 3/1.5 | 1,118 (+6%) | 11mo | $98,900 | $88 | 61 |
| 3482 Carley Dr | 0.40mi | 3/1.5 | 1,076 (+2%) | 22mo | $115,000 | $107 | 58 |
Match score weights: distance 35% · size 25% · config 20% · recency 20%. Top-matched comps best support the ARV.
Projected returns pro-forma
10.0% appreciation · 3.0% rent growth · sell at horizon
- IRR
- 61.2%
- Equity multiple
- 5.45×
- Total profit
- $61,087
- Equity at exit
- $44,143
- IRR
- 54.8%
- Equity multiple
- 12.15×
- Total profit
- $152,932
- Equity at exit
- $95,196
Cash invested: $13,720 (down + closing). Projections, not guarantees.
Landlord ↔ Tenant lean methodology
- Overall (STATE)
- 90 Strongly Landlord-Friendly
- State Mississippi
- 90 Strongly Landlord-Friendly · R+11
- County
- — inherits STATE
- City
- — inherits STATE
ZIP-level market 39213
- Home prices YoY
- 7.0%
- Active inventory
- 81
- Price-to-rent
- 3.6×
Monthly cashflow live
- Estimated rent
- $1,145 high interval (Pro) →
- Mortgage (P&I)
- −$257
- Tax from tax record
- −$88 /mo · $1,055/yr
- Insurance
- −$20
- HOA
- −$0
- Vacancy / Maint / Mgmt
- −$241
- Net cashflow
- $540
Break-even live
UW: 25.0% down · 7.5% · 30yr · 1.5% tax · 5.0% vac · 8.0% maint · 8.0% mgmt
Financing live
Cash to close
- Down payment
- $12,250
- Closing costs
- $1,470
- Reserves months
- —
- Total cash needed
- —
Loan-product check · same deal, 3 products live
Conventional
25% down · 7.5% · 30yr
- Down + closing
- —
- Monthly P&I
- —
- Monthly cashflow
- —
- DSCR
- —
- Eligible?
- —
Personal DTI + credit; lowest rate.
DSCR
20% down · 8.5% · 30yr
- Down + closing
- —
- Monthly P&I
- —
- Monthly cashflow
- —
- DSCR
- —
- Eligible?
- —
No personal income docs; deal must DSCR.
Hard money
10% down · 12.0% · 12mo
- Down + closing
- —
- Monthly P&I
- —
- Monthly cashflow
- —
- DSCR
- —
- Eligible?
- —
Short-term bridge; refi at stabilization.
Rent comps 5 comps
| Address | Beds | Baths | Sqft | Rent | $/sqft | DOM | Units | Dist |
|---|---|---|---|---|---|---|---|---|
| 3625 Liberty St Jackson, MS | 3.0 | 1.0 | 1056 | $1,190 | $1.13 | 14d | 1 | 1.40mi |
| 6731 George Washington Dr Jackson, MS | 3.0 | 2.0 | 1134 | $1,300 | $1.15 | 23d | 1 | 1.43mi |
| 6731 George Washington Dr Jackson, MS | 3.0 | 2.0 | 1134 | $1,200 | $1.06 | 14d | 1 | 1.43mi |
| 6513 Abraham Lincoln Dr Jackson, MS | 3.0 | 1.5 | 1330 | $950 | $0.71 | 14d | 1 | 1.44mi |
| 2475 Greenfield Ave Jackson, MS | 2.0 | 1.5 | 1000 | $800 | $0.80 | 44d | 1 | 1.47mi |
Listing history 18 events
-
2026-06-13statusdays on market $49,000 Pending 104 DOM
-
2026-06-10pricedays on market $49,000 Active 103 DOM
-
2026-06-09days on market $59,000 Active 102 DOM
-
2026-06-08days on market $59,000 Active 101 DOM
-
2026-06-07days on market $59,000 Active 100 DOM
-
2026-06-05days on market $59,000 Active 97 DOM
-
2026-06-03days on market $59,000 Active 96 DOM
-
2026-06-02days on market $59,000 Active 95 DOM
-
2026-06-01days on market $59,000 Active 94 DOM
-
2026-05-31days on market $59,000 Active 93 DOM
-
2026-05-30days on market $59,000 Active 92 DOM
-
2026-03-29price $59,000 557-char remark
Show marketing remark (557 chars)
SELLER FINANCING ($25,000 down and $350 monthly payments) Turnkey Investment Opportunity Add a performing asset to your portfolio with this income-producing property featuring a long-term tenant of 7 years currently paying $850 per month. Consistent rental history provides immediate cash flow from day one. Whether you're expanding your rental portfolio or entering the investment space, this property offers stability and proven performance. ''AS IS'', ''WHERE IS'' Contact your Realtor for additional details, financials, and showing information.
-
2026-02-27$62,000 Active 557-char remark
Show marketing remark (557 chars)
SELLER FINANCING ($25,000 down and $350 monthly payments) Turnkey Investment Opportunity Add a performing asset to your portfolio with this income-producing property featuring a long-term tenant of 7 years currently paying $850 per month. Consistent rental history provides immediate cash flow from day one. Whether you're expanding your rental portfolio or entering the investment space, this property offers stability and proven performance. ''AS IS'', ''WHERE IS'' Contact your Realtor for additional details, financials, and showing information.
-
2019-04-15soldstatus
-
2018-04-04soldstatus
-
2018-03-08soldstatus 139-char remark
Show marketing remark (139 chars)
3 bedroom-2 bath starter home with lots of storage. Close to major highways and shopping. Home being sold AS-IS. Great house for investors!
-
2018-01-18$30,000 139-char remark
Show marketing remark (139 chars)
3 bedroom-2 bath starter home with lots of storage. Close to major highways and shopping. Home being sold AS-IS. Great house for investors!
-
1962-05-29soldstatus
ⓘ Source: listings_history table (triggers on properties + properties_extension) + one-shot
backfill from property_details.listing_events for pre-trigger history.
Tax reassessment forecast MS · Resets to sale price
- Current annual tax
- $1,055 · $88/mo
- Projected year-2 tax
- $1,055 · $88/mo
- Expected delta
- $0/yr ($0/mo · 0.0%)
ⓘ Screening estimate from a state-policy table — verify with the county assessor before closing.
Climate risk First Street
- Flood 1/10 Low FEMA zone X (unshaded) · 0% chance over 30 yrs
- Wildfire 2/10 Low
- Heat 7/10 Severe 7 d/yr ≥109°F today · 20 d/yr by 30 yrs out
- Wind 8/10 Severe 80% chance of damaging wind over 30 yrs
- Air quality 2/10 Low 0 unhealthy d/yr today · 1 by 30 yrs out
Nearby sold comps map
Loading sold comps map…
Walkable amenities ~0.75 mi
Loading nearby amenities…
Taxation est. · year 1
- Rental income
- $13,744
- − Mortgage interest
- −$2,745
- − Property taxes
- −$1,055
- − Insurance
- −$245
- − Repairs & maintenance
- −$1,100
- − Management
- −$1,100
- − Depreciation
- −$1,425
- Taxable income
- $6,076
- Est. tax owed @ 24.0%
- −$1,458
- After-tax cash flow
- $5,017/yr
For passive investors: Depreciation is non-cash, so a rental often shows a tax loss while cash-flowing — sheltering income. Rental losses are passive: they offset passive income freely, and up to $25,000/yr can offset ordinary (W-2) income if you actively participate and your MAGI is under $100k (phasing out to $0 by $150k); unused losses carry forward. On sale, claimed depreciation is recaptured at up to 25%, and gains may owe capital-gains tax (a 1031 exchange can defer both). Figures are a year-1 estimate at your 24.0% rate — not tax advice; consult a CPA.
Schools (NCES district)
- District
- Jackson Public School District
- NCES district ID
- 2802190
- Math proficiency
- 9% ▼ -14.00%
- Reading proficiency
- 18% ▼ -7.00%
- Median HH income
- $33,234
- Composite
- 10.89/100
- National rank
- #9755
- State rank
- #112 of 130 in MS
Livability — Jackson
- Score
- 68/100
- State rank
- #66
- US rank
- #9695
Category grades
Schools grade is shown separately in the Schools card above.
Census & demographics
- Census place
- Jackson, MS
- County
- Hinds County · 167,040 people
- City population
- 140,204
- Metro
- Jackson, MS
- Population (ZIP)
- 18,691
- Household income
- $29,541
- Rent vs Own
- Severe rent burden
- 1138.0
Population outlook (Hinds County) Hauer SSP2
- Today (2025)
- 242,528 people
- By 2030
- 241,113 · -0.6%
- By 2040
- 235,557 · -2.9%
- By 2050
- 226,946 · -6.4%
- By 2075
- 199,995 · -17.5%
- By 2100
- 164,165 · -32.3%
Race, ethnicity, and origin ACS 2023
- Neighborhood character
- Predominantly Black (95%)
- Race & ethnicity
- Black 95% White 2% Two or more races 1% Hispanic / Latino 1%
- Foreign-born
- 0% · Canada
- Languages at home
- 98% English-only · Spanish 2%
Political lean MEDSL · Hinds
- 2024 margin
- Solid D (+46.1) · D 72.4% · R 26.3% · Other 1.4%
- 2008→2024 swing
- +7.1pp toward D · 2008: 39.0pp · 2024: 46.1pp
- All cycles
- 2024: D+46.1 2020: D+48.3 2016: D+43.7 2012: D+45.1 2008: D+39.0
Not yet ingested
- Civics
- —
Market trends
- HPI YoY
- ▲ 21.42%
- Current HPI
- 329.1844
- Rent YoY
- —
- Metro
- Jackson, MS
- State GDP YoY
- —
- F500 in state
- 0
Price history
+96.7% since first listed7 events — show timeline
- 2026-03-29 Price Changed $59,000 MLSU
- 2026-02-27 Listed $62,000 MLSU
- 2019-04-15 Sold (Public Records) — Public Records
- 2018-04-04 Sold (Public Records) — Public Records
- 2018-03-08 Sold (MLS) — MLSU
- 2018-01-18 Listed $30,000 MLSU
- 1962-05-29 Sold (Public Records) — Public Records
Property tax history
+0.6%/yrLatest (2025): $1,055 · +2.0% YoY. Source: county tax records.
Cash-flow waterfall
monthlySold comps — $/sqft
last 12 mo · ≤1 miLoading sold comps…