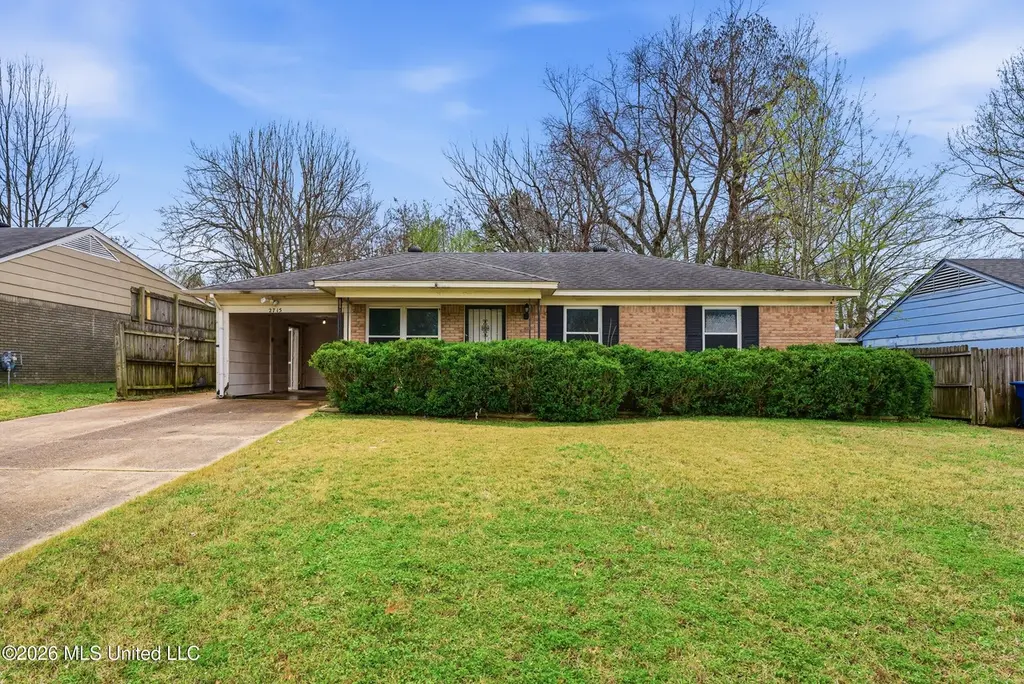
2715 Meadowbrook Dr · Horn Lake, MS
Flood risk 1/10 · Minimal
- FEMA flood zone
- X (unshaded)
- Chance of flooding over 30 yrs
- 0.0%
- Est. flood insurance / yr
- $507 – $1,088
Fire risk 4/10 · Minor
- Est. fire insurance / yr
- $1,241 – $2,305
Heat risk 6/10 · Moderate
- Hot days now (above 109°F)
- 7 days/yr
- Hot days in 30 yrs
- 21 days/yr
Wind risk 4/10 · Minor
- Chance of severe wind over 30 yrs
- 19.0%
Air-quality risk 2/10 · Minimal
- Unhealthy air days now
- 2 days/yr
- Unhealthy air days in 30 yrs
- 2 days/yr
Risk factors via First Street. Map © Google.
Why this score? — see what drove the B- grade
The composite is a weighted blend of 9 inputs, each scored 0–100. Each bar is that input's sub-score; the figure is the points it added to the 100-point composite (weight × sub-score).
- Cash flow +26.0/30.0
- ARV discount +15.0/15.0
- DSCR +8.7/10.0
- 1% rule +6.5/10.0
- Schools +4.0/10.0
- Livability +3.1/5.0
- Condition / age +2.5/5.0
- Rent growth +2.3/5.0
- Appreciation +0.0/10.0
$124,900
🖨 Deal sheet 📄 Offer letter ✓ Due diligence
Listing remarks MLS
One-story home featuring 3 bedrooms and 1 bathroom with an attached 1-car carport and a welcoming front porch. The property offers a functional layout and a fenced backyard with plenty of space for outdoor living, pets, or future improvements. This home is in need of updates and repairs, making it a great opportunity for investors or buyers looking to renovate and add value. Sold as-is.
Key facts
- Attached carport
- Front porch
- Functional layout
Tags
Neighborhood map
What this means for you Summary
Snapshot
- This is a 3-bed/1.0-bath single-family listed at $125k.
Deal economics
- At list price, monthly cash flow is $310 ($4k/yr) — positive.
- The deal already cash-flows at list — no discount required.
- Meets the 1% rule at list price ($1k rent vs $125k).
- Recommended offer: $117k (6.0% below list) — sets the bar for market timing.
- Cap rate 9.3% vs local median 6.0% in Horn Lake — top-decile yield for the area; either an underpriced asset or a hidden risk that comps aren't pricing in. Stress-test before assuming the spread holds.
Location & tenants
- Location reads 61/100 on livability (#196 in MS) — a middle-class / working-renter tenant base. Strengths: cost of living A+, housing A+, crime A; Watch: employment D, schools F, amenities F.
- Desoto County School District (suburban): math 48% / reading 42% proficiency, ranked #20 of 130 in MS (top 15%) — families likely to look elsewhere, expect single-tenant / working-renter base with shorter leases.
- Market conditions: Rents soft (-0.7%/yr); 95 active listings in the ZIP; 16 comparable units currently listed for rent nearby; rentals at typical pace (median 24d on market — plan ~3-4 weeks tenant-placement turnaround); 1,155 units permitted in DeSoto County in 2024 (0 in 5+ unit buildings).
- This rent runs 32% of the median local income ($53k/yr) — at the standard rent-burdened threshold; future hikes will face affordability resistance.
Forward outlook
- Local home prices are declining (-3.0%/yr); year-one equity from $864 of loan paydown is wiped out by about $4k of value loss. Plan a longer hold.
- DeSoto County population projected at +33% by 2050 — long-run rental-demand tailwind backs the buy-and-hold thesis.
Negotiation context
- It's been on market 79 days — a 6% lower offer ($117k) is reasonable based on typical stale-listing flexibility.
Risks & watch-outs
- Climate carrying-cost: extreme-heat days projected 7→21/yr by 2055 (HVAC capex compounding) — expect insurance premiums to compound above CPI over the hold.
Questions for the listing agent
- It's been on market 79 days. Have you received any prior offers? Is the seller open to a 6% concession, seller financing, or rate buy-down credit?
- Built in 1972 — when were the roof, HVAC, electrical panel, plumbing, and water heater last replaced?
- Why hasn't it sold? Are there any deal-killer items the seller is aware of (foundation, flood, title, zoning, code violations)?
- Is there a deadline driving the sale (1031 exchange, divorce, estate, relocation)? That informs how much negotiation room exists.
- Schools are F-rated, which usually means shorter tenancies and higher turnover. Who's the typical renter profile here, and what's been the actual vacancy rate?
- What's the average days-on-market for RENTAL listings here right now (not sales)? A rising rental-DOM trend means longer vacancies and softer asking-rent achievability than the comps imply.
- What's the recent tenant-quality profile in this submarket — average credit score on applications, eviction rate, late-payment / NSF rate, and stable-employment percentage? A property-management company in the area should have these aggregated.
- How much new for-sale + rental construction is in the pipeline within 1–3 miles? Heavy new supply typically softens prices + rents 12–24 months out; constrained supply supports both.
Investment metrics
- 1% rule
- 1.15% ✓
- Cap rate
- 9.27%
- Cash-on-cash
- 10.63%
- DSCR
- 1.47
- GRM
- 7.2
CMA / ARV
- ARV (median comp)
- $166,781
- List price
- $124,900
- Delta
- -25.11%
- Verdict
- UNDERPRICED
- Comps
- 20 within 1.0 mi
Show comp detail 12 sales within ~0.75 mi
| Address | Dist | Beds/Ba | Sqft | Sold | Price | $/sf | Match |
|---|---|---|---|---|---|---|---|
| 6470 Forest Glen Dr | 0.31mi | 3/1.0 | 938 (-2%) | 2mo | $147,300 | $157 | 80 |
| 6670 Embassy Cir | 0.31mi | 3/1.0 | 932 (-3%) | 5mo | $110,000 | $118 | 76 |
| 2940 Meadowbrook Dr | 0.26mi | 3/1.0 | 1,000 (+4%) | 10mo | $142,800 | $143 | 73 |
| 2848 Normandy Dr | 0.33mi | 3/1.0 | 1,095 (+14%) | 8mo | $167,000 | $153 | 56 |
| 3145 Forest Glen Dr | 0.32mi | 3/1.0 | 1,085 (+13%) | 15mo | $150,000 | $138 | 52 |
| 2595 Eastbrook Dr | 0.28mi | 3/1.5 | 1,099 (+14%) | 15mo | $134,900 | $123 | 49 |
| 6705 Gatewood Cir | 0.52mi | 3/1.5 | 1,069 (+11%) | 8mo | $199,900 | $187 | 48 |
| 3430 Mayfair Dr | 0.60mi | 3/2.0 | 1,089 (+13%) | 3mo | $204,900 | $188 | 43 |
| 6525 Lynnfield Rd | 0.57mi | 3/2.0 | 1,053 (+10%) | 15mo | $159,900 | $152 | 41 |
| 6435 Knight Cv | 0.62mi | 3/1.5 | 1,079 (+12%) | 11mo | $175,000 | $162 | 40 |
| 3530 Woodmont Cv | 0.72mi | 3/1.5 | 1,100 (+14%) | 7mo | $189,500 | $172 | 34 |
| 3400 Shadow Oaks Pkwy | 0.69mi | 3/2.0 | 1,080 (+12%) | 12mo | $190,000 | $176 | 33 |
Match score weights: distance 35% · size 25% · config 20% · recency 20%. Top-matched comps best support the ARV.
Projected returns pro-forma
-3.0% appreciation · 0.0% rent growth · sell at horizon
- IRR
- -3.7%
- Equity multiple
- 0.86×
- Total profit
- $-4,732
- Equity at exit
- $18,623
- IRR
- 2.3%
- Equity multiple
- 1.14×
- Total profit
- $4,964
- Equity at exit
- $10,799
Cash invested: $34,972 (down + closing). Projections, not guarantees.
Landlord ↔ Tenant lean methodology
- Overall (STATE)
- 90 Strongly Landlord-Friendly
- State Mississippi
- 90 Strongly Landlord-Friendly · R+11
- County
- — inherits STATE
- City
- — inherits STATE
ZIP-level market 38637
- Home prices YoY
- -13.4%
- Rents YoY
- -0.7%
- Active inventory
- 95
- Price-to-rent
- 7.2×
Monthly cashflow live
- Estimated rent
- $1,441 high interval (Pro) →
- Mortgage (P&I)
- −$655
- Tax from tax record
- −$122 /mo · $1,463/yr
- Insurance
- −$52
- HOA
- −$0
- Vacancy / Maint / Mgmt
- −$303
- Net cashflow
- $310
Break-even live
UW: 25.0% down · 7.5% · 30yr · 1.5% tax · 5.0% vac · 8.0% maint · 8.0% mgmt
Financing live
Cash to close
- Down payment
- $31,225
- Closing costs
- $3,747
- Reserves months
- —
- Total cash needed
- —
Loan-product check · same deal, 3 products live
Conventional
25% down · 7.5% · 30yr
- Down + closing
- —
- Monthly P&I
- —
- Monthly cashflow
- —
- DSCR
- —
- Eligible?
- —
Personal DTI + credit; lowest rate.
DSCR
20% down · 8.5% · 30yr
- Down + closing
- —
- Monthly P&I
- —
- Monthly cashflow
- —
- DSCR
- —
- Eligible?
- —
No personal income docs; deal must DSCR.
Hard money
10% down · 12.0% · 12mo
- Down + closing
- —
- Monthly P&I
- —
- Monthly cashflow
- —
- DSCR
- —
- Eligible?
- —
Short-term bridge; refi at stabilization.
Rent comps 16 comps
| Address | Beds | Baths | Sqft | Rent | $/sqft | DOM | Units | Dist |
|---|---|---|---|---|---|---|---|---|
| 2675 Ridgewood Cv Horn Lake, MS | 3.0 | 1.0 | 1035 | $1,195 | $1.15 | 23d | 1 | 0.13mi |
| 2675 Ridgewood Cv Horn Lake, MS | 3.0 | 1.0 | 1065 | $1,195 | $1.12 | 21d | 1 | 0.13mi |
| 3060 Fairmeadow Dr Horn Lake, MS | 3.0 | 1.5 | 1104 | $1,663 | $1.51 | 1d | 1 | 0.29mi |
| 6475 Forest Glen Dr Horn Lake, MS | 3.0 | 1.5 | 1100 | $1,395 | $1.27 | 43d | 1 | 0.35mi |
| 2905 Brook Cv Horn Lake, MS | 3.0 | 1.0 | 1112 | $1,195 | $1.07 | 21d | 1 | 0.40mi |
| 2905 Brook Cv Horn Lake, MS | 3.0 | 1.0 | 1112 | $1,195 | $1.07 | 1d | 1 | 0.40mi |
| 2900 Brachton Cv W Horn Lake, MS | 2.0 | 2.0 | 1000 | $1,225 | $1.23 | 23d | 1 | 0.53mi |
| 6420 Forestgate Rd Horn Lake, MS | 3.0 | 2.0 | 1120 | $1,573 | $1.40 | 21d | 1 | 0.58mi |
| 3305 Laurel Dr Horn Lake, MS | 3.0 | 2.0 | 1085 | $1,450 | $1.34 | 23d | 1 | 0.65mi |
| 6165 Forestgate Rd Horn Lake, MS | 3.0 | 1.5 | 1079 | $1,400 | $1.30 | 43d | 1 | 0.72mi |
| 7066 Foxhall Dr Horn Lake, MS | 3.0 | 2.0 | 998 | $1,395 | $1.40 | 44d | 1 | 0.88mi |
| 6420 Sandhurst Rd Horn Lake, MS | 3.0 | 2.0 | 1101 | $1,623 | $1.47 | 21d | 1 | 0.93mi |
| 1800 Joy Cir Horn Lake, MS | 2.0 | 2.0 | 1040 | $1,399 | $1.35 | 11d | 1 | 1.05mi |
| 1800 Joy Cir Horn Lake, MS | 2.0 | 2.0 | 1040 | $1,399 | $1.35 | 43d | 1 | 1.05mi |
| 1800 Joy Cir Horn Lake, MS | 2.0 | 2.0 | 1040 | $1,399 | $1.35 | 23d | 1 | 1.05mi |
| 6270 Jamestown Ave Horn Lake, MS | 3.0 | 2.0 | 1053 | $1,523 | $1.45 | 43d | 1 | 1.20mi |
Listing history 8 events
-
2026-06-07status $124,900 Pending 79 DOM
-
2026-06-03days on market $124,900 Active 79 DOM
-
2026-06-02days on market $124,900 Active 78 DOM
-
2026-06-01days on market $124,900 Active 77 DOM
-
2026-05-31days on market $124,900 Active 76 DOM
-
2026-05-05price $124,900 389-char remark
Show marketing remark (389 chars)
One-story home featuring 3 bedrooms and 1 bathroom with an attached 1-car carport and a welcoming front porch. The property offers a functional layout and a fenced backyard with plenty of space for outdoor living, pets, or future improvements. This home is in need of updates and repairs, making it a great opportunity for investors or buyers looking to renovate and add value. Sold as-is.
-
2026-03-17$159,900 Active 389-char remark
Show marketing remark (389 chars)
One-story home featuring 3 bedrooms and 1 bathroom with an attached 1-car carport and a welcoming front porch. The property offers a functional layout and a fenced backyard with plenty of space for outdoor living, pets, or future improvements. This home is in need of updates and repairs, making it a great opportunity for investors or buyers looking to renovate and add value. Sold as-is.
-
2015-02-06soldstatus
ⓘ Source: listings_history table (triggers on properties + properties_extension) + one-shot
backfill from property_details.listing_events for pre-trigger history.
Tax reassessment forecast MS · Resets to sale price
- Current annual tax
- $1,463 · $122/mo
- Projected year-2 tax
- $1,463 · $122/mo
- Expected delta
- $0/yr ($0/mo · 0.0%)
ⓘ Screening estimate from a state-policy table — verify with the county assessor before closing.
Climate risk First Street
- Flood 1/10 Low FEMA zone X (unshaded) · 0% chance over 30 yrs
- Wildfire 4/10 Moderate
- Heat 6/10 Major 7 d/yr ≥109°F today · 21 d/yr by 30 yrs out
- Wind 4/10 Moderate 19% chance of damaging wind over 30 yrs
- Air quality 2/10 Low 2 unhealthy d/yr today · 2 by 30 yrs out
Nearby sold comps map
Loading sold comps map…
Walkable amenities ~0.75 mi
Loading nearby amenities…
Taxation est. · year 1
- Rental income
- $17,297
- − Mortgage interest
- −$6,996
- − Property taxes
- −$1,463
- − Insurance
- −$624
- − Repairs & maintenance
- −$1,384
- − Management
- −$1,384
- − Depreciation
- −$3,633
- Taxable income
- $1,812
- Est. tax owed @ 24.0%
- −$435
- After-tax cash flow
- $3,283/yr
For passive investors: Depreciation is non-cash, so a rental often shows a tax loss while cash-flowing — sheltering income. Rental losses are passive: they offset passive income freely, and up to $25,000/yr can offset ordinary (W-2) income if you actively participate and your MAGI is under $100k (phasing out to $0 by $150k); unused losses carry forward. On sale, claimed depreciation is recaptured at up to 25%, and gains may owe capital-gains tax (a 1031 exchange can defer both). Figures are a year-1 estimate at your 24.0% rate — not tax advice; consult a CPA.
Schools (NCES district)
- District
- Desoto County School District
- NCES district ID
- 2801320
- Math proficiency
- 48% ▼ -13.00%
- Reading proficiency
- 42% ▼ -6.00%
- Median HH income
- $59,272
- Composite
- 39.56/100
- National rank
- #3933
- State rank
- #20 of 130 in MS
Livability — Horn Lake
- Score
- 61/100
- State rank
- #196
- US rank
- #17977
Category grades
Schools grade is shown separately in the Schools card above.
Census & demographics
- Census place
- Horn Lake, MS
- County
- DeSoto County · 176,513 people
- City population
- 26,647
- Metro
- Memphis, TN-MS-AR
- Population (ZIP)
- 26,647
- Household income
- $53,311
- Rent vs Own
- Severe rent burden
- 1052.0
Population outlook (DeSoto County) Hauer SSP2
- Today (2025)
- 203,338 people
- By 2030
- 217,692 · +7.1%
- By 2040
- 245,320 · +20.6%
- By 2050
- 270,133 · +32.8%
- By 2075
- 323,341 · +59.0%
- By 2100
- 348,742 · +71.5%
Race, ethnicity, and origin ACS 2023
- Neighborhood character
- Diverse neighborhood (Simpson 0.62)
- Race & ethnicity
- Black 44% White 42% Hispanic / Latino 9% Two or more races 5% Asian 1%
- Hispanic origin (detail)
- Mexican 7%
- Common ancestry
- Slovak 2% Lithuanian 1% Serbian 1%
- Foreign-born
- 7% · Canada
- Languages at home
- 91% English-only · Spanish 8%
Political lean MEDSL · DeSoto
- 2024 margin
- Strong R (+24.1) · D 36.7% · R 60.8% · Other 2.5%
- 2008→2024 swing
- +14.2pp toward D · 2008: -38.2pp · 2024: -24.1pp
- All cycles
- 2024: R+24.1 2020: R+23.9 2016: R+34.8 2012: R+33.5 2008: R+38.2
Not yet ingested
- Civics
- —
Market trends
- HPI YoY
- ▼ -32.08%
- Current HPI
- 206.5542
- Rent YoY
- ▼ -0.66%
- Metro
- Memphis, TN-MS-AR
- State GDP YoY
- —
- F500 in state
- 0
Price history
-21.9% since first listed3 events — show timeline
- 2026-05-05 Price Changed $124,900 MLSU
- 2026-03-17 Listed $159,900 MLSU
- 2015-02-06 Sold (Public Records) — Public Records
Property tax history
+54.7%/yrLatest (2025): $1,463 · +12.6% YoY. Source: county tax records.
Cash-flow waterfall
monthlySold comps — $/sqft
last 12 mo · ≤1 miLoading sold comps…