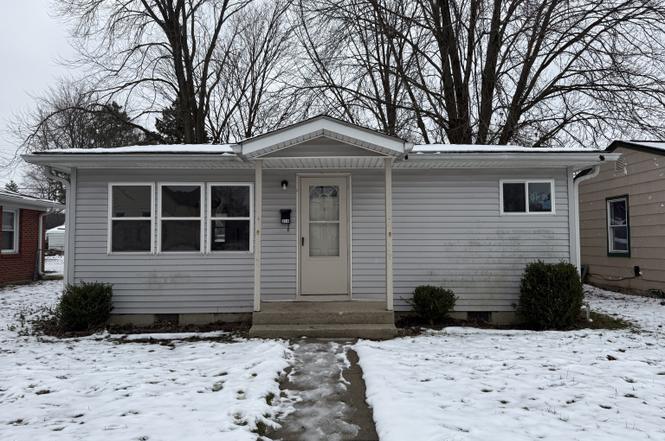
314 E Mill St · Fortville, IN
Flood risk 6/10 · Moderate
- FEMA flood zone
- X (unshaded)
- Chance of flooding over 30 yrs
- 0.69%
- Est. flood insurance / yr
- $507 – $1,088
Fire risk 1/10 · Minimal
- Est. fire insurance / yr
- $717 – $1,331
Heat risk 3/10 · Minor
- Hot days now (above 101°F)
- 7 days/yr
- Hot days in 30 yrs
- 18 days/yr
Wind risk 2/10 · Minimal
- Chance of severe wind over 30 yrs
- 0.0%
Air-quality risk 2/10 · Minimal
- Unhealthy air days now
- 1 days/yr
- Unhealthy air days in 30 yrs
- 2 days/yr
Risk factors via First Street. Map © Google.
Why this score? — see what drove the C+ grade
The composite is a weighted blend of 9 inputs, each scored 0–100. Each bar is that input's sub-score; the figure is the points it added to the 100-point composite (weight × sub-score).
- Cash flow +23.5/30.0
- ARV discount +15.0/15.0
- DSCR +7.5/10.0
- 1% rule +5.1/10.0
- Schools +4.1/10.0
- Livability +3.5/5.0
- Rent growth +2.5/5.0
- Condition / age +2.5/5.0
- Appreciation +0.0/10.0
$169,900
🖨 Deal sheet (PDF) 📄 Offer letter ✓ Due diligence
Listing remarks MLS
Cute two bedroom home in town of Fortville. New wood laminate flooring in living room and kitchen. New vinyl flooring in bathroom and new carpet in bedrooms! Home has been repainted inside. Maintenance free vinyl exterior, eat-in kitchen + laundry room. Gas forced air/heat. Furnace/AC just had routine maintenance completed. Vinyl replacement windows with screens!
Key facts
- Bright living area
- 10 minute walk
- Covered carport
Tags
Property features AI
Exterior
- Parking: Carport; Alley access
- Utilities: Public water; Municipal sewer connected; No solid waste service listed
- Home design: Single-family residence; One level
- Construction: Vinyl siding; Block foundation
- Exterior features: No fence; Lot less than 1/4 acre (~0.11 acre)
Interior
- Kitchen: Kitchen (14 x 9); Microwave; Gas oven; Refrigerator
- Bedrooms: 2 bedrooms on the main level (one ~11 x 10, the other ~11 x 10)
- Bathrooms: 1 full bathroom on the main level
- Heating & cooling: Forced air heating (natural gas); Central air conditioning
- Interior features: Attic access; Living room (15 x 13)
- Laundry & utility: Laundry room (10 x 6); Washer; Dryer
Neighborhood map
What this means for you Summary
Snapshot
- This is a 3-bed/1.0-bath single-family listed at $170k.
Deal economics
- At list price, monthly cash flow is $316 ($4k/yr) — positive.
- The deal already cash-flows at list — no discount required.
- Meets the 1% rule at list price ($2k rent vs $170k).
- Recommended offer: $150k (12.0% below list) — sets the bar for market timing.
- Cap rate 8.5% vs local median 4.2% in Fortville — top-decile yield for the area; either an underpriced asset or a hidden risk that comps aren't pricing in. Stress-test before assuming the spread holds.
Location & tenants
- Location reads 69/100 on livability (#189 in IN) — a middle-class / working-renter tenant base. Strengths: crime A+, cost of living A+, housing A+; Watch: amenities F, commute F, health & safety F.
- Mt Vernon Community School Corporation (rural): math 43% / reading 48% proficiency, ranked #70 of 301 in IN (top 23%) — families likely to look elsewhere, expect single-tenant / working-renter base with shorter leases; only 18% free/reduced lunch — higher-income household profile.
- Zoned schools: Fortville Elementary School (math 50% / reading 46%, grade D, #314 of 994 statewide, top 32%, 719 students, 31% FRL); Mt Vernon High School (math 41% / reading 71%, grade C, #73 of 369 statewide, top 20%, 1,431 students, 27% FRL).
- Market conditions: 306 active listings in the ZIP; 4 comparable units currently listed for rent nearby; rentals leasing fast (median 12d on market — plan ~1-2 weeks tenant-placement turnaround); 1,091 units permitted in Hancock County in 2024 (0 in 5+ unit buildings).
Forward outlook
- Local home prices are declining (-3.0%/yr); year-one equity from $1k of loan paydown is wiped out by about $5k of value loss. Plan a longer hold.
- Hancock County population projected at +7% by 2050 — modest demand growth; plan on rents tracking national, not racing it.
Negotiation context
- It's been on market 165 days — a 12% lower offer ($150k) is reasonable based on typical stale-listing flexibility.
- 4 sale attempts since 15y ago; this cycle's ask has dropped $30k (15%) from the opening price — seller is motivated, your offer sets the floor, not the list.
- Current owner paid $46k; list at $170k implies a 273% gain — meaningful room to come down on a strong offer.
Risks & watch-outs
- Watch-outs: built in 1951 — expect roof / HVAC / electrical / plumbing capex.
- Climate carrying-cost: major flood risk — expect insurance premiums to compound above CPI over the hold.
Questions for the listing agent
- It's been on market 165 days. Have you received any prior offers? Is the seller open to a 12% concession, seller financing, or rate buy-down credit?
- Built in 1951 — when were the roof, HVAC, electrical panel, plumbing, and water heater last replaced?
- Why hasn't it sold? Are there any deal-killer items the seller is aware of (foundation, flood, title, zoning, code violations)?
- Is there a deadline driving the sale (1031 exchange, divorce, estate, relocation)? That informs how much negotiation room exists.
- What's the average days-on-market for RENTAL listings here right now (not sales)? A rising rental-DOM trend means longer vacancies and softer asking-rent achievability than the comps imply.
- What's the recent tenant-quality profile in this submarket — average credit score on applications, eviction rate, late-payment / NSF rate, and stable-employment percentage? A property-management company in the area should have these aggregated.
- How much new for-sale + rental construction is in the pipeline within 1–3 miles? Heavy new supply typically softens prices + rents 12–24 months out; constrained supply supports both.
Investment metrics
- 1% rule
- 1.01% ✓
- Cap rate
- 8.52%
- Cash-on-cash
- 7.97%
- DSCR
- 1.35
- GRM
- 8.2
CMA / ARV
- ARV (on-the-fly)
- $205,408
- Comps found
- 5
Show comp detail 5 sales within ~0.75 mi
| Address | Dist | Beds/Ba | Sqft | Sold | Price | $/sf | Match |
|---|---|---|---|---|---|---|---|
| 314 E Michigan St | 0.24mi | 2/1.0 (-1) | 821 (+5%) | 6mo | $215,000 | $262 | 71 |
| 315 Elm St | 0.12mi | 2/1.0 (-1) | 856 (+9%) | 7mo | $142,500 | $166 | 69 |
| 212 E High St | 0.19mi | 2/1.0 (-1) | 864 (+10%) | 2mo | $170,000 | $197 | 68 |
| 505 E Mill St | 0.10mi | 2/1.0 (-1) | 820 (+5%) | 20mo | $220,000 | $268 | 66 |
| 421 W Staat St | 0.52mi | 2/1.0 (-1) | 864 (+10%) | 19mo | $265,000 | $307 | 38 |
Match score weights: distance 35% · size 25% · config 20% · recency 20%. Top-matched comps best support the ARV.
Projected returns pro-forma
-3.0% appreciation · 3.0% rent growth · sell at horizon
- IRR
- -4.2%
- Equity multiple
- 0.84×
- Total profit
- $-7,471
- Equity at exit
- $25,333
- IRR
- 5.5%
- Equity multiple
- 1.40×
- Total profit
- $19,171
- Equity at exit
- $14,690
Cash invested: $47,572 (down + closing). Projections, not guarantees.
Landlord ↔ Tenant lean methodology
- Overall (STATE)
- 90 Strongly Landlord-Friendly
- State Indiana
- 90 Strongly Landlord-Friendly · R+11
- County
- — inherits STATE
- City
- — inherits STATE
ZIP-level market 46040
- Home prices YoY
- -24.4%
- Active inventory
- 306
- Price-to-rent
- 8.2×
Monthly cashflow live
- Estimated rent
- $1,719 medium interval (Pro) →
- Mortgage (P&I)
- −$891
- Tax from tax record
- −$81 /mo · $968/yr
- Insurance
- −$71
- HOA
- −$0
- Vacancy / Maint / Mgmt
- −$361
- Net cashflow
- $316
Break-even live
Sensitivity live
| Price | -10% $412 | -5% $364 | +0% $316 | +5% $268 | +10% $220 |
|---|---|---|---|---|---|
| Rent | -10% $180 | -5% $248 | +0% $316 | +5% $384 | +10% $452 |
| Rate | -1.0pp $401 | -0.5pp $359 | base $316 | +0.5pp $272 | +1.0pp $227 |
UW: 25.0% down · 7.5% · 30yr · 1.5% tax · 5.0% vac · 8.0% maint · 8.0% mgmt
Financing live
Cash to close
- Down payment
- $42,475
- Closing costs
- $5,097
- Reserves months
- —
- Total cash needed
- —
Loan-product check · same deal, 3 products live
Conventional
25% down · 7.5% · 30yr
- Down + closing
- —
- Monthly P&I
- —
- Monthly cashflow
- —
- DSCR
- —
- Eligible?
- —
Personal DTI + credit; lowest rate.
DSCR
20% down · 8.5% · 30yr
- Down + closing
- —
- Monthly P&I
- —
- Monthly cashflow
- —
- DSCR
- —
- Eligible?
- —
No personal income docs; deal must DSCR.
Hard money
10% down · 12.0% · 12mo
- Down + closing
- —
- Monthly P&I
- —
- Monthly cashflow
- —
- DSCR
- —
- Eligible?
- —
Short-term bridge; refi at stabilization.
Rent comps 4 comps
| Address | Beds | Baths | Sqft | Rent | $/sqft | DOM | Units | Dist |
|---|---|---|---|---|---|---|---|---|
| 334 W Staat St Fortville, IN | 3.0 | 1.0 | 1014 | $1,600 | $1.58 | 11d | 1 | 0.40mi |
| 602 Bradley Dr Fortville, IN | 2.0–3.0 | 2.0 | 1105 | $1,602 | $1.45 | 2d | 8 | 0.41mi |
| 650 N Main St Fortville, IN | 1.0–3.0 | 2.0 | 1189 | $1,939 | $1.63 | 2d | 4 | 0.48mi |
| 710 Brooks Dr Fortville, IN | 3.0 | 1.0 | 925 | $1,800 | $1.95 | 11d | 1 | 0.52mi |
Listing history 21 events
-
2026-06-05status $169,900 Pending 165 DOM
-
2026-06-03days on market $169,900 Active 165 DOM
-
2026-06-02days on market $169,900 Active 164 DOM
-
2026-06-01days on market $169,900 Active 163 DOM
-
2026-05-31days on market $169,900 Active 162 DOM
-
2026-05-21price $169,900
-
2026-05-18status Active
-
2026-05-07status Pending
-
2026-04-08price $188,500
-
2026-03-05price $190,000
-
2026-02-12price $194,000
-
2025-12-08$199,950 Active
-
2025-10-08historical
-
2025-09-05price $204,999
-
2025-08-09price $206,999
-
2025-07-17price $209,000
-
2025-07-08$214,000 Active
-
2012-05-29historical 372-char remark
Show marketing remark (372 chars)
Cute two bedroom home in town of Fortville. New wood laminate flooring in living room and kitchen. New vinyl flooring in bathroom and new carpet in bedrooms! Home has been repainted inside. Maintenance free vinyl exterior, eat-in kitchen + laundry room. Gas forced air/heat. Furnace/AC just had routine maintenance completed. Vinyl replacement windows with screens!
-
2012-05-25soldstatus $45,560 372-char remark
Show marketing remark (372 chars)
Cute two bedroom home in town of Fortville. New wood laminate flooring in living room and kitchen. New vinyl flooring in bathroom and new carpet in bedrooms! Home has been repainted inside. Maintenance free vinyl exterior, eat-in kitchen + laundry room. Gas forced air/heat. Furnace/AC just had routine maintenance completed. Vinyl replacement windows with screens!
-
2011-09-26$48,000 372-char remark
Show marketing remark (372 chars)
Cute two bedroom home in town of Fortville. New wood laminate flooring in living room and kitchen. New vinyl flooring in bathroom and new carpet in bedrooms! Home has been repainted inside. Maintenance free vinyl exterior, eat-in kitchen + laundry room. Gas forced air/heat. Furnace/AC just had routine maintenance completed. Vinyl replacement windows with screens!
-
2004-05-19soldstatus $65,000
ⓘ Source: listings_history table (triggers on properties + properties_extension) + one-shot
backfill from property_details.listing_events for pre-trigger history.
Tax reassessment forecast IN · Partial reset (capped growth)
- Current annual tax
- $968 · $81/mo
- Projected year-2 tax
- $1,206 · $101/mo
- Expected delta
- +$238/yr (+$20/mo · 24.6%)
ⓘ Screening estimate from a state-policy table — verify with the county assessor before closing.
Climate risk First Street
- Flood 6/10 Major FEMA zone X (unshaded) · 69% chance over 30 yrs
- Wildfire 1/10 Low
- Heat 3/10 Moderate 7 d/yr ≥101°F today · 18 d/yr by 30 yrs out
- Wind 2/10 Low 0% chance of damaging wind over 30 yrs
- Air quality 2/10 Low 1 unhealthy d/yr today · 2 by 30 yrs out
Nearby sold comps map
Loading sold comps map…
Walkable amenities ~0.75 mi
Loading nearby amenities…
Taxation est. · year 1
- Rental income
- $20,632
- − Mortgage interest
- −$9,517
- − Property taxes
- −$968
- − Insurance
- −$850
- − Repairs & maintenance
- −$1,651
- − Management
- −$1,651
- − Depreciation
- −$4,943
- Taxable income
- $1,054
- Est. tax owed @ 24.0%
- −$253
- After-tax cash flow
- $3,537/yr
For passive investors: Depreciation is non-cash, so a rental often shows a tax loss while cash-flowing — sheltering income. Rental losses are passive: they offset passive income freely, and up to $25,000/yr can offset ordinary (W-2) income if you actively participate and your MAGI is under $100k (phasing out to $0 by $150k); unused losses carry forward. On sale, claimed depreciation is recaptured at up to 25%, and gains may owe capital-gains tax (a 1031 exchange can defer both). Figures are a year-1 estimate at your 24.0% rate — not tax advice; consult a CPA.
Schools (NCES district)
- District
- Mt Vernon Community School Corporation
- NCES district ID
- 1807260
- Math proficiency
- 43% ▼ -12.00%
- Reading proficiency
- 48% ▼ -7.00%
- Median HH income
- $73,671
- Composite
- 41.3/100
- National rank
- #3514
- State rank
- #70 of 301 in IN
Livability — Fortville
- Score
- 69/100
- State rank
- #189
- US rank
- #8710
Category grades
Schools grade is shown separately in the Schools card above.
Census & demographics
- Census place
- Fortville, IN
- Population (ZIP)
- 17,891
Population outlook (Hancock County) Hauer SSP2
- Today (2025)
- 77,820 people
- By 2030
- 79,914 · +2.7%
- By 2040
- 82,734 · +6.3%
- By 2050
- 83,348 · +7.1%
- By 2075
- 82,439 · +5.9%
- By 2100
- 74,181 · -4.7%
Race, ethnicity, and origin ACS 2023
- Neighborhood character
- Predominantly White (83%)
- Race & ethnicity
- White 83% Black 6% Two or more races 4% Asian 4% Hispanic / Latino 2%
- Common ancestry
- Lithuanian 5% Romanian 2% Portuguese 2%
- Foreign-born
- 5% · Canada
- Languages at home
- 94% English-only · Other Indo-European 3% Arabic 1% Spanish 1%
Political lean MEDSL · Hancock
- 2024 margin
- Solid R (+33.7) · D 32.2% · R 65.9% · Other 1.9%
- 2008→2024 swing
- -4.1pp toward R · 2008: -29.6pp · 2024: -33.7pp
- All cycles
- 2024: R+33.7 2020: R+37.5 2016: R+44.8 2012: R+41.0 2008: R+29.6
Not yet ingested
- Civics
- —
Market trends
- HPI YoY
- ▼ -71.54%
- Current HPI
- 221.8703
- Rent YoY
- —
- Metro
- —
- State GDP YoY
- ▲ 2.90%
- F500 in state
- 18
Industry mix (Fortune 500 HQ in IN)
| Industry | F500 HQs | Revenue |
|---|---|---|
| Industrial Machinery | 2 | $37B |
|
||
| Healthcare | 1 | $177B |
|
||
| Pharmaceuticals | 1 | $45B |
|
||
| Metals / Steel | 1 | $18B |
|
||
| Agriculture | 1 | $17B |
|
||
| Packaging | 1 | $12B |
|
||
Price history
+161.4% since first listed16 events — show timeline
- 2026-05-21 Price Changed $169,900 MIBOR as Distributed by MLS Grid
- 2026-05-18 Relisted — MIBOR as Distributed by MLS Grid
- 2026-05-07 Pending — MIBOR as Distributed by MLS Grid
- 2026-04-08 Price Changed $188,500 MIBOR as Distributed by MLS Grid
- 2026-03-05 Price Changed $190,000 MIBOR as Distributed by MLS Grid
- 2026-02-12 Price Changed $194,000 MIBOR as Distributed by MLS Grid
- 2025-12-08 Listed $199,950 MIBOR as Distributed by MLS Grid
- 2025-10-08 Listing Removed — MIBOR as Distributed by MLS Grid
- 2025-09-05 Price Changed $204,999 MIBOR as Distributed by MLS Grid
- 2025-08-09 Price Changed $206,999 MIBOR as Distributed by MLS Grid
- 2025-07-17 Price Changed $209,000 MIBOR as Distributed by MLS Grid
- 2025-07-08 Listed $214,000 MIBOR as Distributed by MLS Grid
- 2012-05-29 Listing Removed — MIBOR as Distributed by MLS Grid
- 2012-05-25 Sold (MLS) $45,560 MIBOR as Distributed by MLS Grid
- 2011-09-26 Listed $48,000 MIBOR as Distributed by MLS Grid
- 2004-05-19 Sold (Public Records) $65,000 Public Records
Property tax history
+9.6%/yrLatest (2025): $968 · -17.0% YoY. Source: county tax records.
Cash-flow waterfall
monthlySold comps — $/sqft
last 12 mo · ≤1 miLoading sold comps…