 Duplex
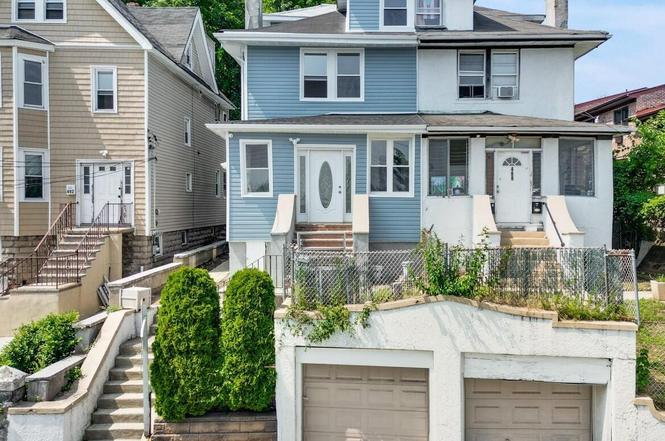
490 Van Duzer St · New York, NY
Flood risk 1/10 · Minimal
- FEMA flood zone
- X (unshaded)
- Chance of flooding over 30 yrs
- 0.0%
- Est. flood insurance / yr
- $507 – $1,088
Fire risk 1/10 · Minimal
- Est. fire insurance / yr
- $691 – $1,283
Heat risk 7/10 · Major
- Hot days now (above 98°F)
- 7 days/yr
- Hot days in 30 yrs
- 16 days/yr
Wind risk 6/10 · Moderate
- Chance of severe wind over 30 yrs
- 52.0%
Air-quality risk 4/10 · Minor
- Unhealthy air days now
- 5 days/yr
- Unhealthy air days in 30 yrs
- 7 days/yr
Risk factors via First Street. Map © Google.
Why this score? — see what drove the F grade
The composite is a weighted blend of 9 inputs, each scored 0–100. Each bar is that input's sub-score; the figure is the points it added to the 100-point composite (weight × sub-score).
- Cash flow +11.7/30.0
- Schools +5.0/10.0
- Livability +3.8/5.0
- DSCR +3.5/10.0
- Rent growth +3.0/5.0
- 1% rule +2.5/10.0
- Condition / age +2.5/5.0
- ARV discount +0.4/15.0
- Appreciation +0.0/10.0
$799,900
🖨 Deal sheet (PDF) 📄 Offer letter ✓ Due diligence
Multi-family units
County records classify this as Multi-Family (2-4 Unit). Listing-text estimate: 2 units. confirmed
Listing remarks MLS
Stapleton Heights-Staten Island-Attention investors!! Top Floor Apt rented at 3,777, First Floor and Basement just moved out 3/16/26, Two family gut renovated, brand new plumbing, electric system, siding, gutters and updated roof, each unit has washer and dryer hookups, First Floor and Basement used together as 2-3 bedrooms, 2 full baths, yard access, stunning kitchen featuring a granite countertop, wood cabinets and brand-new stainless-steel appliances package, Second and Third Floors are also well-designed as a 4 bedroom duplex apartment, open layout with a living room bathed in natural light, modern full bathroom with floor to ceiling tiles, beautiful brand-new kitchen has wood cabinets, granite countertops, kitchen island, and new 4-package stainless steel appliance package too, LED high hat lighting throughout, Rent roll can be 7,554 per month includes utilities, 10 Cap Rate!!!, perfect for 1031 exchange, House size 17'x42', Lot Size 25'x175', Year Built 1920, Taxes 5,377, **some photos have been virtually staged**
Key facts
- Gut renovated
- Brand new plumbing
- Electric system
Tags
Property features AI
Finance
- Other: One unit currently listed month-to-month; Projected/current rent noted for units
- Financial info: Financing options include bank mortgage, cash, or exchange considered; Property configured as a 2-unit multi-family (2 units)
Exterior
- Parking: Private drive; Detached garage with 1 parking space
- Utilities: Electric service with circuit breakers; Gas hot water; Gas heating (baseboard)
- Home design: Semi-detached residential building; Multiple stories with units on separate floors; Vinyl siding exterior; Pitched shingle roof; Facing direction not specified
- Construction: Wood frame construction; Poured concrete foundation; Built footprint approximately 714 (building dimensions 42.00 x 17.00)
- Exterior features: Front, side and back yards; Porch; Terrace
Interior
- Kitchen: Dishwasher; Oven/Range; Refrigerator
- Bedrooms: Two bedrooms on the first level; Two bedrooms on the second level; Two bedrooms on the third level
- Flooring: Laminate floors; Tile floors
- Bathrooms: Three full bathrooms total; One full bathroom on the second level; One full bathroom on the third level
- Heating & cooling: Gas heating; Baseboard heat; Circuit breaker electric service; No central air units reported
- Interior features: Dishwasher; Dryer; Garage door opener; Laundry area; Porch; Refrigerator; Stove / Oven / Range; Terrace; Washer; Finished full basement
- Laundry & utility: Washer and dryer included; Laundry area; Garage door opener
Neighborhood map
What this means for you Summary
Snapshot
- This is a 2 × 3-bed/1.5-bath units multifamily listed at $800k.
Deal economics
- At list price, monthly cash flow is $-230 ($-3k/yr) — negative. Per door: $-115/mo.
- To cash-flow at today's rent, offer at most $759k (5.1% below list).
- To meet the 1% rule (rent ≥ 1% of price), the offer needs to be $604k (24.6% below list).
- Recommended offer: $604k (24.6% below list) — sets the bar for 1% rule.
- Cap rate 5.9% vs local median 2.6% in New York — top-decile yield for the area; either an underpriced asset or a hidden risk that comps aren't pricing in. Stress-test before assuming the spread holds.
Location & tenants
- Location reads 75/100 on livability (#268 in NY, #4,188 nationally) — a middle-class / working-renter tenant base. Strengths: amenities A+, commute A+, health & safety A; Watch: crime F, cost of living F.
- Market conditions: Rents rising (+2.0%/yr); 203 active listings in the ZIP; 480 units permitted in Richmond County in 2024 (22 in 5+ unit buildings).
- At $6,035/mo this rent would consume 101% of the median local household income ($72k/yr) (locally 2401% of renters already pay >50% of income on rent) — very limited rent-growth headroom before tenants either downsize or default.
Forward outlook
- Local home prices are declining (-3.0%/yr); year-one equity from $6k of loan paydown is wiped out by about $24k of value loss. Plan a longer hold.
- Richmond County population projected to shrink 5% by 2050 — rents likely to lag national; underwrite the cash flow, not the appreciation.
Negotiation context
- It's been on market 95 days — a 9% lower offer ($728k) is reasonable based on typical stale-listing flexibility.
- 10 sale attempts since 27y ago with the ask held roughly flat each time — persistent listings suggest the price (not the market) is what's stuck; bring a comps-based counter.
- Current owner paid $420k; list at $800k implies a 90% gain — meaningful room to come down on a strong offer.
Risks & watch-outs
- Watch-outs: built in 1920 — expect roof / HVAC / electrical / plumbing capex.
- Climate carrying-cost: major wind risk, 52% chance of damaging wind over 30y; extreme-heat days projected 7→16/yr by 2055 (HVAC capex compounding) — expect insurance premiums to compound above CPI over the hold.
Questions for the listing agent
- What do current leases actually rent for vs. the listed asking? Can we see a recent rent roll and the last 12 months of T-12 income?
- It's been on market 95 days. Have you received any prior offers? Is the seller open to a 25% concession, seller financing, or rate buy-down credit?
- Can we see the unit-by-unit rent roll, current vacancy, and any below-market leases? What's the average tenancy length?
- What capital expenditures (roof, boiler, parking lot, exteriors) have been made in the last 5 years, and what's planned in the next 2?
- Built in 1920 — when were the roof, HVAC, electrical panel, plumbing, and water heater last replaced?
- Why hasn't it sold? Are there any deal-killer items the seller is aware of (foundation, flood, title, zoning, code violations)?
- Is there a deadline driving the sale (1031 exchange, divorce, estate, relocation)? That informs how much negotiation room exists.
- Schools are B-rated — typically a magnet for longer-tenancy family renters. What's the average tenant stay here, and is there a school-zone premium baked into asking?
- Crime grade is F in this area — have there been break-ins, vandalism, or insurance claims at this property in the last 3 years? What carrier currently insures it and at what premium?
- The area grade is low — what's the realistic commute time and amenity access for the typical tenant pool here? Any planned neighborhood developments (good or bad) we should know about?
- What's the average days-on-market for RENTAL listings here right now (not sales)? A rising rental-DOM trend means longer vacancies and softer asking-rent achievability than the comps imply.
- What's the recent tenant-quality profile in this submarket — average credit score on applications, eviction rate, late-payment / NSF rate, and stable-employment percentage? A property-management company in the area should have these aggregated.
- How much new apartment / multifamily construction is in the pipeline within 1–3 miles? Heavy new supply (>2% of stock underway) typically softens rents 12–24 months out; light construction supports rent growth.
Investment metrics
- 1% rule
- 0.75% ✗
- Cap rate
- 5.95%
- Cash-on-cash
- -1.23%
- DSCR
- 0.95
- GRM
- 11.0
CMA / ARV
- ARV (on-the-fly)
- $690,696
- Comps found
- 3
Show comp detail 3 sales within ~0.75 mi
| Address | Dist | Beds/Ba | Sqft | Sold | Price | $/sf | Match |
|---|---|---|---|---|---|---|---|
| 251 Castleton Ave | 0.60mi | 5/3.0 (-1) | 1,470 (+2%) | 5mo | $675,000 | $459 | 60 |
| 92 Canal St | 0.32mi | 6/3.0 | 1,250 (-14%) | 20mo | $815,000 | $652 | 46 |
| 80 Corson Ave | 0.70mi | 7/2.0 (+1) | 1,584 (+9%) | 5mo | $755,000 | $477 | 39 |
Match score weights: distance 35% · size 25% · config 20% · recency 20%. Top-matched comps best support the ARV.
Projected returns pro-forma
-3.0% appreciation · 1.99% rent growth · sell at horizon
- IRR
- -19.4%
- Equity multiple
- 0.33×
- Total profit
- $-150,578
- Equity at exit
- $119,268
- IRR
- -14.2%
- Equity multiple
- 0.22×
- Total profit
- $-175,357
- Equity at exit
- $69,161
Cash invested: $223,972 (down + closing). Projections, not guarantees.
Landlord ↔ Tenant lean methodology
- Overall (CITY)
- 0 Strongly Tenant-Friendly
- State New York
- 15 Strongly Tenant-Friendly · D+10
- County
- — inherits STATE
- City New York
- 0 Strongly Tenant-Friendly · D+34
ZIP-level market 10304
- Rents YoY
- 2.0%
- Active inventory
- 203
- Price-to-rent
- 22.1×
Monthly cashflow live
- Estimated rent
- $6,035 medium interval (Pro) →
- Mortgage (P&I)
- −$4,195
- Tax from tax record
- −$470 /mo · $5,636/yr
- Insurance
- −$333
- HOA
- −$0
- Vacancy / Maint / Mgmt
- −$1,267
- Net cashflow
- $-230
Break-even live
Sensitivity live
| Price | -10% $223 | -5% $-4 | +0% $-230 | +5% $-456 | +10% $-683 |
|---|---|---|---|---|---|
| Rent | -10% $-707 | -5% $-468 | +0% $-230 | +5% $8 | +10% $247 |
| Rate | -1.0pp $173 | -0.5pp $-27 | base $-230 | +0.5pp $-437 | +1.0pp $-648 |
2-unit breakdown (identical units grouped — click to expand)
| Units | Beds | Baths | Est. rent |
|---|---|---|---|
| 2× units | 3 | 1.5 | $6,034 |
| #1 | 3 | 1.5 | $3,017 |
| #2 | 3 | 1.5 | $3,017 |
| Total (2 units) | $6,035 | ||
UW: 25.0% down · 7.5% · 30yr · 1.5% tax · 5.0% vac · 8.0% maint · 8.0% mgmt
Financing live
Cash to close
- Down payment
- $199,975
- Closing costs
- $23,997
- Reserves months
- —
- Total cash needed
- —
Loan-product check · same deal, 3 products live
Conventional
25% down · 7.5% · 30yr
- Down + closing
- —
- Monthly P&I
- —
- Monthly cashflow
- —
- DSCR
- —
- Eligible?
- —
Personal DTI + credit; lowest rate.
DSCR
20% down · 8.5% · 30yr
- Down + closing
- —
- Monthly P&I
- —
- Monthly cashflow
- —
- DSCR
- —
- Eligible?
- —
No personal income docs; deal must DSCR.
Hard money
10% down · 12.0% · 12mo
- Down + closing
- —
- Monthly P&I
- —
- Monthly cashflow
- —
- DSCR
- —
- Eligible?
- —
Short-term bridge; refi at stabilization.
Listing history 26 events
-
2026-04-20status Pending 1035-char remark
Show marketing remark (1035 chars)
Stapleton Heights-Staten Island-Attention investors!! Top Floor Apt rented at 3,777, First Floor and Basement just moved out 3/16/26, Two family gut renovated, brand new plumbing, electric system, siding, gutters and updated roof, each unit has washer and dryer hookups, First Floor and Basement used together as 2-3 bedrooms, 2 full baths, yard access, stunning kitchen featuring a granite countertop, wood cabinets and brand-new stainless-steel appliances package, Second and Third Floors are also well-designed as a 4 bedroom duplex apartment, open layout with a living room bathed in natural light, modern full bathroom with floor to ceiling tiles, beautiful brand-new kitchen has wood cabinets, granite countertops, kitchen island, and new 4-package stainless steel appliance package too, LED high hat lighting throughout, Rent roll can be 7,554 per month includes utilities, 10 Cap Rate!!!, perfect for 1031 exchange, House size 17'x42', Lot Size 25'x175', Year Built 1920, Taxes 5,377, **some photos have been virtually staged**
-
2026-04-20status Pending
Show marketing remark (1035 chars)
Stapleton Heights-Staten Island-Attention investors!! Top Floor Apt rented at 3,777, First Floor and Basement just moved out 3/16/26, Two family gut renovated, brand new plumbing, electric system, siding, gutters and updated roof, each unit has washer and dryer hookups, First Floor and Basement used together as 2-3 bedrooms, 2 full baths, yard access, stunning kitchen featuring a granite countertop, wood cabinets and brand-new stainless-steel appliances package, Second and Third Floors are also well-designed as a 4 bedroom duplex apartment, open layout with a living room bathed in natural light, modern full bathroom with floor to ceiling tiles, beautiful brand-new kitchen has wood cabinets, granite countertops, kitchen island, and new 4-package stainless steel appliance package too, LED high hat lighting throughout, Rent roll can be 7,554 per month includes utilities, 10 Cap Rate!!!, perfect for 1031 exchange, House size 17'x42', Lot Size 25'x175', Year Built 1920, Taxes 5,377, **some photos have been virtually staged**
-
2026-01-15$799,900 Active 1035-char remark
Show marketing remark (1035 chars)
Stapleton Heights-Staten Island-Attention investors!! Top Floor Apt rented at 3,777, First Floor and Basement just moved out 3/16/26, Two family gut renovated, brand new plumbing, electric system, siding, gutters and updated roof, each unit has washer and dryer hookups, First Floor and Basement used together as 2-3 bedrooms, 2 full baths, yard access, stunning kitchen featuring a granite countertop, wood cabinets and brand-new stainless-steel appliances package, Second and Third Floors are also well-designed as a 4 bedroom duplex apartment, open layout with a living room bathed in natural light, modern full bathroom with floor to ceiling tiles, beautiful brand-new kitchen has wood cabinets, granite countertops, kitchen island, and new 4-package stainless steel appliance package too, LED high hat lighting throughout, Rent roll can be 7,554 per month includes utilities, 10 Cap Rate!!!, perfect for 1031 exchange, House size 17'x42', Lot Size 25'x175', Year Built 1920, Taxes 5,377, **some photos have been virtually staged**
-
2026-01-14$799,900 Active
-
2026-01-01historical
-
2025-12-31historical
-
2025-09-26$810,000 Active
-
2025-09-25historical
-
2025-04-24$810,000 Active
-
2025-04-09$810,000 Active
-
2024-12-31historical
-
2024-10-31historical
-
2024-08-26price $869,900
-
2024-08-26price $869,900
-
2024-07-23price $889,000
-
2024-07-08$899,900 Active
-
2024-07-08$899,900 Active
-
2023-11-28soldstatus $419,950 Closed
-
2023-10-01status Pending
-
2023-08-02$419,950 Active
-
2019-07-16historical
-
2019-02-08$649,900 Active
-
2000-05-04soldstatus $121,500
-
2000-03-14soldstatus $121,500
-
1999-06-10$129,900
-
1988-06-13soldstatus $106,000
ⓘ Source: listings_history table (triggers on properties + properties_extension) + one-shot
backfill from property_details.listing_events for pre-trigger history.
Tax reassessment forecast NY · Partial reset (capped growth)
- Current annual tax
- $5,636 · $470/mo
- Projected year-2 tax
- $9,577 · $798/mo
- Expected delta
- +$3,941/yr (+$328/mo · 69.9%)
ⓘ Screening estimate from a state-policy table — verify with the county assessor before closing.
Climate risk First Street
- Flood 1/10 Low FEMA zone X (unshaded) · 0% chance over 30 yrs
- Wildfire 1/10 Low
- Heat 7/10 Severe 7 d/yr ≥98°F today · 16 d/yr by 30 yrs out
- Wind 6/10 Major 52% chance of damaging wind over 30 yrs
- Air quality 4/10 Moderate 5 unhealthy d/yr today · 7 by 30 yrs out
Nearby sold comps map
Loading sold comps map…
Walkable amenities ~0.75 mi
Loading nearby amenities…
Taxation est. · year 1
- Rental income
- $72,420
- − Mortgage interest
- −$44,807
- − Property taxes
- −$5,636
- − Insurance
- −$4,000
- − Repairs & maintenance
- −$5,794
- − Management
- −$5,794
- − Depreciation
- −$23,270
- Taxable loss
- −$16,879
- Est. tax savings @ 24.0%
- +$4,051
- After-tax cash flow
- $1,290/yr
For passive investors: Depreciation is non-cash, so a rental often shows a tax loss while cash-flowing — sheltering income. Rental losses are passive: they offset passive income freely, and up to $25,000/yr can offset ordinary (W-2) income if you actively participate and your MAGI is under $100k (phasing out to $0 by $150k); unused losses carry forward. On sale, claimed depreciation is recaptured at up to 25%, and gains may owe capital-gains tax (a 1031 exchange can defer both). Figures are a year-1 estimate at your 24.0% rate — not tax advice; consult a CPA.
Schools (NCES district)
No district data.
Livability — New York
- Score
- 75/100
- State rank
- #268
- US rank
- #4188
Category grades
Schools grade is shown separately in the Schools card above.
Census & demographics
- Census place
- New York, NY
- County
- Richmond County · 404,174 people
- City population
- 7,731,280
- Metro
- New York-Newark-Jersey City, NY-NJ-PA
- Population (ZIP)
- 45,658
- Household income
- $71,561
- Rent vs Own
- Severe rent burden
- 2401.0
Population outlook (Richmond County) Hauer SSP2
- Today (2025)
- 482,784 people
- By 2030
- 481,831 · -0.2%
- By 2040
- 473,159 · -2.0%
- By 2050
- 457,242 · -5.3%
- By 2075
- 408,029 · -15.5%
- By 2100
- 341,459 · -29.3%
Race, ethnicity, and origin ACS 2023
- Neighborhood character
- Highly diverse neighborhood (Simpson 0.73)
- Race & ethnicity
- White 36% Black 25% Hispanic / Latino 24% Asian 13% Two or more races 8% Native American 1%
- Hispanic origin (detail)
- Mexican 4% Puerto Rican 10% Dominican 2%
- Common ancestry
- Scotch-Irish 3% Romanian 2% Swiss 2%
- Foreign-born
- 32% · Canada, China, Jamaica
- Languages at home
- 54% English-only · Spanish 16% Chinese 8% Other Indo-European 5%
Political lean MEDSL · Richmond
- 2024 margin
- Strong R (+29.8) · D 35.1% · R 64.9%
- 2008→2024 swing
- -25.7pp toward R · 2008: -4.0pp · 2024: -29.8pp
- All cycles
- 2024: R+29.8 2020: R+14.9 2016: R+16.8 2012: D+0.8 2008: R+4.0
Not yet ingested
- Civics
- —
Market trends
- HPI YoY
- ▼ -254.93%
- Current HPI
- 346.7976
- Rent YoY
- ▲ 1.99%
- Metro
- New York-Newark-Jersey City, NY-NJ-PA
- State GDP YoY
- ▲ 2.60%
- F500 in state
- 92
Industry mix (Fortune 500 HQ in NY)
| Industry | F500 HQs | Revenue |
|---|---|---|
| Financial Services | 10 | $950B |
|
||
| Consumer Goods | 9 | $162B |
|
||
| Insurance | 4 | $225B |
|
||
| Telecommunications | 2 | $144B |
|
||
| Pharmaceuticals | 2 | $112B |
|
||
| Media / Entertainment | 2 | $69B |
|
||
Price history
+654.6% since first listed26 events — show timeline
- 2026-04-20 Pending — SIBORMLS
- 2026-04-20 Pending — BNYMLS
- 2026-01-15 Listed $799,900 SIBORMLS
- 2026-01-14 Listed $799,900 BNYMLS
- 2026-01-01 Listing Removed — OneKey® MLS as Distributed by MLS Grid
- 2025-12-31 Listing Removed — SIBORMLS
- 2025-09-26 Listed $810,000 OneKey® MLS as Distributed by MLS Grid
- 2025-09-25 Listing Removed — OneKey® MLS as Distributed by MLS Grid
- 2025-04-24 Listed $810,000 SIBORMLS
- 2025-04-09 Listed $810,000 OneKey® MLS as Distributed by MLS Grid
- 2024-12-31 Listing Removed — SIBORMLS
- 2024-10-31 Listing Removed — OneKey® MLS as Distributed by MLS Grid
- 2024-08-26 Price Changed $869,900 SIBORMLS
- 2024-08-26 Price Changed $869,900 OneKey® MLS as Distributed by MLS Grid
- 2024-07-23 Price Changed $889,000 OneKey® MLS as Distributed by MLS Grid
- 2024-07-08 Listed $899,900 OneKey® MLS as Distributed by MLS Grid
- 2024-07-08 Listed $899,900 SIBORMLS
- 2023-11-28 Sold (MLS) $419,950 OneKey® MLS as Distributed by MLS Grid
- 2023-10-01 Pending — OneKey® MLS as Distributed by MLS Grid
- 2023-08-02 Listed $419,950 OneKey® MLS as Distributed by MLS Grid
- 2019-07-16 Listing Removed — SIBORMLS
- 2019-02-08 Listed $649,900 SIBORMLS
- 2000-05-04 Sold (Public Records) $121,500 Public Records
- 2000-03-14 Sold (MLS) $121,500 SIBORMLS
- 1999-06-10 Listed $129,900 SIBORMLS
- 1988-06-13 Sold (Public Records) $106,000 Public Records
Property tax history
+4.9%/yrLatest (2025): $5,636 · +6.0% YoY. Source: county tax records.
Cash-flow waterfall
monthlySold comps — $/sqft
last 12 mo · ≤1 miLoading sold comps…