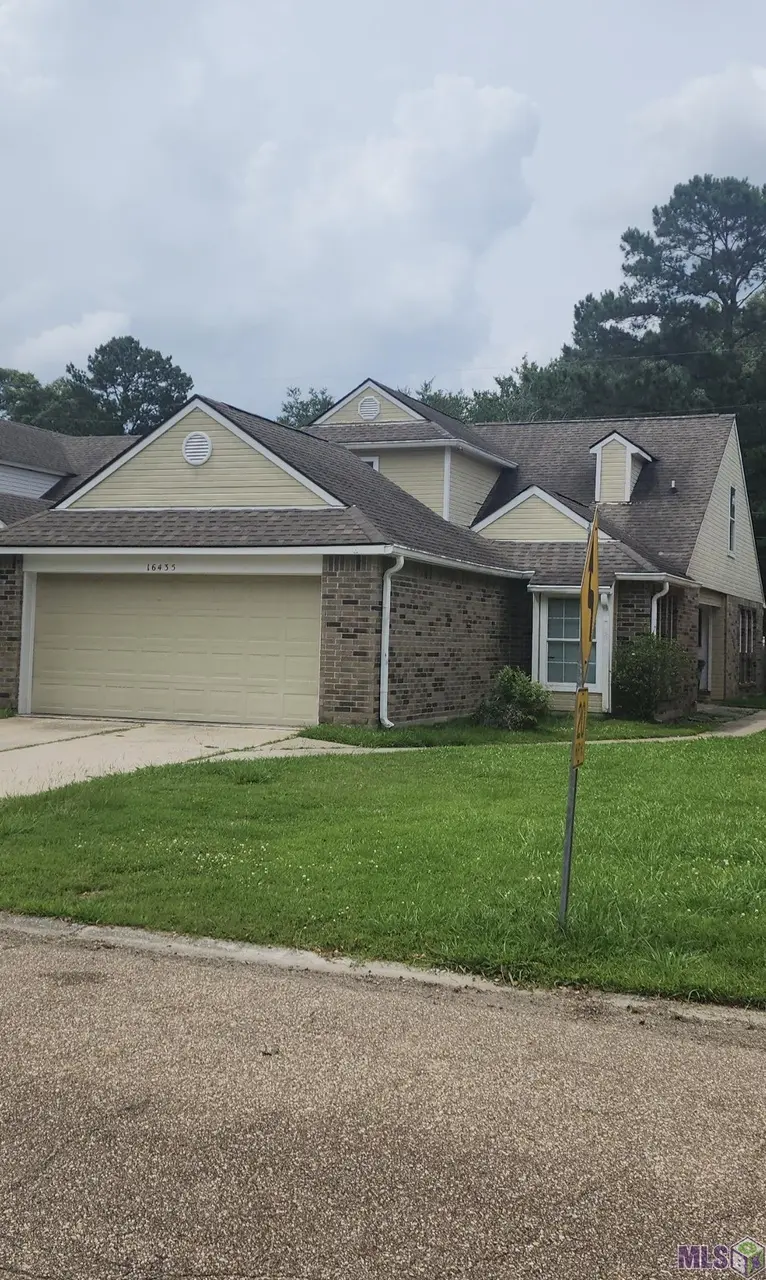
16435 Crepemyrtle Dr · Old Jefferson, LA
Flood risk 1/10 · Minimal
- FEMA flood zone
- X
- Chance of flooding over 30 yrs
- 0.0%
- Est. flood insurance / yr
- $507 – $1,088
Fire risk 1/10 · Minimal
- Est. fire insurance / yr
- $1,269 – $2,357
Heat risk 8/10 · Major
- Hot days now (above 108°F)
- 7 days/yr
- Hot days in 30 yrs
- 21 days/yr
Wind risk 9/10 · Severe
- Chance of severe wind over 30 yrs
- 99.0%
Air-quality risk 3/10 · Minor
- Unhealthy air days now
- 2 days/yr
- Unhealthy air days in 30 yrs
- 3 days/yr
Risk factors via First Street. Map © Google.
Why this score? — see what drove the D+ grade
The composite is a weighted blend of 9 inputs, each scored 0–100. Each bar is that input's sub-score; the figure is the points it added to the 100-point composite (weight × sub-score).
- ARV discount +15.0/15.0
- Cash flow +13.6/30.0
- DSCR +4.1/10.0
- Livability +3.7/5.0
- 1% rule +3.4/10.0
- Rent growth +3.0/5.0
- Condition / age +2.5/5.0
- Schools +2.4/10.0
- Appreciation +0.0/10.0
$250,895
🖨 Deal sheet (PDF) 📄 Offer letter ✓ Due diligence
Listing remarks MLS
Beautiful home great floor plan. Lots of room to redecorate. Is very quiet neighborhood. Home been maintained awesomely by owners. Total new paint inside and out, new room and some siding, dead end streets, close to schools and shopping
Key facts
- 0.86 acre lot
- Garage
- Built 1989
Property features AI
Finance
- Other: Subdivision: Pin Oak; Directions available
- HOA & community: Homeowners association present
Exterior
- Parking: Garage (2 parking spaces total)
- Utilities: Public water; Public sewer; Cable connected
- Home design: Detached single-family residence; Residential property
- Construction: Cement siding; Slab foundation; Built construction year not provided
- Exterior features: Wood fencing; Frontage approximately 40 feet; Lot dimensions 40 x 127; Lot area about 0.86 acres
Interior
- Kitchen: Range; Oven; Electric cooktop; Dishwasher; Disposal; Refrigerator; Range hood; Stainless steel appliances
- Flooring: Tile; Ceramic tile
- Bathrooms: 2 full bathrooms; 1 partial bathroom
- Heating & cooling: Central heating; Central air; Ceiling fans
- Interior features: Walk-in closets; Crown molding; High ceilings; Masonry fireplace
- Laundry & utility: Washer hookup; Electric dryer hookup; Electric water heater
Neighborhood map
What this means for you Summary
Snapshot
- This is a 4-bed/2.5-bath single-family listed at $251k.
Deal economics
- At list price, monthly cash flow is $13 ($153/yr) — positive.
- The deal already cash-flows at list — no discount required.
- To meet the 1% rule (rent ≥ 1% of price), the offer needs to be $211k (15.9% below list).
- Recommended offer: $211k (15.9% below list) — sets the bar for 1% rule.
- Cap rate 6.4% vs local median 4.4% in Old Jefferson — top-decile yield for the area; either an underpriced asset or a hidden risk that comps aren't pricing in. Stress-test before assuming the spread holds.
Location & tenants
- Location reads 73/100 on livability (#36 in LA) — a middle-class / working-renter tenant base. Strengths: housing A+, employment A, cost of living A; Watch: amenities F, commute F.
- East Baton Rouge Parish (urban): math 22% / reading 34% proficiency, ranked #47 of 98 in LA (top 48%) — low school quality limits family demand, transient renter base, plan for 1-2y turnover; 77% free/reduced lunch — lower-income household profile, screen leases tightly.
- Zoned schools: Woodlawn Elementary (math 37% / reading 56%, grade D-, #159 of 646 statewide, top 25%, 718 students, 65% FRL); Woodlawn Middle School (math 20% / reading 39%, grade F, #116 of 218 statewide, top 53%, 887 students, 69% FRL); Woodlawn High School (math 25% / reading 30%, grade F, #133 of 265 statewide, top 51%, 1,527 students, 62% FRL).
- Market conditions: Rents rising (+2.0%/yr); 361 active listings in the ZIP; 12 comparable units currently listed for rent nearby; rentals lingering (median 46d on market — plan ~5-8 weeks vacancy on turnover, expect pricing pressure); 50% of comp listings sitting > 30 days — soft ceiling on asking rent; solid renter incomes; 2,252 units permitted in East Baton Rouge Parish in 2024 (440 in 5+ unit buildings).
Forward outlook
- Local home prices are declining (-3.0%/yr); year-one equity from $2k of loan paydown is wiped out by about $8k of value loss. Plan a longer hold.
- East Baton Rouge County population projected at +4% by 2050 — modest demand growth; plan on rents tracking national, not racing it.
Negotiation context
- It's been on market 56 days — a 3% lower offer ($243k) is reasonable based on typical stale-listing flexibility.
- 11 sale attempts since 27y ago with the ask held roughly flat each time — persistent listings suggest the price (not the market) is what's stuck; bring a comps-based counter.
- Current owner paid $118k; list at $251k implies a 113% gain — meaningful room to come down on a strong offer.
Risks & watch-outs
- Climate carrying-cost: severe wind risk, 99% chance of damaging wind over 30y; extreme-heat days projected 7→21/yr by 2055 (HVAC capex compounding) — expect insurance premiums to compound above CPI over the hold.
Questions for the listing agent
- It's been on market 56 days. Have you received any prior offers? Is the seller open to a 16% concession, seller financing, or rate buy-down credit?
- Is there a deadline driving the sale (1031 exchange, divorce, estate, relocation)? That informs how much negotiation room exists.
- Schools are A-rated — typically a magnet for longer-tenancy family renters. What's the average tenant stay here, and is there a school-zone premium baked into asking?
- The area grade is low — what's the realistic commute time and amenity access for the typical tenant pool here? Any planned neighborhood developments (good or bad) we should know about?
- What's the average days-on-market for RENTAL listings here right now (not sales)? A rising rental-DOM trend means longer vacancies and softer asking-rent achievability than the comps imply.
- What's the recent tenant-quality profile in this submarket — average credit score on applications, eviction rate, late-payment / NSF rate, and stable-employment percentage? A property-management company in the area should have these aggregated.
- How much new for-sale + rental construction is in the pipeline within 1–3 miles? Heavy new supply typically softens prices + rents 12–24 months out; constrained supply supports both.
Investment metrics
- 1% rule
- 0.84% ✗
- Cap rate
- 6.35%
- Cash-on-cash
- 0.22%
- DSCR
- 1.01
- GRM
- 9.9
CMA / ARV
- ARV (on-the-fly)
- $333,944
- Comps found
- 12
Show comp detail 12 sales within ~0.75 mi
| Address | Dist | Beds/Ba | Sqft | Sold | Price | $/sf | Match |
|---|---|---|---|---|---|---|---|
| 9504 Country Lake Dr | 0.69mi | 4/2.0 | 1,980 (+0%) | 1mo | $319,000 | $161 | 64 |
| 9145 Smoke Rock Dr | 0.26mi | 4/2.5 | 2,177 (+10%) | 9mo | $375,000 | $172 | 63 |
| 17746 Waterloo Dr | 0.73mi | 4/2.0 | 2,021 (+2%) | 2mo | $340,000 | $168 | 59 |
| 16815 Wenwood Dr | 0.53mi | 4/2.5 | 2,155 (+9%) | 5mo | $379,000 | $176 | 56 |
| 16632 Highland Club Ave | 0.54mi | 3/2.0 (-1) | 2,076 (+5%) | 6mo | $349,900 | $169 | 54 |
| 17525 Waterloo Dr | 0.67mi | 4/2.0 | 2,253 (+14%) | 4mo | $335,000 | $149 | 40 |
| 8966 Falling Oak Dr | 0.52mi | 3/2.0 (-1) | 1,707 (-14%) | 7mo | $300,000 | $176 | 40 |
| 17475 Waterloo Dr | 0.62mi | 3/2.0 (-1) | 1,689 (-14%) | 1mo | $275,000 | $163 | 39 |
| 17499 Waterloo Dr | 0.65mi | 4/2.0 | 2,239 (+13%) | 8mo | $338,000 | $151 | 39 |
| 17483 Waterloo Dr | 0.63mi | 3/2.0 (-1) | 1,689 (-14%) | 3mo | $302,000 | $179 | 37 |
| 9311 Falling Oak Dr | 0.68mi | 3/2.0 (-1) | 1,689 (-14%) | 2mo | $285,000 | $169 | 36 |
| 9329 Falling Oak Dr | 0.71mi | 3/2.0 (-1) | 1,708 (-14%) | 9mo | $284,900 | $167 | 30 |
Match score weights: distance 35% · size 25% · config 20% · recency 20%. Top-matched comps best support the ARV.
Projected returns pro-forma
-3.0% appreciation · 2.05% rent growth · sell at horizon
- IRR
- -17.0%
- Equity multiple
- 0.40×
- Total profit
- $-41,861
- Equity at exit
- $37,409
- IRR
- -10.7%
- Equity multiple
- 0.38×
- Total profit
- $-43,521
- Equity at exit
- $21,693
Cash invested: $70,251 (down + closing). Projections, not guarantees.
Landlord ↔ Tenant lean methodology
- Overall (STATE)
- 90 Strongly Landlord-Friendly
- State Louisiana
- 90 Strongly Landlord-Friendly · R+12
- County
- — inherits STATE
- City
- — inherits STATE
ZIP-level market 70817
- Rents YoY
- 2.0%
- Active inventory
- 361
- Price-to-rent
- 9.9×
Monthly cashflow live
- Estimated rent
- $2,110 high interval (Pro) →
- Mortgage (P&I)
- −$1,316
- Tax from tax record
- −$234 /mo · $2,803/yr
- Insurance
- −$105
- HOA
- −$0
- Vacancy / Maint / Mgmt
- −$443
- Net cashflow
- $13
Break-even live
Sensitivity live
| Price | -10% $155 | -5% $84 | +0% $13 | +5% $-58 | +10% $-129 |
|---|---|---|---|---|---|
| Rent | -10% $-154 | -5% $-71 | +0% $13 | +5% $96 | +10% $179 |
| Rate | -1.0pp $139 | -0.5pp $77 | base $13 | +0.5pp $-52 | +1.0pp $-118 |
UW: 25.0% down · 7.5% · 30yr · 1.5% tax · 5.0% vac · 8.0% maint · 8.0% mgmt
Financing live
Cash to close
- Down payment
- $62,724
- Closing costs
- $7,527
- Reserves months
- —
- Total cash needed
- —
Loan-product check · same deal, 3 products live
Conventional
25% down · 7.5% · 30yr
- Down + closing
- —
- Monthly P&I
- —
- Monthly cashflow
- —
- DSCR
- —
- Eligible?
- —
Personal DTI + credit; lowest rate.
DSCR
20% down · 8.5% · 30yr
- Down + closing
- —
- Monthly P&I
- —
- Monthly cashflow
- —
- DSCR
- —
- Eligible?
- —
No personal income docs; deal must DSCR.
Hard money
10% down · 12.0% · 12mo
- Down + closing
- —
- Monthly P&I
- —
- Monthly cashflow
- —
- DSCR
- —
- Eligible?
- —
Short-term bridge; refi at stabilization.
Rent comps 12 comps
| Address | Beds | Baths | Sqft | Rent | $/sqft | DOM | Units | Dist |
|---|---|---|---|---|---|---|---|---|
| 9113 Alder Dr Baton Rouge, LA | 3.0 | 2.0 | 1327 | $1,700 | $1.28 | 25d | 1 | 0.18mi |
| 16333 Columns Way Baton Rouge, LA | 1.0–3.0 | 1.0–2.0 | 1036 | $2,050 | $1.98 | 16d | 41 | 0.47mi |
| 16632 Highland Club Ave Baton Rouge, LA | 3.0 | 2.5 | 2076 | $2,400 | $1.16 | 45d | 1 | 0.51mi |
| 16124 Batavia Ave Baton Rouge, LA | 3.0 | 2.0 | 1417 | $1,700 | $1.20 | 45d | 1 | 0.85mi |
| 16523 Batavia Ave Baton Rouge, LA | 3.0 | 2.0 | 1600 | $1,725 | $1.08 | 45d | 1 | 0.88mi |
| 8040 S Hendrick Dr Baton Rouge, LA | 3.0 | 2.0 | 1618 | $2,025 | $1.25 | 45d | 1 | 0.99mi |
| 15616 Council Ave Baton Rouge, LA | 3.0 | 2.0 | 2163 | $2,200 | $1.02 | 16d | 1 | 1.00mi |
| 8049 S Hendrick Dr Baton Rouge, LA | 4.0 | 2.0 | 1601 | $2,095 | $1.31 | 45d | 1 | 1.02mi |
| 17653 Carlisle Ave Baton Rouge, LA | 4.0 | 2.0 | 1601 | $2,125 | $1.33 | 16d | 1 | 1.03mi |
| 7441 Quorum Dr Baton Rouge, LA | 4.0 | 2.0 | 1861 | $2,000 | $1.07 | 25d | 1 | 1.16mi |
| 16545 Antioch Ct Baton Rouge, LA | 3.0 | 2.0 | 2050 | $2,200 | $1.07 | 25d | 1 | 1.41mi |
| 16545 Antioch Ct Baton Rouge, LA | 3.0 | 2.0 | 2050 | $2,200 | $1.07 | 45d | 1 | 1.41mi |
Listing history 8 events
-
2026-06-22days on market $250,895 Active 56 DOM
-
2026-06-18days on market $250,895 Active 53 DOM
-
2026-06-17days on market $250,895 Active 52 DOM
-
2026-06-16days on market $250,895 Active 51 DOM
-
2026-06-15days on market $250,895 Active 50 DOM
-
2026-06-14days on market $250,895 Active 48 DOM
-
2026-06-10remarks 249-char remark
-
2026-06-10$250,895 Active 45 DOM
ⓘ Source: listings_history table (triggers on properties + properties_extension) + one-shot
backfill from property_details.listing_events for pre-trigger history.
Tax reassessment forecast LA · Resets to sale price
- Current annual tax
- $2,803 · $234/mo
- Projected year-2 tax
- $2,803 · $234/mo
- Expected delta
- $0/yr ($0/mo · 0.0%)
ⓘ Screening estimate from a state-policy table — verify with the county assessor before closing.
Climate risk First Street
- Flood 1/10 Low FEMA zone X · 0% chance over 30 yrs
- Wildfire 1/10 Low
- Heat 8/10 Severe 7 d/yr ≥108°F today · 21 d/yr by 30 yrs out
- Wind 9/10 Extreme 99% chance of damaging wind over 30 yrs
- Air quality 3/10 Moderate 2 unhealthy d/yr today · 3 by 30 yrs out
Nearby sold comps map
Loading sold comps map…
Walkable amenities ~0.75 mi
Loading nearby amenities…
Taxation est. · year 1
- Rental income
- $25,315
- − Mortgage interest
- −$14,054
- − Property taxes
- −$2,803
- − Insurance
- −$1,254
- − Repairs & maintenance
- −$2,025
- − Management
- −$2,025
- − Depreciation
- −$7,299
- Taxable loss
- −$4,146
- Est. tax savings @ 24.0%
- +$995
- After-tax cash flow
- $1,148/yr
For passive investors: Depreciation is non-cash, so a rental often shows a tax loss while cash-flowing — sheltering income. Rental losses are passive: they offset passive income freely, and up to $25,000/yr can offset ordinary (W-2) income if you actively participate and your MAGI is under $100k (phasing out to $0 by $150k); unused losses carry forward. On sale, claimed depreciation is recaptured at up to 25%, and gains may owe capital-gains tax (a 1031 exchange can defer both). Figures are a year-1 estimate at your 24.0% rate — not tax advice; consult a CPA.
Schools (NCES district)
- District
- East Baton Rouge Parish
- NCES district ID
- 2200540
- Math proficiency
- 22% ▼ -36.00%
- Reading proficiency
- 34% ▼ -31.00%
- Median HH income
- $46,263
- Composite
- 24.14/100
- National rank
- #7745
- State rank
- #47 of 98 in LA
Livability — Old Jefferson
- Score
- 73/100
- State rank
- #36
- US rank
- #5501
Category grades
Schools grade is shown separately in the Schools card above.
Census & demographics
- Census place
- Old Jefferson, LA
- County
- East Baton Rouge Parish · 399,686 people
- Metro
- Baton Rouge, LA
- Population (ZIP)
- 33,482
- Household income
- $102,639
- Rent vs Own
- Severe rent burden
- 755.0
Population outlook (East Baton Rouge County) Hauer SSP2
- Today (2025)
- 464,810 people
- By 2030
- 472,137 · +1.6%
- By 2040
- 480,243 · +3.3%
- By 2050
- 484,422 · +4.2%
- By 2075
- 492,069 · +5.9%
- By 2100
- 476,347 · +2.5%
Race, ethnicity, and origin ACS 2023
- Neighborhood character
- Majority White (64%)
- Race & ethnicity
- White 64% Black 21% Two or more races 9% Hispanic / Latino 5% Asian 3%
- Common ancestry
- Lithuanian 13% Italian 2% Serbian 2%
- Foreign-born
- 6% · Canada, Vietnam, China
- Languages at home
- 91% English-only · Spanish 3% Arabic 1% Vietnamese 1%
Political lean MEDSL · East Baton Rouge
- 2024 margin
- D (+11.1) · D 54.5% · R 43.4% · Other 2.1%
- 2008→2024 swing
- +8.9pp toward D · 2008: 2.2pp · 2024: 11.1pp
- All cycles
- 2024: D+11.1 2020: D+13.1 2016: D+9.2 2012: D+5.2 2008: D+2.2
Not yet ingested
- Civics
- —
Market trends
- HPI YoY
- ▼ -149.27%
- Current HPI
- 170.6826
- Rent YoY
- ▲ 2.05%
- Metro
- Baton Rouge, LA
- State GDP YoY
- ▲ 3.29%
- F500 in state
- 10
Industry mix (Fortune 500 HQ in LA)
| Industry | F500 HQs | Revenue |
|---|---|---|
| Telecommunications | 2 | $23B |
|
||
| Utilities | 1 | $12B |
|
||
| Wholesale / Distribution | 1 | $5B |
|
||
| Advertising | 1 | $2B |
|
||
Price history
+118.2% since first listed18 events — show timeline
- 2026-06-09 Price Changed $250,895 AcadianaMLS
- 2026-06-09 Price Changed $250,895 GBRMLS
- 2026-04-26 Listed $255,895 GBRMLS
- 2026-04-26 Listed $255,895 AcadianaMLS
- 2018-11-24 Sold (MLS) — GBRMLS
- 2018-06-23 Listed $1,500 GBRMLS
- 2012-05-15 Sold (Public Records) $118,000 Public Records
- 2004-08-28 Sold (MLS) — GBRMLS
- 2004-05-01 Listed $1,395 GBRMLS
- 2004-04-22 Listed $148,500 GBRMLS
- 2004-04-22 Listed $148,500 AcadianaMLS
- 2001-08-13 Listed $128,500 AcadianaMLS
- 2001-04-20 Listed $134,900 AcadianaMLS
- 2000-01-27 Listed $132,900 AcadianaMLS
- 1999-11-29 Sold (Public Records) — Public Records
- 1999-11-24 Sold (MLS) — GBRMLS
- 1999-08-30 Listed $115,000 AcadianaMLS
- 1999-08-30 Listed $115,000 GBRMLS
Property tax history
+7.1%/yrLatest (2025): $2,803 · -0.5% YoY. Source: county tax records.
Cash-flow waterfall
monthlySold comps — $/sqft
last 12 mo · ≤1 miLoading sold comps…