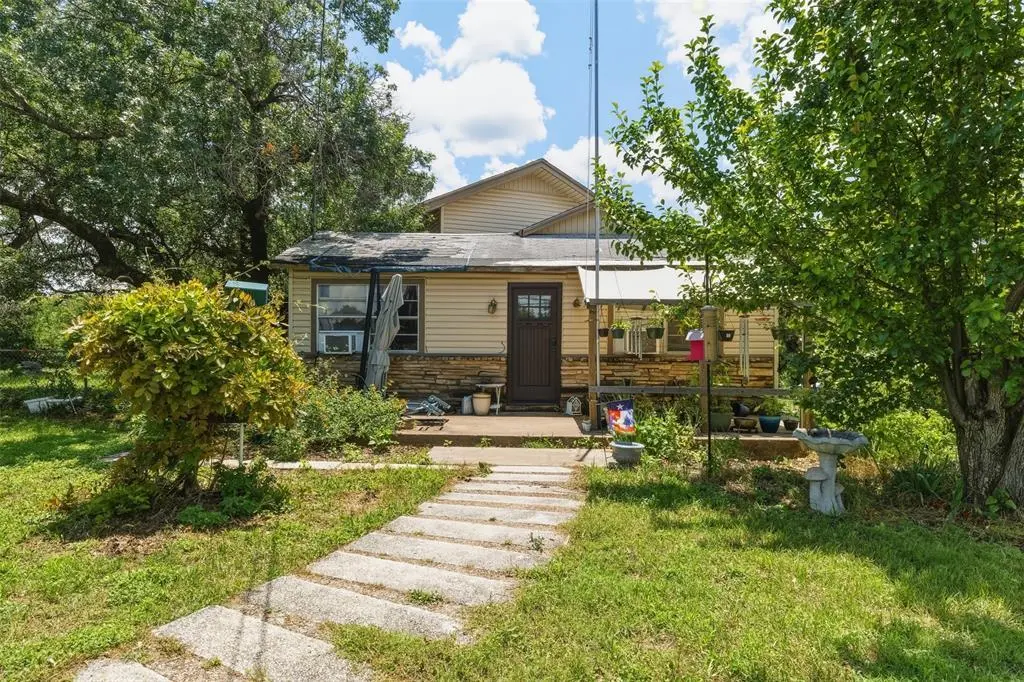
320 Beverly Rd · Azle, TX
Flood risk 1/10 · Minimal
- FEMA flood zone
- X (unshaded)
- Chance of flooding over 30 yrs
- 0.0%
- Est. flood insurance / yr
- $507 – $1,088
Fire risk 5/10 · Moderate
- Est. fire insurance / yr
- $1,222 – $2,270
Heat risk 7/10 · Major
- Hot days now (above 109°F)
- 7 days/yr
- Hot days in 30 yrs
- 22 days/yr
Wind risk 4/10 · Minor
- Chance of severe wind over 30 yrs
- 24.0%
Air-quality risk 2/10 · Minimal
- Unhealthy air days now
- 2 days/yr
- Unhealthy air days in 30 yrs
- 2 days/yr
Risk factors via First Street. Map © Google.
Why this score? — see what drove the B- grade
The composite is a weighted blend of 9 inputs, each scored 0–100. Each bar is that input's sub-score; the figure is the points it added to the 100-point composite (weight × sub-score).
- Cash flow +25.5/30.0
- ARV discount +15.0/15.0
- DSCR +8.4/10.0
- 1% rule +6.8/10.0
- Schools +3.6/10.0
- Livability +3.6/5.0
- Rent growth +3.1/5.0
- Condition / age +2.5/5.0
- Appreciation +0.0/10.0
$169,500
🖨 Deal sheet 📄 Offer letter ✓ Due diligence
Listing remarks
Located just minutes from beautiful Eagle Mountain Lake, this property is full of potential and ready for someone to make it their own! Sitting on a spacious . 38-acre lot in an established neighborhood, this 3-bedroom home offers approximately 1,767 sqft, a detached garage or shop space, and plenty of room to create your vision. The home does need some TLC, making it a great opportunity for an investor, DIY buyer, or anyone looking to add personal touches and build equity. Enjoy the peaceful charm of Azle living while staying close to the lake, local shopping, dining, and outdoor recreation. Property is being sold AS-IS. With great bones, extra space, and a hard-to-find lot size, this prop
Key facts
- Outdoor recreation
- Eagle mountain lake
- Spacious lot
Tags
Property features AI
Finance
- Other: Corner lot size approximately 0.384 acres; Subdivision: Castle Hills Estates
- HOA & community: No association
Exterior
- Parking: 1 covered space; 1 carport space; Driveway parking; On-street parking; Open parking
- Security: Security features unknown
- Utilities: City sewer; City water; Electricity available; Individual gas meter; Not in a municipal utility district
- Home design: Single-family residence; One and one-half story; Residential property
- Construction: Built in 1951; Asphalt/composition roof; Combination foundation with pillar/post/pier and slab elements
- Exterior features: Covered porch; Covered patio/porch; Chain link fencing; Corner, irregular lot
Interior
- Kitchen: Gas cooktop; Gas oven
- Bedrooms: 4 bedrooms total; Primary bedroom located on the second level (approx. 21 x 16)
- Flooring: Combination flooring
- Bathrooms: 1 full bathroom
- Heating & cooling: Ceiling fan(s); Window unit(s)
- Interior features: Built-in features; Cable TV available; Decorative lighting; Two living areas; One dining area; Total of 4 rooms
- Laundry & utility: Laundry in hall; Utility room; Gas water heater; Tankless water heater
Neighborhood map
What this means for you Summary
Snapshot
- This is a 3-bed/1.0-bath single-family listed at $170k.
Deal economics
- At list price, monthly cash flow is $395 ($5k/yr) — positive.
- The deal already cash-flows at list — no discount required.
- Meets the 1% rule at list price ($2k rent vs $170k).
- Recommended offer: $167k (1.5% below list) — sets the bar for market timing.
- Cap rate 9.1% vs local median 3.1% in Azle — top-decile yield for the area; either an underpriced asset or a hidden risk that comps aren't pricing in. Stress-test before assuming the spread holds.
Location & tenants
- Location reads 72/100 on livability (#267 in TX) — a middle-class / working-renter tenant base. Strengths: cost of living A+, housing A+, employment A; Watch: health & safety D+, amenities F, commute F.
- Azle ISD (suburban): math 37% / reading 43% proficiency, ranked #351 of 826 in TX (top 42%) — families likely to look elsewhere, expect single-tenant / working-renter base with shorter leases.
- Zoned schools: Eagle Heights El (math 47% / reading 37%, grade F, #1,335 of 4,322 statewide, top 33%, 459 students, 60% FRL) — zoned schools average 60% FRL vs 45% district-wide (15 pts higher); higher-poverty schools than district average — tighter screening recommended.
- Market conditions: Rents rising (+2.3%/yr); 591 active listings in the ZIP; 7 comparable units currently listed for rent nearby; rentals leasing fast (median 5d on market — plan ~1-2 weeks tenant-placement turnaround); solid renter incomes; 18,938 units permitted in Tarrant County in 2024 (8,336 in 5+ unit buildings).
Forward outlook
- Local home prices are declining (-3.0%/yr); year-one equity from $1k of loan paydown is wiped out by about $5k of value loss. Plan a longer hold.
- Tarrant County population projected at +41% by 2050 — long-run rental-demand tailwind backs the buy-and-hold thesis.
Negotiation context
- It's been on market 23 days — a 2% lower offer ($167k) is reasonable based on typical stale-listing flexibility.
Risks & watch-outs
- Watch-outs: built in 1951 — expect roof / HVAC / electrical / plumbing capex.
- Climate carrying-cost: moderate wildfire risk; extreme-heat days projected 7→22/yr by 2055 (HVAC capex compounding) — expect insurance premiums to compound above CPI over the hold.
Questions for the listing agent
- Built in 1951 — when were the roof, HVAC, electrical panel, plumbing, and water heater last replaced?
- Is there a deadline driving the sale (1031 exchange, divorce, estate, relocation)? That informs how much negotiation room exists.
- What's the average days-on-market for RENTAL listings here right now (not sales)? A rising rental-DOM trend means longer vacancies and softer asking-rent achievability than the comps imply.
- What's the recent tenant-quality profile in this submarket — average credit score on applications, eviction rate, late-payment / NSF rate, and stable-employment percentage? A property-management company in the area should have these aggregated.
- How much new for-sale + rental construction is in the pipeline within 1–3 miles? Heavy new supply typically softens prices + rents 12–24 months out; constrained supply supports both.
Investment metrics
- 1% rule
- 1.18% ✓
- Cap rate
- 9.09%
- Cash-on-cash
- 10.00%
- DSCR
- 1.44
- GRM
- 7.0
CMA / ARV
- ARV (on-the-fly)
- $291,275
- Comps found
- 12
Show comp detail 12 sales within ~0.75 mi
| Address | Dist | Beds/Ba | Sqft | Sold | Price | $/sf | Match |
|---|---|---|---|---|---|---|---|
| 209 Marquette Ave | 0.09mi | 3/1.0 | 1,530 (+0%) | 3mo | $243,000 | $159 | 93 |
| 1907 Live Oak Cir | 0.35mi | 4/2.5 (+1) | 1,551 (+2%) | 3mo | $300,000 | $193 | 67 |
| 432 Wilshire Ave | 0.18mi | 4/2.0 (+1) | 1,659 (+9%) | 4mo | $342,000 | $206 | 64 |
| 216 Marquette Ave | 0.06mi | 3/2.0 | 1,383 (-9%) | 17mo | $199,900 | $145 | 64 |
| 428 Wilshire Ave | 0.16mi | 4/2.0 (+1) | 1,659 (+9%) | 6mo | $338,500 | $204 | 64 |
| 730 Lakeside | 0.23mi | 2/1.0 (-1) | 1,422 (-7%) | 14mo | $130,000 | $91 | 62 |
| 208 Marquette Ave | 0.09mi | 3/2.0 | 1,299 (-15%) | 16mo | $177,000 | $136 | 53 |
| 11420 White Leaf Ct E | 0.72mi | 3/2.0 | 1,568 (+3%) | 13mo | $210,000 | $134 | 47 |
| 153 Avondale Ave | 0.68mi | 4/2.0 (+1) | 1,412 (-7%) | 2mo | $270,000 | $191 | 45 |
| 143 Brookshire Ave | 0.56mi | 3/2.0 | 1,329 (-13%) | 8mo | $178,500 | $134 | 42 |
| 1505 Bailey Dr | 0.52mi | 3/2.0 | 1,733 (+14%) | 10mo | $385,000 | $222 | 41 |
| 1405 Scotland Ave | 0.60mi | 3/2.0 | 1,322 (-13%) | 11mo | $290,000 | $219 | 37 |
Match score weights: distance 35% · size 25% · config 20% · recency 20%. Top-matched comps best support the ARV.
Projected returns pro-forma
-3.0% appreciation · 2.31% rent growth · sell at horizon
- IRR
- -2.0%
- Equity multiple
- 0.92×
- Total profit
- $-3,624
- Equity at exit
- $25,273
- IRR
- 6.9%
- Equity multiple
- 1.50×
- Total profit
- $23,843
- Equity at exit
- $14,655
Cash invested: $47,460 (down + closing). Projections, not guarantees.
Landlord ↔ Tenant lean methodology
- Overall (STATE)
- 87 Strongly Landlord-Friendly
- State Texas
- 87 Strongly Landlord-Friendly · R+5
- County
- — inherits STATE
- City
- — inherits STATE
ZIP-level market 76020
- Home prices YoY
- -20.6%
- Rents YoY
- 2.3%
- Active inventory
- 591
- Price-to-rent
- 7.0×
Monthly cashflow live
- Estimated rent
- $2,007 high interval (Pro) →
- Mortgage (P&I)
- −$889
- Tax from tax record
- −$230 /mo · $2,763/yr
- Insurance
- −$71
- HOA
- −$0
- Vacancy / Maint / Mgmt
- −$421
- Net cashflow
- $395
Break-even live
UW: 25.0% down · 7.5% · 30yr · 1.5% tax · 5.0% vac · 8.0% maint · 8.0% mgmt
Financing live
Cash to close
- Down payment
- $42,375
- Closing costs
- $5,085
- Reserves months
- —
- Total cash needed
- —
Loan-product check · same deal, 3 products live
Conventional
25% down · 7.5% · 30yr
- Down + closing
- —
- Monthly P&I
- —
- Monthly cashflow
- —
- DSCR
- —
- Eligible?
- —
Personal DTI + credit; lowest rate.
DSCR
20% down · 8.5% · 30yr
- Down + closing
- —
- Monthly P&I
- —
- Monthly cashflow
- —
- DSCR
- —
- Eligible?
- —
No personal income docs; deal must DSCR.
Hard money
10% down · 12.0% · 12mo
- Down + closing
- —
- Monthly P&I
- —
- Monthly cashflow
- —
- DSCR
- —
- Eligible?
- —
Short-term bridge; refi at stabilization.
Rent comps 7 comps
| Address | Beds | Baths | Sqft | Rent | $/sqft | DOM | Units | Dist |
|---|---|---|---|---|---|---|---|---|
| 1712 Florence Dr Azle, TX | 3.0 | 1.0 | 1200 | $1,900 | $1.58 | 1d | 1 | 0.20mi |
| 1310 Southeast Pkwy Unit 817 Azle, TX | 2.0 | 2.0 | 1136 | $1,499 | $1.32 | 5d | 1 | 0.79mi |
| 1200 Southeast Pkwy Azle, TX | 1.0–2.0 | 1.0–2.0 | 1067 | $2,280 | $2.14 | 1d | 22 | 0.81mi |
| 413 Glenhaven Dr Azle, TX | 4.0 | 2.0 | 1824 | $2,150 | $1.18 | 24d | 1 | 1.12mi |
| 1005 Idlewood Ave Azle, TX | 3.0 | 3.0 | 1456 | $1,899 | $1.30 | 24d | 1 | 1.32mi |
| 120 Glenhaven Dr Azle, TX | 4.0 | 3.0 | 1553 | $1,950 | $1.26 | 4d | 1 | 1.34mi |
| 101 Glenhaven Dr Azle, TX | 3.0 | 2.0 | 1534 | $1,825 | $1.19 | 19d | 1 | 1.36mi |
Listing history 19 events
-
2026-06-18days on market $169,500 Active 23 DOM
-
2026-06-17days on market $169,500 Active 22 DOM
-
2026-06-16days on market $169,500 Active 21 DOM
-
2026-06-15price $169,500 Active 20 DOM
-
2026-06-15days on market $170,000 Active 20 DOM
-
2026-06-13days on market $170,000 Active 18 DOM
-
2026-06-13days on market $170,000 Active 17 DOM
-
2026-06-09days on market $170,000 Active 14 DOM
-
2026-06-08pricedays on market $170,000 Active 13 DOM
-
2026-06-07days on market $180,000 Active 12 DOM
-
2026-06-04days on market $180,000 Active 9 DOM
-
2026-06-03days on market $180,000 Active 8 DOM
-
2026-06-02days on market $180,000 Active 7 DOM
-
2026-06-01days on market $180,000 Active 6 DOM
-
2026-05-31days on market $180,000 Active 5 DOM
-
2026-05-26$180,000 Active
-
2017-05-08soldstatus
-
2013-06-13soldstatus
-
2013-05-31soldstatus
ⓘ Source: listings_history table (triggers on properties + properties_extension) + one-shot
backfill from property_details.listing_events for pre-trigger history.
Tax reassessment forecast TX · Resets to sale price
- Current annual tax
- $2,763 · $230/mo
- Projected year-2 tax
- $3,102 · $258/mo
- Expected delta
- +$339/yr (+$28/mo · 12.3%)
ⓘ Screening estimate from a state-policy table — verify with the county assessor before closing.
Climate risk First Street
- Flood 1/10 Low FEMA zone X (unshaded) · 0% chance over 30 yrs
- Wildfire 5/10 Major
- Heat 7/10 Severe 7 d/yr ≥109°F today · 22 d/yr by 30 yrs out
- Wind 4/10 Moderate 24% chance of damaging wind over 30 yrs
- Air quality 2/10 Low 2 unhealthy d/yr today · 2 by 30 yrs out
Nearby sold comps map
Loading sold comps map…
Walkable amenities ~0.75 mi
Loading nearby amenities…
Taxation est. · year 1
- Rental income
- $24,079
- − Mortgage interest
- −$9,495
- − Property taxes
- −$2,763
- − Insurance
- −$848
- − Repairs & maintenance
- −$1,926
- − Management
- −$1,926
- − Depreciation
- −$4,931
- Taxable income
- $2,190
- Est. tax owed @ 24.0%
- −$526
- After-tax cash flow
- $4,219/yr
For passive investors: Depreciation is non-cash, so a rental often shows a tax loss while cash-flowing — sheltering income. Rental losses are passive: they offset passive income freely, and up to $25,000/yr can offset ordinary (W-2) income if you actively participate and your MAGI is under $100k (phasing out to $0 by $150k); unused losses carry forward. On sale, claimed depreciation is recaptured at up to 25%, and gains may owe capital-gains tax (a 1031 exchange can defer both). Figures are a year-1 estimate at your 24.0% rate — not tax advice; consult a CPA.
Schools (NCES district)
- District
- Azle ISD
- NCES district ID
- 4809200
- Math proficiency
- 37% ▼ -11.00%
- Reading proficiency
- 43% ▼ -5.00%
- Median HH income
- $61,473
- Composite
- 35.57/100
- National rank
- #4900
- State rank
- #351 of 826 in TX
Livability — Azle
- Score
- 72/100
- State rank
- #267
- US rank
- #6239
Category grades
Schools grade is shown separately in the Schools card above.
Census & demographics
- Census place
- Azle, TX
- County
- Parker County · 144,797 people
- City population
- 34,602
- Metro
- Dallas-Fort Worth-Arlington, TX
- Population (ZIP)
- 34,602
- Household income
- $87,298
- Rent vs Own
- Severe rent burden
- 433.0
Population outlook (Tarrant County) Hauer SSP2
- Today (2025)
- 2,380,417 people
- By 2030
- 2,578,900 · +8.3%
- By 2040
- 2,974,995 · +25.0%
- By 2050
- 3,350,489 · +40.8%
- By 2075
- 4,216,909 · +77.2%
- By 2100
- 4,741,527 · +99.2%
Race, ethnicity, and origin ACS 2023
- Neighborhood character
- Predominantly White (78%)
- Race & ethnicity
- White 78% Hispanic / Latino 18% Two or more races 9% Black 1%
- Hispanic origin (detail)
- Mexican 15%
- Common ancestry
- Slovak 2% Italian 1% Portuguese 1%
- Foreign-born
- 5% · Canada
- Languages at home
- 89% English-only · Spanish 11%
Political lean MEDSL · Tarrant
- 2024 margin
- Lean R (+5.1) · D 46.7% · R 51.9% · Other 1.4%
- 2008→2024 swing
- +6.6pp toward D · 2008: -11.7pp · 2024: -5.1pp
- All cycles
- 2024: R+5.1 2020: D+0.2 2016: R+8.7 2012: R+15.7 2008: R+11.7
Not yet ingested
- Civics
- —
Market trends
- HPI YoY
- ▼ -74.72%
- Current HPI
- 287.155
- Rent YoY
- ▲ 2.31%
- Metro
- Dallas-Fort Worth-Arlington, TX
- State GDP YoY
- ▲ 3.95%
- F500 in state
- 110
Industry mix (Fortune 500 HQ in TX)
| Industry | F500 HQs | Revenue |
|---|---|---|
| Energy | 16 | $1,198B |
|
||
| Technology | 5 | $198B |
|
||
| Engineering / Construction | 4 | $72B |
|
||
| Energy Services | 3 | $60B |
|
||
| Utilities | 3 | $41B |
|
||
| Healthcare | 2 | $330B |
|
||
Price history
4 events — show timeline
- 2026-05-26 Listed $180,000 NTREIS
- 2017-05-08 Sold (Public Records) — Public Records
- 2013-06-13 Sold (Public Records) — Public Records
- 2013-05-31 Sold (Public Records) — Public Records
Property tax history
+4.8%/yrLatest (2025): $2,763 · +8.9% YoY. Source: county tax records.
Cash-flow waterfall
monthlySold comps — $/sqft
last 12 mo · ≤1 miLoading sold comps…