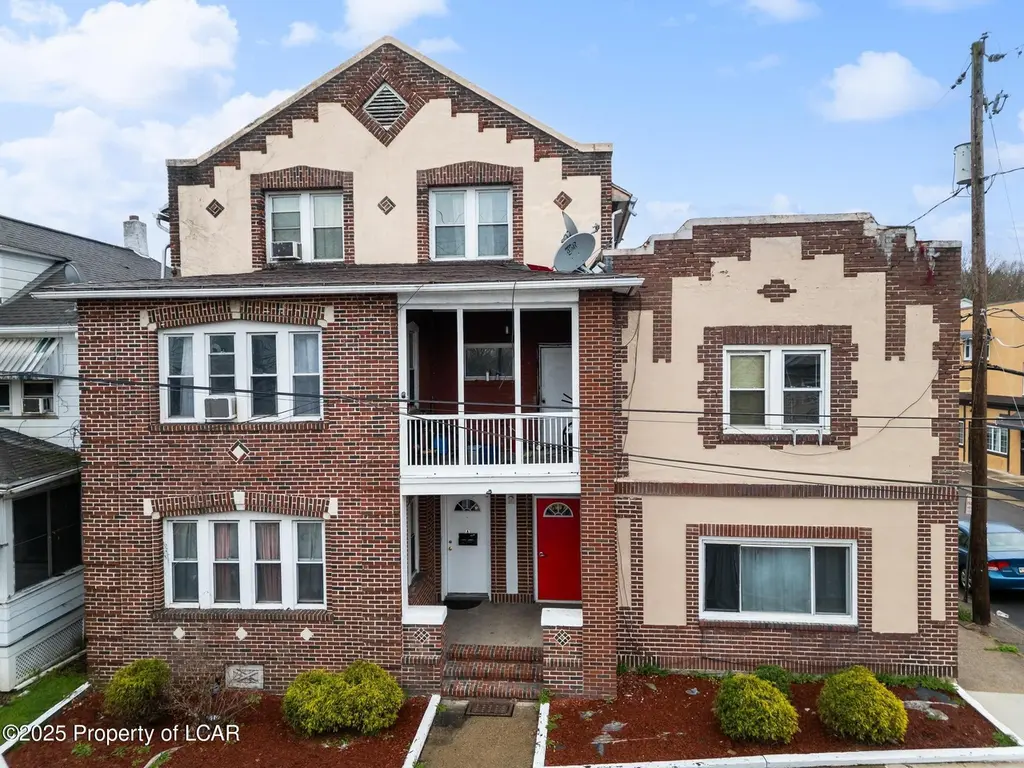
 7-Plex
1210 1212 Main St · Hanover, PA
Flood risk 3/10 · Minor
- FEMA flood zone
- X (unshaded)
- Chance of flooding over 30 yrs
- 0.2%
- Est. flood insurance / yr
- $507 – $1,088
Fire risk 1/10 · Minimal
- Est. fire insurance / yr
- $511 – $949
Heat risk 4/10 · Minor
- Hot days now (above 94°F)
- 7 days/yr
- Hot days in 30 yrs
- 16 days/yr
Wind risk 3/10 · Minor
- Chance of severe wind over 30 yrs
- 4.0%
Air-quality risk 2/10 · Minimal
- Unhealthy air days now
- 1 days/yr
- Unhealthy air days in 30 yrs
- 2 days/yr
Risk factors via First Street. Map © Google.
Why this score? — see what drove the B- grade
The composite is a weighted blend of 9 inputs, each scored 0–100. Each bar is that input's sub-score; the figure is the points it added to the 100-point composite (weight × sub-score).
- Cash flow +30.0/30.0
- DSCR +10.0/10.0
- 1% rule +8.2/10.0
- ARV discount +7.5/15.0
- Livability +3.8/5.0
- Rent growth +2.5/5.0
- Condition / age +2.5/5.0
- Schools +1.9/10.0
- Appreciation +0.0/10.0
$690,000
🖨 Deal sheet 📄 Offer letter ✓ Due diligence
Multi-family units
County records classify this as Multi-Family (5+ Unit). Listing-text estimate: 7 units. confirmed
5+ unit building — per-unit beds/baths from public records are typically unavailable; the breakdown below (if shown) is an estimate from the listing text.
Listing remarks MLS
Strong Asset. High Yield. 7 unit With an 9% CAP rate, the math is simple: steady cash flow and long-term appreciation in a high-demand market. Clean numbers, separate electric, and immediate equity. Secure this cornerstone for your portfolio today. Serious investors only. Reach out to discuss the rent roll and schedule a walkthrough. 48 Hours notice required. Property Sold AS IS
Key facts
- Cash flow addition
- Off-street parking
- 6,050 sq ft lot
Tags
Neighborhood map
What this means for you Summary
Snapshot
- This is a 7 × 2-bed/1.0-bath units multifamily listed at $690k.
Deal economics
- At list price, monthly cash flow is $3k ($34k/yr) — positive. Per door: $403/mo.
- The deal already cash-flows at list — no discount required.
- Meets the 1% rule at list price ($9k rent vs $690k).
- Recommended offer: $669k (3.0% below list) — sets the bar for market timing.
- Cap rate 11.2% vs local median 3.9% in Hanover — top-decile yield for the area; either an underpriced asset or a hidden risk that comps aren't pricing in. Stress-test before assuming the spread holds.
Location & tenants
- Location reads 76/100 on livability (#373 in PA, #3,295 nationally) — a middle-class / working-renter tenant base. Strengths: cost of living A+, housing A+, health & safety A+; Watch: amenities C-, employment D, commute F.
- Hanover Area SD (suburban): math 19% / reading 25% proficiency, ranked #484 of 539 in PA (top 90%) — low school quality limits family demand, transient renter base, plan for 1-2y turnover.
- Market conditions: 81 active listings in the ZIP; 349 units permitted in Luzerne County in 2024 (16 in 5+ unit buildings).
- At $9,077/mo this rent would consume 186% of the median local household income ($59k/yr) (locally 568% of renters already pay >50% of income on rent) — very limited rent-growth headroom before tenants either downsize or default.
Forward outlook
- Local home prices are declining (-3.0%/yr); year-one equity from $5k of loan paydown is wiped out by about $21k of value loss. Plan a longer hold.
- Luzerne County population projected at +4% by 2050 — modest demand growth; plan on rents tracking national, not racing it.
- At projected returns (-3.0% appreciation + 3.0% rent growth), your $193k cash investment doubles in ~7 years — after that, you're playing with house money.
Negotiation context
- It's been on market 38 days — a 3% lower offer ($669k) is reasonable based on typical stale-listing flexibility.
- 6 sale attempts since 17y ago with the ask held roughly flat each time — persistent listings suggest the price (not the market) is what's stuck; bring a comps-based counter.
- Current owner paid $95k; list at $690k implies a 626% gain — meaningful room to come down on a strong offer.
Questions for the listing agent
- It's been on market 38 days. Have you received any prior offers? Is the seller open to a 3% concession, seller financing, or rate buy-down credit?
- Can we see the unit-by-unit rent roll, current vacancy, and any below-market leases? What's the average tenancy length?
- What capital expenditures (roof, boiler, parking lot, exteriors) have been made in the last 5 years, and what's planned in the next 2?
- Built in 1960 — when were the roof, HVAC, electrical panel, plumbing, and water heater last replaced?
- Is there a deadline driving the sale (1031 exchange, divorce, estate, relocation)? That informs how much negotiation room exists.
- What's the average days-on-market for RENTAL listings here right now (not sales)? A rising rental-DOM trend means longer vacancies and softer asking-rent achievability than the comps imply.
- What's the recent tenant-quality profile in this submarket — average credit score on applications, eviction rate, late-payment / NSF rate, and stable-employment percentage? A property-management company in the area should have these aggregated.
- How much new apartment / multifamily construction is in the pipeline within 1–3 miles? Heavy new supply (>2% of stock underway) typically softens rents 12–24 months out; light construction supports rent growth.
Investment metrics
- 1% rule
- 1.32% ✓
- Cap rate
- 11.20%
- Cash-on-cash
- 17.51%
- DSCR
- 1.78
- GRM
- 6.3
CMA / ARV
- ARV (median comp)
- $436,564
- List price
- $690,000
- Delta
- 58.05%
- Verdict
- OVERPRICED
- Comps
- 4 within 1.0 mi
Projected returns pro-forma
-3.0% appreciation · 3.0% rent growth · sell at horizon
- IRR
- 8.9%
- Equity multiple
- 1.35×
- Total profit
- $67,640
- Equity at exit
- $102,881
- IRR
- 18.1%
- Equity multiple
- 2.50×
- Total profit
- $289,639
- Equity at exit
- $59,659
Cash invested: $193,200 (down + closing). Projections, not guarantees.
Landlord ↔ Tenant lean methodology
- Overall (STATE)
- 62 Landlord-Friendly
- State Pennsylvania
- 62 Landlord-Friendly · EVEN
- County
- — inherits STATE
- City
- — inherits STATE
ZIP-level market 18706
- Active inventory
- 81
- Price-to-rent
- 44.3×
Monthly cashflow live
- Estimated rent
- $9,077 high interval (Pro) →
- Mortgage (P&I)
- −$3,618
- Tax from tax record
- −$445 /mo · $5,346/yr
- Insurance
- −$288
- HOA
- −$0
- Vacancy / Maint / Mgmt
- −$1,906
- Net cashflow
- $2,819
Break-even live
7-unit breakdown (identical units grouped — click to expand)
| Units | Beds | Baths | Est. rent |
|---|---|---|---|
| 7× units | 2 | 1 | $9,079 |
| #1 | 2 | 1 | $1,297 |
| #2 | 2 | 1 | $1,297 |
| #3 | 2 | 1 | $1,297 |
| #4 | 2 | 1 | $1,297 |
| #5 | 2 | 1 | $1,297 |
| #6 | 2 | 1 | $1,297 |
| #7 | 2 | 1 | $1,297 |
| Total (7 units) | $9,077 | ||
UW: 25.0% down · 7.5% · 30yr · 1.5% tax · 5.0% vac · 8.0% maint · 8.0% mgmt
Financing live
Cash to close
- Down payment
- $172,500
- Closing costs
- $20,700
- Reserves months
- —
- Total cash needed
- —
Loan-product check · same deal, 3 products live
Conventional
25% down · 7.5% · 30yr
- Down + closing
- —
- Monthly P&I
- —
- Monthly cashflow
- —
- DSCR
- —
- Eligible?
- —
Personal DTI + credit; lowest rate.
DSCR
20% down · 8.5% · 30yr
- Down + closing
- —
- Monthly P&I
- —
- Monthly cashflow
- —
- DSCR
- —
- Eligible?
- —
No personal income docs; deal must DSCR.
Hard money
10% down · 12.0% · 12mo
- Down + closing
- —
- Monthly P&I
- —
- Monthly cashflow
- —
- DSCR
- —
- Eligible?
- —
Short-term bridge; refi at stabilization.
Listing history 26 events
-
2026-06-18days on market $690,000 Active 38 DOM
-
2026-06-17days on market $690,000 Active 37 DOM
-
2026-06-16days on market $690,000 Active 36 DOM
-
2026-06-15days on market $690,000 Active 35 DOM
-
2026-06-14days on market $690,000 Active 33 DOM
-
2026-06-13days on market $690,000 Active 32 DOM
-
2026-06-10days on market $690,000 Active 30 DOM
-
2026-06-09days on market $690,000 Active 29 DOM
-
2026-06-08days on market $690,000 Active 28 DOM
-
2026-06-07days on market $690,000 Active 27 DOM
-
2026-06-02days on market $690,000 Active 22 DOM
-
2026-06-01days on market $690,000 Active 21 DOM
-
2026-05-31days on market $690,000 Active 20 DOM
-
2026-05-30days on market $690,000 Active 19 DOM
-
2026-05-11$690,000 Active 381-char remark
Show marketing remark (381 chars)
Strong Asset. High Yield. 7 unit With an 9% CAP rate, the math is simple: steady cash flow and long-term appreciation in a high-demand market. Clean numbers, separate electric, and immediate equity. Secure this cornerstone for your portfolio today. Serious investors only. Reach out to discuss the rent roll and schedule a walkthrough. 48 Hours notice required. Property Sold AS IS
-
2026-05-09historical $1,000
-
2026-04-17historical $1,000
-
2026-03-26$1,000
-
2026-02-18$1,500
-
2025-11-15historical
-
2025-04-15price $690,000
-
2023-12-12historical $850
-
2023-12-01$850
-
2020-11-17$399,900
-
2015-01-20soldstatus $95,000
-
2009-11-15$249,900
ⓘ Source: listings_history table (triggers on properties + properties_extension) + one-shot
backfill from property_details.listing_events for pre-trigger history.
Tax reassessment forecast PA · Partial reset (capped growth)
- Current annual tax
- $5,346 · $445/mo
- Projected year-2 tax
- $8,124 · $677/mo
- Expected delta
- +$2,778/yr (+$232/mo · 52.0%)
ⓘ Screening estimate from a state-policy table — verify with the county assessor before closing.
Climate risk First Street
- Flood 3/10 Moderate FEMA zone X (unshaded) · 20% chance over 30 yrs
- Wildfire 1/10 Low
- Heat 4/10 Moderate 7 d/yr ≥94°F today · 16 d/yr by 30 yrs out
- Wind 3/10 Moderate 4% chance of damaging wind over 30 yrs
- Air quality 2/10 Low 1 unhealthy d/yr today · 2 by 30 yrs out
Nearby sold comps map
Loading sold comps map…
Walkable amenities ~0.75 mi
Loading nearby amenities…
Taxation est. · year 1
- Rental income
- $108,924
- − Mortgage interest
- −$38,651
- − Property taxes
- −$5,346
- − Insurance
- −$3,450
- − Repairs & maintenance
- −$8,714
- − Management
- −$8,714
- − Depreciation
- −$20,073
- Taxable income
- $23,977
- Est. tax owed @ 24.0%
- −$5,754
- After-tax cash flow
- $28,078/yr
For passive investors: Depreciation is non-cash, so a rental often shows a tax loss while cash-flowing — sheltering income. Rental losses are passive: they offset passive income freely, and up to $25,000/yr can offset ordinary (W-2) income if you actively participate and your MAGI is under $100k (phasing out to $0 by $150k); unused losses carry forward. On sale, claimed depreciation is recaptured at up to 25%, and gains may owe capital-gains tax (a 1031 exchange can defer both). Figures are a year-1 estimate at your 24.0% rate — not tax advice; consult a CPA.
Schools (NCES district)
- District
- Hanover Area SD
- NCES district ID
- 4211420
- Math proficiency
- 19% ▼ -3.00%
- Reading proficiency
- 25% ▼ -21.00%
- Median HH income
- $40,015
- Composite
- 18.6/100
- National rank
- #8903
- State rank
- #484 of 539 in PA
Livability — Hanover
- Score
- 76/100
- State rank
- #373
- US rank
- #3295
Category grades
Schools grade is shown separately in the Schools card above.
Census & demographics
- County
- Luzerne County · 118,885 people
- City population
- 56,443
- Metro
- Scranton--Wilkes-Barre, PA
- Population (ZIP)
- 16,387
- Household income
- $58,558
- Rent vs Own
- Severe rent burden
- 568.0
Population outlook (Luzerne County) Hauer SSP2
- Today (2025)
- 319,505 people
- By 2030
- 319,943 · +0.1%
- By 2040
- 322,643 · +1.0%
- By 2050
- 330,817 · +3.5%
- By 2075
- 379,145 · +18.7%
- By 2100
- 431,908 · +35.2%
Race, ethnicity, and origin ACS 2023
- Neighborhood character
- Predominantly White (76%)
- Race & ethnicity
- White 76% Hispanic / Latino 17% Two or more races 11% Black 3%
- Hispanic origin (detail)
- Puerto Rican 9% Dominican 4%
- Common ancestry
- Romanian 18% Scotch-Irish 3% Subsaharan African 1%
- Foreign-born
- 6% · Canada
- Languages at home
- 88% English-only · Spanish 10% Other Asian/Pacific 1%
Political lean MEDSL · Luzerne
- 2024 margin
- R (+19.2) · D 40.0% · R 59.2%
- 2008→2024 swing
- -27.6pp toward R · 2008: 8.4pp · 2024: -19.2pp
- All cycles
- 2024: R+19.2 2020: R+14.4 2016: R+19.6 2012: D+4.8 2008: D+8.4
Not yet ingested
- Civics
- —
Market trends
- HPI YoY
- ▼ -150.02%
- Current HPI
- 196.19
- Rent YoY
- —
- Metro
- Scranton--Wilkes-Barre, PA
- State GDP YoY
- ▲ 1.68%
- F500 in state
- 34
Industry mix (Fortune 500 HQ in PA)
| Industry | F500 HQs | Revenue |
|---|---|---|
| Healthcare | 2 | $309B |
|
||
| Insurance | 2 | $27B |
|
||
| Telecommunications / Media | 1 | $124B |
|
||
| Industrial Distribution | 1 | $22B |
|
||
| Financial Services | 1 | $20B |
|
||
| Chemicals / Materials | 1 | $18B |
|
||
Price history
+176.1% since first listed12 events — show timeline
- 2026-05-11 Listed $690,000 LCAR
- 2026-05-09 Rental Removed $1,000 LCAR
- 2026-04-17 Rental Removed $1,000 LCAR
- 2026-03-26 Listed for Rent $1,000 LCAR
- 2026-02-18 Listed for Rent $1,500 LCAR
- 2025-11-15 Listing Removed — GLVRMLS
- 2025-04-15 Price Changed $690,000 LCAR
- 2023-12-12 Rental Removed $850 LCAR
- 2023-12-01 Listed for Rent $850 LCAR
- 2020-11-17 Listed $399,900 GSBR as distributed by MLS GRID
- 2015-01-20 Sold (Public Records) $95,000 Public Records
- 2009-11-15 Listed $249,900 GLVRMLS
Property tax history
-1.9%/yrLatest (2026): $5,346 · +0.3% YoY. Source: county tax records.
Cash-flow waterfall
monthlySold comps — $/sqft
last 12 mo · ≤1 miLoading sold comps…