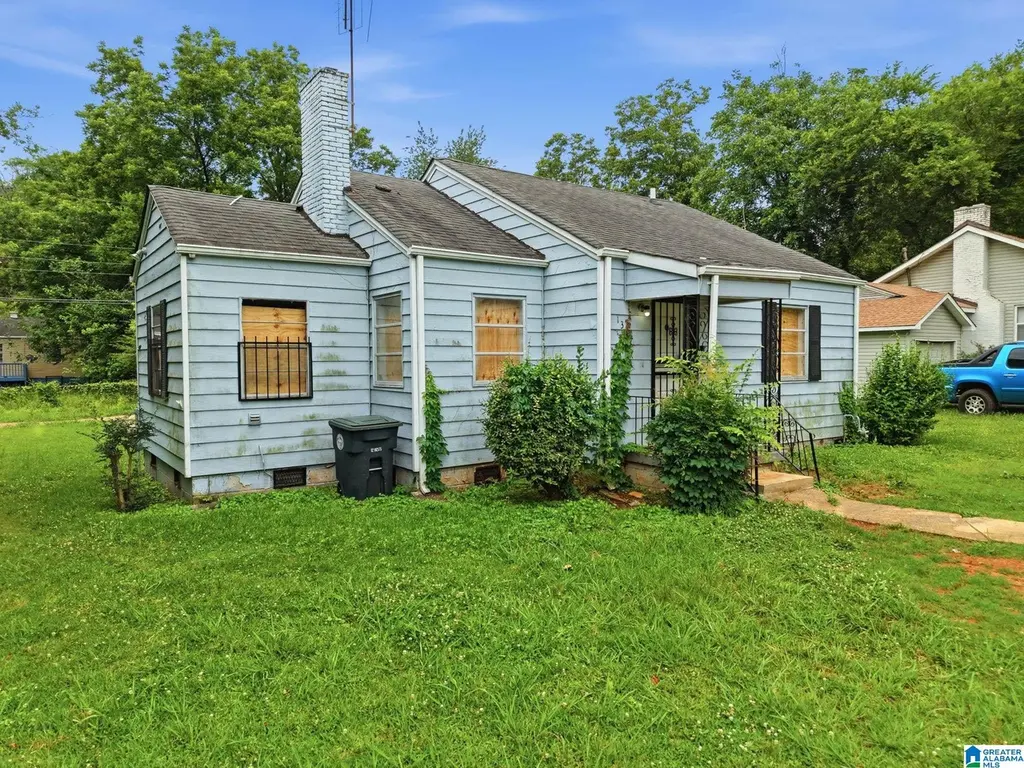
1337 60th St W · Birmingham, AL
Flood risk 1/10 · Minimal
- FEMA flood zone
- X (unshaded)
- Chance of flooding over 30 yrs
- 0.0%
- Est. flood insurance / yr
- $507 – $1,088
Fire risk 1/10 · Minimal
- Est. fire insurance / yr
- $916 – $1,700
Heat risk 6/10 · Moderate
- Hot days now (above 108°F)
- 7 days/yr
- Hot days in 30 yrs
- 19 days/yr
Wind risk 6/10 · Moderate
- Chance of severe wind over 30 yrs
- 27.0%
Air-quality risk 4/10 · Minor
- Unhealthy air days now
- 5 days/yr
- Unhealthy air days in 30 yrs
- 5 days/yr
Risk factors via First Street. Map © Google.
Why this score? — see what drove the C+ grade
The composite is a weighted blend of 9 inputs, each scored 0–100. Each bar is that input's sub-score; the figure is the points it added to the 100-point composite (weight × sub-score).
- Cash flow +29.4/30.0
- DSCR +10.0/10.0
- 1% rule +8.1/10.0
- Livability +3.4/5.0
- ARV discount +3.2/15.0
- Appreciation +2.6/10.0
- Condition / age +2.5/5.0
- Rent growth +2.1/5.0
- Schools +0.9/10.0
$89,999
🖨 Deal sheet 📄 Offer letter ✓ Due diligence
Listing remarks MLS
This one needs just a little work, FP and built in bookcase in LR, kitchen with separate cooktop and wall oven, 3 BR's, full bath, breakfast area, separate laundry room large enough for washer/dryer and a freezer, huge level yard and a detached 1 car garage. NO exterior HVAC unit.
Key facts
- 0.24 acre lot
- Built 1948
- Listed 9 days
Property features AI
Exterior
- Parking: Detached garage; Driveway parking
- Utilities: Public water; Electric water heater; Underground utilities; Internet availability: unknown
- Home design: Existing construction; Single-story layout (all main-level rooms)
- Construction: Vinyl siding; Crawl space foundation
- Exterior features: No pool, patio, deck, or garden/patio; Not waterfront; Lot approximately 0.24 acres
Interior
- Kitchen: Kitchen on main level
- Bedrooms: Master bedroom on main level; Two additional bedrooms on main level
- Flooring: Vinyl
- Bathrooms: One full bathroom with tub/shower combo
- Heating & cooling: Central heating; Central cooling
- Interior features: Vinyl floors; Brick wood-burning fireplace in the living room; Ceilings: Other (see remarks)
Neighborhood map
What this means for you Summary
Snapshot
- This is a 3-bed/1.0-bath single-family listed at $90k.
Deal economics
- At list price, monthly cash flow is $319 ($4k/yr) — positive.
- The deal already cash-flows at list — no discount required.
- Meets the 1% rule at list price ($1k rent vs $90k).
- Cap rate 10.5% vs local median 6.2% in Birmingham — top-decile yield for the area; either an underpriced asset or a hidden risk that comps aren't pricing in. Stress-test before assuming the spread holds.
Location & tenants
- Location reads 67/100 on livability (#78 in AL) — a middle-class / working-renter tenant base. Strengths: commute A+, cost of living A+, housing A+; Watch: amenities C-, crime F, employment F.
- Birmingham City (urban): math 4% / reading 20% proficiency, ranked #116 of 129 in AL (top 90%) — low school quality limits family demand, transient renter base, plan for 1-2y turnover; 82% free/reduced lunch — lower-income household profile, screen leases tightly.
- Zoned schools: Wenonah High School (math 2% / reading 2%, grade F, #291 of 305 statewide, top 100%, 656 students, 85% FRL) — zoned schools at 85% FRL track the district average.
- Market conditions: Rents soft (-1.5%/yr); 87 active listings in the ZIP; 40 comparable units currently listed for rent nearby; rentals lingering (median 44d on market — plan ~5-8 weeks vacancy on turnover, expect pricing pressure); 70% of comp listings sitting > 30 days — soft ceiling on asking rent; 2,114 units permitted in Jefferson County in 2024 (556 in 5+ unit buildings).
Forward outlook
- Local home prices are declining (-3.0%/yr); year-one equity from $622 of loan paydown is wiped out by about $3k of value loss. Plan a longer hold.
- Jefferson County population projected to shrink 4% by 2050 — rents likely to lag national; underwrite the cash flow, not the appreciation.
Negotiation context
- Only 9 days on market — expect competitive offers; lowballing is unlikely to land.
- 2 sale attempts since 11y ago with the ask held roughly flat each time — persistent listings suggest the price (not the market) is what's stuck; bring a comps-based counter.
Risks & watch-outs
- Watch-outs: built in 1948 — expect roof / HVAC / electrical / plumbing capex.
- Climate carrying-cost: major wind risk, 27% chance of damaging wind over 30y; extreme-heat days projected 7→19/yr by 2055 (HVAC capex compounding) — expect insurance premiums to compound above CPI over the hold.
Questions for the listing agent
- Built in 1948 — when were the roof, HVAC, electrical panel, plumbing, and water heater last replaced?
- Is there a deadline driving the sale (1031 exchange, divorce, estate, relocation)? That informs how much negotiation room exists.
- Schools are F-rated, which usually means shorter tenancies and higher turnover. Who's the typical renter profile here, and what's been the actual vacancy rate?
- Crime grade is F in this area — have there been break-ins, vandalism, or insurance claims at this property in the last 3 years? What carrier currently insures it and at what premium?
- What's the average days-on-market for RENTAL listings here right now (not sales)? A rising rental-DOM trend means longer vacancies and softer asking-rent achievability than the comps imply.
- What's the recent tenant-quality profile in this submarket — average credit score on applications, eviction rate, late-payment / NSF rate, and stable-employment percentage? A property-management company in the area should have these aggregated.
- How much new for-sale + rental construction is in the pipeline within 1–3 miles? Heavy new supply typically softens prices + rents 12–24 months out; constrained supply supports both.
Investment metrics
- 1% rule
- 1.31% ✓
- Cap rate
- 10.55%
- Cash-on-cash
- 15.19%
- DSCR
- 1.68
- GRM
- 6.3
CMA / ARV
- ARV (on-the-fly)
- $82,200
- Comps found
- 12
Show comp detail 12 sales within ~0.75 mi
| Address | Dist | Beds/Ba | Sqft | Sold | Price | $/sf | Match |
|---|---|---|---|---|---|---|---|
| 6144 Court M | 0.18mi | 3/1.0 | 1,066 (-3%) | 2mo | $76,000 | $71 | 85 |
| 5625 Avenue Q | 0.44mi | 3/1.0 | 1,103 (+1%) | 3mo | $22,000 | $20 | 76 |
| 5604 Terrace O | 0.33mi | 4/1.0 (+1) | 1,072 (-2%) | 2mo | $80,000 | $75 | 74 |
| 1560 Meadow Ln | 0.30mi | 3/1.0 | 1,008 (-8%) | 1mo | $87,000 | $86 | 72 |
| 5621 Avenue Q | 0.45mi | 3/1.0 | 1,136 (+4%) | 1mo | $72,000 | $63 | 72 |
| 6633 Avenue | 0.47mi | 3/2.0 | 1,107 (+1%) | 2mo | $99,900 | $90 | 71 |
| 5800 Court Q | 0.44mi | 3/1.0 | 1,024 (-7%) | 2mo | $111,000 | $108 | 67 |
| 1569 Meadow Ln | 0.33mi | 3/1.5 | 1,192 (+9%) | 2mo | $50,000 | $42 | 67 |
| 5541 Court P | 0.40mi | 2/1.0 (-1) | 1,035 (-6%) | 1mo | $35,000 | $34 | 66 |
| 1205 Brighton Rd | 0.59mi | 3/1.5 | 1,147 (+5%) | 3mo | $93,000 | $81 | 60 |
| 5528 Avenue Q | 0.45mi | 3/1.0 | 1,252 (+14%) | 2mo | $52,900 | $42 | 54 |
| 1101 Susan Ln | 0.74mi | 3/2.0 | 1,025 (-6%) | 1mo | $164,000 | $160 | 50 |
Match score weights: distance 35% · size 25% · config 20% · recency 20%. Top-matched comps best support the ARV.
Projected returns pro-forma
-3.0% appreciation · 0.0% rent growth · sell at horizon
- IRR
- 2.4%
- Equity multiple
- 1.09×
- Total profit
- $2,286
- Equity at exit
- $13,419
- IRR
- 8.9%
- Equity multiple
- 1.59×
- Total profit
- $14,824
- Equity at exit
- $7,781
Cash invested: $25,200 (down + closing). Projections, not guarantees.
Landlord ↔ Tenant lean methodology
- Overall (STATE)
- 90 Strongly Landlord-Friendly
- State Alabama
- 90 Strongly Landlord-Friendly · R+15
- County
- — inherits STATE
- City
- — inherits STATE
ZIP-level market 35228
- Home prices YoY
- -3.5%
- Rents YoY
- -1.5%
- Active inventory
- 87
- Price-to-rent
- 6.3×
Monthly cashflow live
- Estimated rent
- $1,182 high interval (Pro) →
- Mortgage (P&I)
- −$472
- Tax from tax record
- −$105 /mo · $1,264/yr
- Insurance
- −$37
- HOA
- −$0
- Vacancy / Maint / Mgmt
- −$248
- Net cashflow
- $319
Break-even live
UW: 25.0% down · 7.5% · 30yr · 1.5% tax · 5.0% vac · 8.0% maint · 8.0% mgmt
Financing live
Cash to close
- Down payment
- $22,500
- Closing costs
- $2,700
- Reserves months
- —
- Total cash needed
- —
Loan-product check · same deal, 3 products live
Conventional
25% down · 7.5% · 30yr
- Down + closing
- —
- Monthly P&I
- —
- Monthly cashflow
- —
- DSCR
- —
- Eligible?
- —
Personal DTI + credit; lowest rate.
DSCR
20% down · 8.5% · 30yr
- Down + closing
- —
- Monthly P&I
- —
- Monthly cashflow
- —
- DSCR
- —
- Eligible?
- —
No personal income docs; deal must DSCR.
Hard money
10% down · 12.0% · 12mo
- Down + closing
- —
- Monthly P&I
- —
- Monthly cashflow
- —
- DSCR
- —
- Eligible?
- —
Short-term bridge; refi at stabilization.
Rent comps 40 comps
| Address | Beds | Baths | Sqft | Rent | $/sqft | DOM | Units | Dist |
|---|---|---|---|---|---|---|---|---|
| 1340 Pineview Rd Birmingham, AL | 3.0 | 2.0 | 1116 | $1,075 | $0.96 | 43d | 1 | 0.01mi |
| 1341 Pineview Rd Birmingham, AL | 4.0 | 2.0 | 1409 | $1,300 | $0.92 | 43d | 1 | 0.04mi |
| 5808 Court O Birmingham, AL | 3.0 | 1.5 | 1227 | $1,100 | $0.90 | 43d | 1 | 0.21mi |
| 1272 Meadow Ln Birmingham, AL | 2.0 | 1.0 | 744 | $800 | $1.08 | 43d | 1 | 0.22mi |
| 5725 Avenue O Unit O Birmingham, AL | 3.0 | 1.0 | 957 | $1,073 | $1.12 | 23d | 1 | 0.23mi |
| 5717 Avenue O Unit O Birmingham, AL | 3.0 | 2.0 | 1029 | $1,250 | $1.21 | 43d | 1 | 0.25mi |
| 5713 Avenue P Unit P Birmingham, AL | 3.0 | 1.0 | 1300 | $1,100 | $0.85 | 19d | 1 | 0.34mi |
| 5604 Terrace O Birmingham, AL | 4.0 | 1.0 | 1072 | $1,325 | $1.24 | 43d | 1 | 0.35mi |
| 5710 Monte Sano Dr Birmingham, AL | 2.0 | 1.0 | 700 | $950 | $1.36 | 43d | 1 | 0.38mi |
| 5516 Avenue P Birmingham, AL | 2.0 | 1.0 | 888 | $1,000 | $1.13 | 43d | 1 | 0.40mi |
| 5832 Court Q Birmingham, AL | 3.0 | 1.0 | 912 | $950 | $1.04 | 44d | 1 | 0.40mi |
| 5820 Court Q Birmingham, AL | 3.0 | 1.0 | 902 | $1,200 | $1.33 | 43d | 1 | 0.43mi |
| 1012 33rd St SW Birmingham, AL | 1.0–2.0 | 1.0–2.0 | 800 | $750 | $0.94 | 3d | 1 | 0.46mi |
| 1417 Brighton Rd Birmingham, AL | 3.0 | 2.0 | 1048 | $1,200 | $1.15 | 43d | 1 | 0.49mi |
| 5712 Monte Sano Rd Birmingham, AL | 2.0 | 1.0 | 700 | $900 | $1.29 | 43d | 1 | 0.50mi |
| 3116 Steiner Ave SW Birmingham, AL | 3.0 | 1.0 | 1362 | $1,200 | $0.88 | 43d | 1 | 0.60mi |
| 913 Daniel Cir Birmingham, AL | 4.0 | 2.0 | 1317 | $1,300 | $0.99 | 43d | 1 | 0.61mi |
| 5320 Ter Q Unit Q Birmingham, AL | 3.0 | 2.0 | 1116 | $1,250 | $1.12 | 43d | 1 | 0.61mi |
| 5709 Court H Birmingham, AL | 4.0 | 1.5 | 1455 | $1,400 | $0.96 | 1d | 1 | 0.63mi |
| 5219 Court Q Birmingham, AL | 3.0 | 2.0 | 1082 | $1,200 | $1.11 | 19d | 1 | 0.64mi |
| 1632 51st Street Ensley Unit ENSLEY Birmingham, AL | 3.0 | 1.0 | 1337 | $1,100 | $0.82 | 43d | 1 | 0.66mi |
| 1632 51st St W Birmingham, AL | 3.0 | 1.0 | 1337 | $1,000 | $0.75 | 2d | 1 | 0.66mi |
| 5316 Court I Birmingham, AL | 3.0 | 2.0 | 1284 | $1,200 | $0.93 | 43d | 1 | 0.67mi |
| 5211 Ter Q Unit Q Birmingham, AL | 2.0 | 1.0 | 756 | $775 | $1.03 | 43d | 1 | 0.69mi |
| 5300 Avenue I Birmingham, AL | 4.0 | 2.0 | 1360 | $1,500 | $1.10 | 2d | 1 | 0.74mi |
| 1556 Burgin Ave Birmingham, AL | 3.0 | 1.0 | 1168 | $1,100 | $0.94 | 21d | 1 | 0.75mi |
| 1556 Burgin Ave Birmingham, AL | 4.0 | 1.0 | 1168 | $1,100 | $0.94 | 19d | 1 | 0.75mi |
| 4716 Court M Birmingham, AL | 4.0 | 1.0 | 932 | $1,200 | $1.29 | 43d | 1 | 0.76mi |
| 1112 S Gale Dr Birmingham, AL | 3.0 | 1.5 | 1053 | $1,175 | $1.12 | 43d | 1 | 0.76mi |
| 1606 49th Street Ensley Unit ENSLEY Birmingham, AL | 3.0 | 2.0 | 1136 | $1,100 | $0.97 | 43d | 1 | 0.77mi |
| 829 51st Street Ensley Birmingham, AL | 3.0 | 1.0 | 1203 | $1,340 | $1.11 | 3d | 1 | 0.77mi |
| 709 30th St SW Birmingham, AL | 3.0 | 1.0 | 1273 | $1,000 | $0.79 | 43d | 1 | 0.78mi |
| 1429 47th Street Ensley Unit ENSLEY Birmingham, AL | 2.0 | 1.0 | 768 | $750 | $0.98 | 43d | 1 | 0.79mi |
| 1781 51st Street Ensley Unit ENSLEY Birmingham, AL | 3.0 | 1.5 | 1069 | $950 | $0.89 | 43d | 1 | 0.79mi |
| 2904 Garrison Ave SW Birmingham, AL | 4.0 | 2.0 | 952 | $1,050 | $1.10 | 23d | 1 | 0.82mi |
| 5503 Myron Massey Blvd Fairfield, AL | 3.0 | 2.0 | 1119 | $1,200 | $1.07 | 43d | 1 | 0.84mi |
| 5406 Court G Unit G Fairfield, AL | 3.0 | 2.0 | 1449 | $1,199 | $0.83 | 11d | 1 | 0.84mi |
| 1112 47th St W Birmingham, AL | 2.0 | 1.0 | 1166 | $975 | $0.84 | 43d | 1 | 0.85mi |
| 373 Belcher Dr Birmingham, AL | 4.0 | 1.0 | 1255 | $1,100 | $0.88 | 43d | 1 | 0.85mi |
| 1037 47th Street Ensley Unit ENSLEY Birmingham, AL | 3.0 | 2.0 | 1299 | $1,000 | $0.77 | 43d | 1 | 0.86mi |
Listing history 7 events
-
2026-06-18days on market $89,999 Active 9 DOM
-
2026-06-17days on market $89,999 Active 8 DOM
-
2026-06-16days on market $89,999 Active 7 DOM
-
2026-06-15days on market $89,999 Active 6 DOM
-
2026-06-13days on market $89,999 Active 4 DOM
-
2026-06-10remarks 682-char remark
-
2026-06-10$89,999 Active 1 DOM
ⓘ Source: listings_history table (triggers on properties + properties_extension) + one-shot
backfill from property_details.listing_events for pre-trigger history.
Tax reassessment forecast AL · Resets to sale price
- Current annual tax
- $1,264 · $105/mo
- Projected year-2 tax
- $1,264 · $105/mo
- Expected delta
- $0/yr ($0/mo · 0.0%)
ⓘ Screening estimate from a state-policy table — verify with the county assessor before closing.
Climate risk First Street
- Flood 1/10 Low FEMA zone X (unshaded) · 0% chance over 30 yrs
- Wildfire 1/10 Low
- Heat 6/10 Major 7 d/yr ≥108°F today · 19 d/yr by 30 yrs out
- Wind 6/10 Major 27% chance of damaging wind over 30 yrs
- Air quality 4/10 Moderate 5 unhealthy d/yr today · 5 by 30 yrs out
Nearby sold comps map
Loading sold comps map…
Walkable amenities ~0.75 mi
Loading nearby amenities…
Taxation est. · year 1
- Rental income
- $14,186
- − Mortgage interest
- −$5,041
- − Property taxes
- −$1,264
- − Insurance
- −$450
- − Repairs & maintenance
- −$1,135
- − Management
- −$1,135
- − Depreciation
- −$2,618
- Taxable income
- $2,542
- Est. tax owed @ 24.0%
- −$610
- After-tax cash flow
- $3,219/yr
For passive investors: Depreciation is non-cash, so a rental often shows a tax loss while cash-flowing — sheltering income. Rental losses are passive: they offset passive income freely, and up to $25,000/yr can offset ordinary (W-2) income if you actively participate and your MAGI is under $100k (phasing out to $0 by $150k); unused losses carry forward. On sale, claimed depreciation is recaptured at up to 25%, and gains may owe capital-gains tax (a 1031 exchange can defer both). Figures are a year-1 estimate at your 24.0% rate — not tax advice; consult a CPA.
Schools (NCES district)
- District
- Birmingham City
- NCES district ID
- 0100390
- Math proficiency
- 4% ▼ -17.00%
- Reading proficiency
- 20% ▼ -4.00%
- Median HH income
- $31,988
- Composite
- 9.49/100
- National rank
- #9850
- State rank
- #116 of 129 in AL
Livability — Birmingham
- Score
- 67/100
- State rank
- #78
- US rank
- #10412
Category grades
Schools grade is shown separately in the Schools card above.
Census & demographics
- Census place
- Birmingham, AL
- County
- Jefferson County · 527,445 people
- City population
- 210,422
- Metro
- Birmingham-Hoover, AL
- Population (ZIP)
- 10,216
- Household income
- $50,815
- Rent vs Own
- Severe rent burden
- 456.0
Population outlook (Jefferson County) Hauer SSP2
- Today (2025)
- 669,185 people
- By 2030
- 669,694 · +0.1%
- By 2040
- 661,388 · -1.2%
- By 2050
- 643,086 · -3.9%
- By 2075
- 577,267 · -13.7%
- By 2100
- 474,758 · -29.1%
Race, ethnicity, and origin ACS 2023
- Neighborhood character
- Predominantly Black (89%)
- Race & ethnicity
- Black 89% Hispanic / Latino 5% Two or more races 5% White 5%
- Foreign-born
- 2% · Canada
- Languages at home
- 95% English-only · Spanish 5%
Political lean MEDSL · Jefferson
- 2024 margin
- D (+10.4) · D 54.6% · R 44.2% · Other 1.2%
- 2008→2024 swing
- +5.4pp toward D · 2008: 5.1pp · 2024: 10.4pp
- All cycles
- 2024: D+10.4 2020: D+13.2 2016: D+7.2 2012: D+6.0 2008: D+5.1
Not yet ingested
- Civics
- —
Market trends
- HPI YoY
- ▼ -4.84%
- Current HPI
- 134.8633
- Rent YoY
- ▼ -1.47%
- Metro
- Birmingham-Hoover, AL
- State GDP YoY
- ▲ 2.94%
- F500 in state
- 4
Industry mix (Fortune 500 HQ in AL)
| Industry | F500 HQs | Revenue |
|---|---|---|
| Financial Services | 1 | $8B |
|
||
| Healthcare | 1 | $5B |
|
||
Price history
+104.5% since first listed6 events — show timeline
- 2026-06-09 Listed $89,999 Greater Alabama MLS
- 2021-05-18 Sold (Public Records) $7,237,964 Public Records
- 2015-03-31 Sold (MLS) $18,500 Greater Alabama MLS
- 2015-02-13 Delisted — Greater Alabama MLS
- 2015-01-21 Listed $22,900 Greater Alabama MLS
- 1993-08-05 Sold (Public Records) $44,000 Public Records
Property tax history
+10.3%/yrLatest (2025): $1,264 · +0.0% YoY. Source: county tax records.
Cash-flow waterfall
monthlySold comps — $/sqft
last 12 mo · ≤1 miLoading sold comps…