 Multi-family
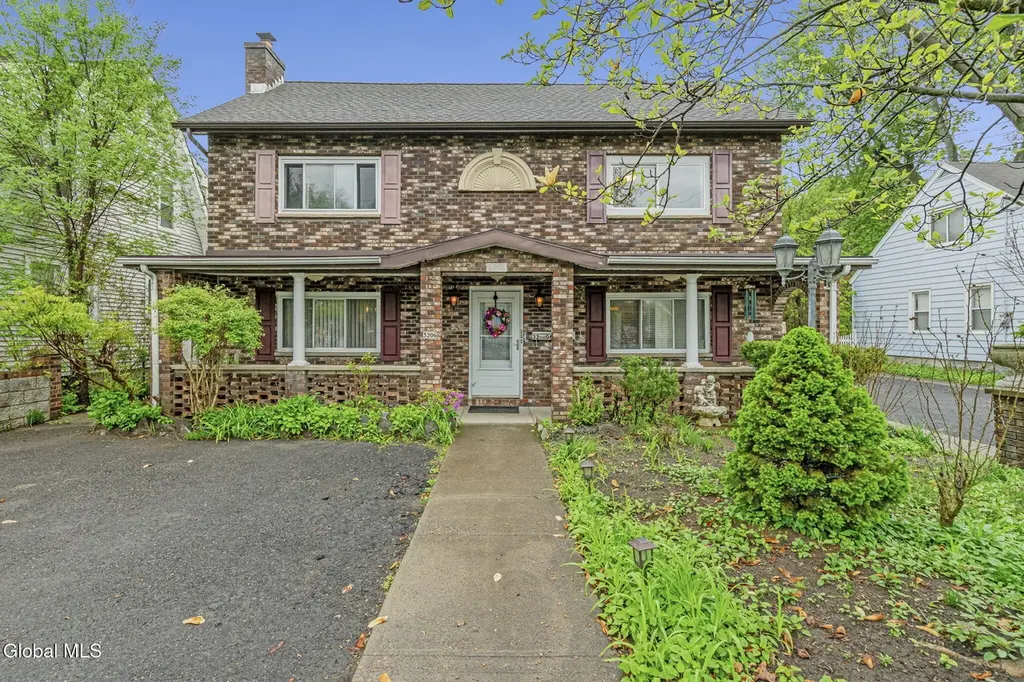
3206 Guilderland Ave · Rotterdam, NY
Flood risk 1/10 · Minimal
- FEMA flood zone
- X (unshaded)
- Chance of flooding over 30 yrs
- 0.0%
- Est. flood insurance / yr
- $473 – $860
Fire risk 1/10 · Minimal
- Est. fire insurance / yr
- $691 – $1,283
Heat risk 4/10 · Minor
- Hot days now (above 96°F)
- 7 days/yr
- Hot days in 30 yrs
- 16 days/yr
Wind risk 2/10 · Minimal
- Chance of severe wind over 30 yrs
- 4.0%
Air-quality risk 1/10 · Minimal
- Unhealthy air days now
- 0 days/yr
- Unhealthy air days in 30 yrs
- 0 days/yr
Risk factors via First Street. Map © Google.
Why this score? — see what drove the F grade
The composite is a weighted blend of 9 inputs, each scored 0–100. Each bar is that input's sub-score; the figure is the points it added to the 100-point composite (weight × sub-score).
- ARV discount +5.9/15.0
- Schools +5.1/10.0
- Livability +3.9/5.0
- Cash flow +3.0/30.0
- Rent growth +2.5/5.0
- Condition / age +2.5/5.0
- 1% rule +0.0/10.0
- DSCR +0.0/10.0
- Appreciation +0.0/10.0
$550,000
🖨 Deal sheet 📄 Offer letter ✓ Due diligence
Multi-family units
County records classify this as Multi-Family (2-4 Unit). Listing-text estimate: 1 unit. estimate disagrees with records
Listing remarks
Exceptional opportunity in the Mohonasen School District! This spacious 3-family property in Rotterdam offers over 4,000 sq ft of versatile living space, ideal for owner-occupants, investors, multi-generational living, or small business owners. The large first-floor unit is perfectly suited for owner occupancy, featuring a large updated eat-in kitchen, four bedrooms, and 1.5 baths--offering the feel and space of a single-family home. Upstairs, you'll find two additional units (a 2-bedroom/1-bath and a 1-bedroom/1-bath), each with separate utilities, providing strong income potential. Lovingly maintained by the same family, the property also includes a generous yard, shed and off-street park
Key facts
- 0.47 acre lot
- Garage
- Built 1960
Property features AI
Finance
- Financial info: Property configured as a 3-unit multifamily (triplex) — 3 total units
Exterior
- Parking: Detached garage (1 garage space); Total of up to 6 parking spaces; Paved driveway and off-street parking
- Utilities: Public water; Septic tank sewer
- Home design: Triplex; Main road frontage approximately 67 feet
- Construction: Brick and vinyl siding exterior; Asphalt roof
- Exterior features: Level lot with road frontage; Outbuilding on the property; Paved, off-street areas and driveway
Interior
- Kitchen: Each unit includes its own kitchen
- Bedrooms: Unit 1: 4 bedrooms (located on 1st floor); Unit 2: 2 bedrooms (located on 2nd floor); Unit 3: 1 bedroom (located on 2nd floor)
- Flooring: Vinyl; Tile; Carpet; Hardwood
- Bathrooms: Three full bathrooms; One half bathroom; Unit 1: 1 full and 1 half bath; Unit 2: 1 full bath; Unit 3: 1 full bath; Full baths located on 1st and 2nd floors
- Heating & cooling: Baseboard and forced air heating (natural gas); Window cooling units
- Interior features: Vinyl, tile, carpet and hardwood flooring; Full, unfinished basement with interior entry; Two wood-burning fireplaces (basement and family room)
- Laundry & utility: Washer and dryer hookups; Electric dryer hookup in basement and upper level
Neighborhood map
What this means for you Summary
Snapshot
- This is a 6-bed/3.0-bath multifamily listed at $550k.
Deal economics
- At list price, monthly cash flow is $-2k ($-21k/yr) — negative.
- To cash-flow at today's rent, offer at most $234k (57.4% below list).
- To meet the 1% rule (rent ≥ 1% of price), the offer needs to be $250k (54.5% below list).
- Recommended offer: $234k (57.4% below list) — sets the bar for cash-flow.
Location & tenants
- Location reads 78/100 on livability (#161 in NY, #2,455 nationally) — a middle-class / working-renter tenant base. Strengths: housing A+, health & safety A+, employment B+; Watch: schools D+, crime F.
- Schalmont Central School District (suburban): math 51% / reading 64% proficiency, ranked #243 of 590 in NY (top 41%) — acceptable for families but not a draw, mixed tenant base, ~2y average lease; only 17% free/reduced lunch — higher-income household profile.
- Market conditions: 181 active listings in the ZIP; solid renter incomes; 154 units permitted in Schenectady County in 2024 (54 in 5+ unit buildings).
- This rent runs 36% of the median local income ($83k/yr) — at the standard rent-burdened threshold; future hikes will face affordability resistance.
Forward outlook
- Local home prices are declining (-3.0%/yr); year-one equity from $4k of loan paydown is wiped out by about $16k of value loss. Plan a longer hold.
- Schenectady County population projected to shrink 4% by 2050 — rents likely to lag national; underwrite the cash flow, not the appreciation.
Negotiation context
- It's been on market 33 days — a 3% lower offer ($534k) is reasonable based on typical stale-listing flexibility.
Questions for the listing agent
- What do current leases actually rent for vs. the listed asking? Can we see a recent rent roll and the last 12 months of T-12 income?
- It's been on market 33 days. Have you received any prior offers? Is the seller open to a 57% concession, seller financing, or rate buy-down credit?
- Built in 1960 — when were the roof, HVAC, electrical panel, plumbing, and water heater last replaced?
- Is there a deadline driving the sale (1031 exchange, divorce, estate, relocation)? That informs how much negotiation room exists.
- Schools are D-rated, which usually means shorter tenancies and higher turnover. Who's the typical renter profile here, and what's been the actual vacancy rate?
- Crime grade is F in this area — have there been break-ins, vandalism, or insurance claims at this property in the last 3 years? What carrier currently insures it and at what premium?
- The area grade is low — what's the realistic commute time and amenity access for the typical tenant pool here? Any planned neighborhood developments (good or bad) we should know about?
- What's the average days-on-market for RENTAL listings here right now (not sales)? A rising rental-DOM trend means longer vacancies and softer asking-rent achievability than the comps imply.
- What's the recent tenant-quality profile in this submarket — average credit score on applications, eviction rate, late-payment / NSF rate, and stable-employment percentage? A property-management company in the area should have these aggregated.
- How much new apartment / multifamily construction is in the pipeline within 1–3 miles? Heavy new supply (>2% of stock underway) typically softens rents 12–24 months out; light construction supports rent growth.
Investment metrics
- 1% rule
- 0.46% ✗
- Cap rate
- 2.40%
- Cash-on-cash
- -13.92%
- DSCR
- 0.38
- GRM
- 18.3
CMA / ARV
- ARV (median comp)
- $530,789
- List price
- $550,000
- Delta
- 3.62%
- Verdict
- FAIR
- Comps
- 3 within 1.0 mi
Projected returns pro-forma
-3.0% appreciation · 3.0% rent growth · sell at horizon
- IRR
- -42.6%
- Equity multiple
- -0.32×
- Total profit
- $-202,886
- Equity at exit
- $82,007
- IRR
- -73.4%
- Equity multiple
- -1.10×
- Total profit
- $-323,116
- Equity at exit
- $47,554
Cash invested: $154,000 (down + closing). Projections, not guarantees.
Landlord ↔ Tenant lean methodology
- Overall (STATE)
- 15 Strongly Tenant-Friendly
- State New York
- 15 Strongly Tenant-Friendly · D+10
- County
- — inherits STATE
- City
- — inherits STATE
ZIP-level market 12306
- Home prices YoY
- -23.8%
- Active inventory
- 181
- Price-to-rent
- 18.3×
Monthly cashflow live
- Estimated rent
- $2,503 medium interval (Pro) →
- Mortgage (P&I)
- −$2,884
- Tax from tax record
- −$650 /mo · $7,803/yr
- Insurance
- −$229
- HOA
- −$0
- Vacancy / Maint / Mgmt
- −$526
- Net cashflow
- $-1,786
Break-even live
UW: 25.0% down · 7.5% · 30yr · 1.5% tax · 5.0% vac · 8.0% maint · 8.0% mgmt
Financing live
Cash to close
- Down payment
- $137,500
- Closing costs
- $16,500
- Reserves months
- —
- Total cash needed
- —
Loan-product check · same deal, 3 products live
Conventional
25% down · 7.5% · 30yr
- Down + closing
- —
- Monthly P&I
- —
- Monthly cashflow
- —
- DSCR
- —
- Eligible?
- —
Personal DTI + credit; lowest rate.
DSCR
20% down · 8.5% · 30yr
- Down + closing
- —
- Monthly P&I
- —
- Monthly cashflow
- —
- DSCR
- —
- Eligible?
- —
No personal income docs; deal must DSCR.
Hard money
10% down · 12.0% · 12mo
- Down + closing
- —
- Monthly P&I
- —
- Monthly cashflow
- —
- DSCR
- —
- Eligible?
- —
Short-term bridge; refi at stabilization.
Listing history 11 events
-
2026-06-10status $550,000 Pending 33 DOM
-
2026-06-09days on market $550,000 Contingent 33 DOM
-
2026-06-08days on market $550,000 Contingent 32 DOM
-
2026-06-07days on market $550,000 Contingent 31 DOM
-
2026-06-05days on market $550,000 Contingent 28 DOM
-
2026-06-03days on market $550,000 Contingent 27 DOM
-
2026-06-02days on market $550,000 Contingent 26 DOM
-
2026-06-01days on market $550,000 Contingent 25 DOM
-
2026-05-31days on market $550,000 Contingent 24 DOM
-
2026-05-31days on market $550,000 Contingent 23 DOM
-
2026-05-07$550,000 Active 824-char remark
ⓘ Source: listings_history table (triggers on properties + properties_extension) + one-shot
backfill from property_details.listing_events for pre-trigger history.
Tax reassessment forecast NY · Partial reset (capped growth)
- Current annual tax
- $7,803 · $650/mo
- Projected year-2 tax
- $8,549 · $712/mo
- Expected delta
- +$746/yr (+$62/mo · 9.6%)
ⓘ Screening estimate from a state-policy table — verify with the county assessor before closing.
Climate risk First Street
- Flood 1/10 Low FEMA zone X (unshaded) · 0% chance over 30 yrs
- Wildfire 1/10 Low
- Heat 4/10 Moderate 7 d/yr ≥96°F today · 16 d/yr by 30 yrs out
- Wind 2/10 Low 4% chance of damaging wind over 30 yrs
- Air quality 1/10 Low 0 unhealthy d/yr today · 0 by 30 yrs out
Nearby sold comps map
Loading sold comps map…
Walkable amenities ~0.75 mi
Loading nearby amenities…
Taxation est. · year 1
- Rental income
- $30,035
- − Mortgage interest
- −$30,809
- − Property taxes
- −$7,803
- − Insurance
- −$2,750
- − Repairs & maintenance
- −$2,403
- − Management
- −$2,403
- − Depreciation
- −$16,000
- Taxable loss
- −$32,133
- Est. tax savings @ 24.0%
- +$7,712
- After-tax cash flow
- $-13,725/yr
For passive investors: Depreciation is non-cash, so a rental often shows a tax loss while cash-flowing — sheltering income. Rental losses are passive: they offset passive income freely, and up to $25,000/yr can offset ordinary (W-2) income if you actively participate and your MAGI is under $100k (phasing out to $0 by $150k); unused losses carry forward. On sale, claimed depreciation is recaptured at up to 25%, and gains may owe capital-gains tax (a 1031 exchange can defer both). Figures are a year-1 estimate at your 24.0% rate — not tax advice; consult a CPA.
Schools (NCES district)
- District
- Schalmont Central School District
- NCES district ID
- 3625980
- Math proficiency
- 51% ▼ -7.00%
- Reading proficiency
- 64% ▲ 7.00%
- Median HH income
- $72,566
- Composite
- 51.11/100
- National rank
- #1765
- State rank
- #243 of 590 in NY
Livability — Rotterdam
- Score
- 78/100
- State rank
- #161
- US rank
- #2455
Category grades
Schools grade is shown separately in the Schools card above.
Census & demographics
- Census place
- Rotterdam, NY
- County
- Schenectady County · 141,369 people
- Metro
- Albany-Schenectady-Troy, NY
- Population (ZIP)
- 27,865
- Household income
- $83,202
- Rent vs Own
- Severe rent burden
- 629.0
Population outlook (Schenectady County) Hauer SSP2
- Today (2025)
- 155,046 people
- By 2030
- 154,322 · -0.5%
- By 2040
- 151,796 · -2.1%
- By 2050
- 148,621 · -4.1%
- By 2075
- 141,229 · -8.9%
- By 2100
- 126,014 · -18.7%
Race, ethnicity, and origin ACS 2023
- Neighborhood character
- Predominantly White (78%)
- Race & ethnicity
- White 78% Two or more races 8% Black 7% Hispanic / Latino 7% Asian 3%
- Hispanic origin (detail)
- Puerto Rican 4% Dominican 1%
- Common ancestry
- Romanian 7% Lithuanian 5% Iranian 3%
- Foreign-born
- 6% · Canada
- Languages at home
- 94% English-only · Spanish 3% Other Indo-European 1% Other Asian/Pacific 1%
Political lean MEDSL · Schenectady
- 2024 margin
- D (+10.8) · D 55.4% · R 44.6%
- 2008→2024 swing
- -1.8pp toward R · 2008: 12.7pp · 2024: 10.8pp
- All cycles
- 2024: D+10.8 2020: D+15.7 2016: D+5.8 2012: D+15.4 2008: D+12.7
Not yet ingested
- Civics
- —
Market trends
- HPI YoY
- ▼ -91.35%
- Current HPI
- 292.1229
- Rent YoY
- —
- Metro
- Albany-Schenectady-Troy, NY
- State GDP YoY
- ▲ 2.60%
- F500 in state
- 92
Industry mix (Fortune 500 HQ in NY)
| Industry | F500 HQs | Revenue |
|---|---|---|
| Financial Services | 10 | $950B |
|
||
| Consumer Goods | 9 | $162B |
|
||
| Insurance | 4 | $225B |
|
||
| Telecommunications | 2 | $144B |
|
||
| Pharmaceuticals | 2 | $112B |
|
||
| Media / Entertainment | 2 | $69B |
|
||
Price history
3 events — show timeline
- 2026-06-09 Pending — Global MLS
- 2026-05-23 Contingent — Global MLS
- 2026-05-07 Listed $550,000 Global MLS
Property tax history
-0.2%/yrLatest (2025): $7,803 · +1.6% YoY. Source: county tax records.
Cash-flow waterfall
monthlySold comps — $/sqft
last 12 mo · ≤1 miLoading sold comps…