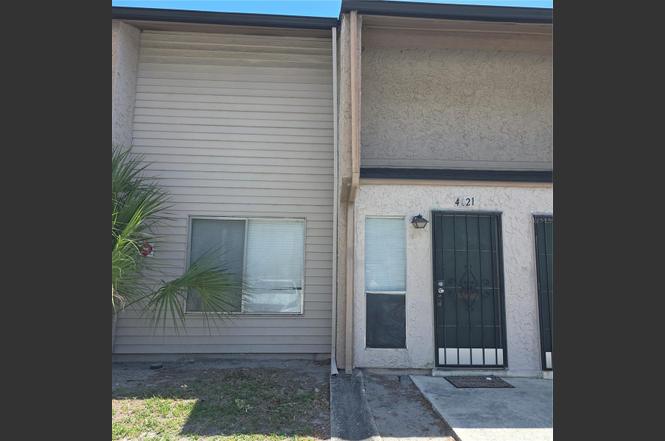
4021 Henley Rd #1701 · Orlando, FL
Flood risk 1/10 · Minimal
- FEMA flood zone
- X (unshaded)
- Chance of flooding over 30 yrs
- 0.0%
- Est. flood insurance / yr
- $507 – $1,088
Fire risk 1/10 · Minimal
- Est. fire insurance / yr
- $947 – $1,759
Heat risk 9/10 · Severe
- Hot days now (above 108°F)
- 7 days/yr
- Hot days in 30 yrs
- 23 days/yr
Wind risk 9/10 · Severe
- Chance of severe wind over 30 yrs
- 99.0%
Air-quality risk 1/10 · Minimal
- Unhealthy air days now
- 0 days/yr
- Unhealthy air days in 30 yrs
- 0 days/yr
Risk factors via First Street. Map © Google.
Why this score? — see what drove the B- grade
The composite is a weighted blend of 9 inputs, each scored 0–100. Each bar is that input's sub-score; the figure is the points it added to the 100-point composite (weight × sub-score).
- Cash flow +26.0/30.0
- 1% rule +10.0/10.0
- DSCR +8.7/10.0
- ARV discount +7.5/15.0
- Livability +4.3/5.0
- Schools +4.1/10.0
- Condition / age +2.5/5.0
- Rent growth +2.4/5.0
- Appreciation +0.0/10.0
$85,000
🖨 Deal sheet 📄 Offer letter ✓ Due diligence
Listing remarks MLS
As you walk into the entrance of this townhome, you are greeted by the spacious living room situated on the first floor with easy access to the open kitchen and dining room, a personal half bath is located in the center of the first floor. The dining roomleads to your privately fenced outdoor space perfect for entertaining. The laundry room is located upstairs right between the master bedroom and 2nd bedroom for easy access. Both bedrooms share a Jack & Jill bath. Come see today for this great opportunity! All information recorded in the MLS is intended to be accurate but cannot be guaranteed, buyer advised to verify. * If exact square footage or room sizes are a concern, unit should be independently measured. Purchase this property for as little as 3 percent down!
Key facts
- Clubhouse
- Near to shops
- Access to a pool
Tags
Property features AI
Finance
- Other: Property type: Residential condominium; Zoning: R-3; Total acreage: less than 1/4 acre
- Financial info: Total monthly HOA fees listed as $370 (total annual fees $4,440); No lease restrictions indicated
- HOA & community: HOA required with monthly fee of $370; HOA covers common area taxes and pool; Association approval required; Community amenities include pool and sidewalks; Cats and dogs allowed
Exterior
- Utilities: Public water; Public sewer; Cable available; Public utilities
- Home design: Residential condominium; Two stories; Faces northeast; Unit on first floor
- Construction: Block and frame construction; Shingle roof; Slab foundation; Built as part of building number 4321
- Exterior features: Other exterior features; Asphalt road surface
Interior
- Kitchen: Range; Refrigerator
- Bedrooms: 2 bedrooms
- Flooring: Carpet; Ceramic tile
- Bathrooms: 1 full bathroom; 1 half bathroom
- Interior features: Central heating; Central air; 7 total rooms
- Laundry & utility: Washer; Dryer; Laundry closet
Neighborhood map
What this means for you Summary
Snapshot
- This is a 2-bed/2.0-bath condo listed at $85k.
Deal economics
- At list price, monthly cash flow is $210 ($3k/yr) — positive.
- The deal already cash-flows at list — no discount required.
- Meets the 1% rule at list price ($1k rent vs $85k).
- Recommended offer: $75k (12.0% below list) — sets the bar for market timing.
- Cap rate 9.3% vs local median 3.0% in Orlando — top-decile yield for the area; either an underpriced asset or a hidden risk that comps aren't pricing in. Stress-test before assuming the spread holds.
Location & tenants
- Location reads 86/100 on livability (#12 in FL, #360 nationally) — a professional / high-income tenant draw. Strengths: amenities A+, commute A+, housing A+.
- Orange (suburban): math 46% / reading 51% proficiency, ranked #43 of 73 in FL (top 59%) — families likely to look elsewhere, expect single-tenant / working-renter base with shorter leases.
- Market conditions: Rents soft (-0.5%/yr); 222 active listings in the ZIP; 40 comparable units currently listed for rent nearby; rentals at typical pace (median 24d on market — plan ~3-4 weeks tenant-placement turnaround); 8,053 units permitted in Orange County in 2024 (3,133 in 5+ unit buildings).
- This rent runs 38% of the median local income ($47k/yr) — at the standard rent-burdened threshold; future hikes will face affordability resistance.
Forward outlook
- Local home prices are declining (-3.0%/yr); year-one equity from $588 of loan paydown is wiped out by about $3k of value loss. Plan a longer hold.
- Orange County population projected at +52% by 2050 — long-run rental-demand tailwind backs the buy-and-hold thesis.
Negotiation context
- It's been on market 200 days — a 12% lower offer ($75k) is reasonable based on typical stale-listing flexibility.
- 5 sale attempts since 15y ago; this cycle's ask has dropped $20k (19%) from the opening price — seller is motivated, your offer sets the floor, not the list.
- Current owner paid $22k; list at $85k implies a 281% gain — meaningful room to come down on a strong offer.
Risks & watch-outs
- Watch-outs: HOA is 25% of rent.
- Climate carrying-cost: severe wind risk, 99% chance of damaging wind over 30y; extreme-heat days projected 7→23/yr by 2055 (HVAC capex compounding) — expect insurance premiums to compound above CPI over the hold.
Questions for the listing agent
- It's been on market 200 days. Have you received any prior offers? Is the seller open to a 12% concession, seller financing, or rate buy-down credit?
- Built in 1975 — when were the roof, HVAC, electrical panel, plumbing, and water heater last replaced?
- What does the HOA fee cover, when was the last increase, and are there any pending special assessments or reserve-fund shortfalls?
- Any open or pending special assessments — roof, HVAC, plumbing, elevator, façade? What's the per-unit balance and payoff schedule, and is the seller paying it off at close or rolling it to the buyer?
- Why hasn't it sold? Are there any deal-killer items the seller is aware of (foundation, flood, title, zoning, code violations)?
- Is there a deadline driving the sale (1031 exchange, divorce, estate, relocation)? That informs how much negotiation room exists.
- Schools are B-rated — typically a magnet for longer-tenancy family renters. What's the average tenant stay here, and is there a school-zone premium baked into asking?
- What's the average days-on-market for RENTAL listings here right now (not sales)? A rising rental-DOM trend means longer vacancies and softer asking-rent achievability than the comps imply.
- What's the recent tenant-quality profile in this submarket — average credit score on applications, eviction rate, late-payment / NSF rate, and stable-employment percentage? A property-management company in the area should have these aggregated.
- How much new apartment / multifamily construction is in the pipeline within 1–3 miles? Heavy new supply (>2% of stock underway) typically softens rents 12–24 months out; light construction supports rent growth.
Investment metrics
- 1% rule
- 1.74% ✓
- Cap rate
- 9.26%
- Cash-on-cash
- 10.61%
- DSCR
- 1.47
- GRM
- 4.8
CMA / ARV
No comps found within radius.
Projected returns pro-forma
-3.0% appreciation · 0.0% rent growth · sell at horizon
- IRR
- -5.3%
- Equity multiple
- 0.81×
- Total profit
- $-4,462
- Equity at exit
- $12,674
- IRR
- -1.8%
- Equity multiple
- 0.90×
- Total profit
- $-2,383
- Equity at exit
- $7,349
Cash invested: $23,800 (down + closing). Projections, not guarantees.
Landlord ↔ Tenant lean methodology
- Overall (STATE)
- 87 Strongly Landlord-Friendly
- State Florida
- 87 Strongly Landlord-Friendly · R+3
- County
- — inherits STATE
- City
- — inherits STATE
ZIP-level market 32839
- Home prices YoY
- -20.1%
- Rents YoY
- -0.5%
- Active inventory
- 222
- Price-to-rent
- 4.8×
Monthly cashflow live
- Estimated rent
- $1,481 high interval (Pro) →
- Mortgage (P&I)
- −$446
- Tax from tax record
- −$108 /mo · $1,300/yr
- Insurance
- −$35
- HOA
- −$370
- Vacancy / Maint / Mgmt
- −$311
- Net cashflow
- $210
Break-even live
UW: 25.0% down · 7.5% · 30yr · 1.5% tax · 5.0% vac · 8.0% maint · 8.0% mgmt
Financing live
Cash to close
- Down payment
- $21,250
- Closing costs
- $2,550
- Reserves months
- —
- Total cash needed
- —
Loan-product check · same deal, 3 products live
Conventional
25% down · 7.5% · 30yr
- Down + closing
- —
- Monthly P&I
- —
- Monthly cashflow
- —
- DSCR
- —
- Eligible?
- —
Personal DTI + credit; lowest rate.
DSCR
20% down · 8.5% · 30yr
- Down + closing
- —
- Monthly P&I
- —
- Monthly cashflow
- —
- DSCR
- —
- Eligible?
- —
No personal income docs; deal must DSCR.
Hard money
10% down · 12.0% · 12mo
- Down + closing
- —
- Monthly P&I
- —
- Monthly cashflow
- —
- DSCR
- —
- Eligible?
- —
Short-term bridge; refi at stabilization.
Rent comps 40 comps
| Address | Beds | Baths | Sqft | Rent | $/sqft | DOM | Units | Dist |
|---|---|---|---|---|---|---|---|---|
| 4023 Henley Rd #1702 Orlando, FL | 2.0 | 1.5 | 1164 | $1,400 | $1.20 | 24d | 1 | 0.02mi |
| 4029 Henley Rd #1705 Orlando, FL | 2.0 | 1.5 | 1164 | $1,625 | $1.40 | 24d | 1 | 0.03mi |
| 4033 Henley Rd #1707 Orlando, FL | 2.0 | 1.5 | 1164 | $1,500 | $1.29 | 22d | 1 | 0.03mi |
| 2245 Lyme Bay Dr #1103 Orlando, FL | 2.0 | 1.5 | 1174 | $1,600 | $1.36 | 8d | 1 | 0.06mi |
| 4010 Dolomite St Unit A6 Orlando, FL | 1.0 | 1.5 | 762 | $1,200 | $1.57 | 14d | 1 | 0.06mi |
| 4025 Billingsgate Rd #2004 Orlando, FL | 2.0 | 1.5 | 1164 | $1,700 | $1.46 | 24d | 1 | 0.07mi |
| 3914 Crayrich Cir Unit GE Orlando, FL | 1.0 | 1.5 | 762 | $1,200 | $1.57 | 24d | 1 | 0.08mi |
| 4016 Woodfern Dr Unit B8 Orlando, FL | 2.0 | 2.5 | 1211 | $1,750 | $1.45 | 18d | 1 | 0.08mi |
| 3977 Crayrich Cir Orlando, FL | 1.0 | 1.0 | 762 | $1,210 | $1.59 | 8d | 1 | 0.10mi |
| 3977 Crayrich Cir Unit C-1 Orlando, FL | 1.0 | 1.5 | 762 | $1,210 | $1.59 | 11d | 1 | 0.11mi |
| 1831 Warringwood Dr Unit C4 Orlando, FL | 2.0 | 2.5 | 1211 | $1,200 | $0.99 | 24d | 1 | 0.14mi |
| 3960 Crayrich Cir Orlando, FL | 1.0 | 2.0 | 762 | $1,150 | $1.51 | 24d | 1 | 0.14mi |
| 1835 Warringwood Dr Orlando, FL | 2.0 | 1.5 | 762 | $1,395 | $1.83 | 22d | 1 | 0.14mi |
| 2418 Skan Ct Unit C Orlando, FL | 3.0 | 2.0 | 1308 | $1,825 | $1.40 | 24d | 1 | 0.18mi |
| 4255 Barwood Dr Orlando, FL | 1.0–3.0 | 1.0–2.5 | 1071 | $1,455 | $1.36 | 4d | 1 | 0.25mi |
| 2482 Lakeway Branch Dr #904 Orlando, FL | 2.0 | 2.0 | 1227 | $1,625 | $1.32 | 24d | 1 | 0.26mi |
| 2482 Lakeway Branch Dr Orlando, FL | 2.0 | 2.0 | 1227 | $1,499 | $1.22 | 24d | 1 | 0.26mi |
| 4405 S Texas Ave Orlando, FL | 2.0 | 2.0 | 1100 | $1,550 | $1.41 | 24d | 1 | 0.26mi |
| 4424 S Texas Ave Unit 1-2051-205 Orlando, FL | 2.0 | 2.0 | 900 | $1,750 | $1.94 | 3d | 1 | 0.28mi |
| 4424 S Texas Ave Unit 204 Orlando, FL | 2.0 | 2.0 | 900 | $1,900 | $2.11 | 10d | 1 | 0.28mi |
| 1711 37th St Orlando, FL | 1.0 | 1.0 | 1485 | $1,250 | $0.84 | 8d | 1 | 0.34mi |
| 2622 Lemon Tree Ln Unit 6-K Orlando, FL | 2.0 | 2.0 | 976 | $1,200 | $1.23 | 22d | 1 | 0.44mi |
| 2225 Holden Ave #104 Orlando, FL | 2.0 | 2.0 | 1248 | $1,800 | $1.44 | 24d | 1 | 0.50mi |
| 1717 Holden Ave Orlando, FL | 1.0–3.0 | 1.0–2.5 | 980 | $1,424 | $1.45 | 2d | 26 | 0.55mi |
| 4733 S Texas Ave Unit 4733B Orlando, FL | 2.0 | 2.0 | 976 | $1,450 | $1.49 | 22d | 1 | 0.62mi |
| 4749 S Texas Ave Unit 4749C Orlando, FL | 2.0 | 2.0 | 976 | $1,450 | $1.49 | 24d | 1 | 0.62mi |
| 4725 S Texas Ave Apt C Orlando, FL | 2.0 | 2.0 | 976 | $1,249 | $1.28 | 24d | 1 | 0.63mi |
| 2783 L B McLeod Rd Unit D Orlando, FL | 2.0 | 1.5 | 992 | $1,195 | $1.20 | 24d | 1 | 0.63mi |
| 2201 Metropolitan Way Orlando, FL | 2.0 | 2.0 | 874 | $1,475 | $1.69 | 3d | 1 | 0.63mi |
| 1440 Holden Ave Unit B12 Orlando, FL | 2.0 | 2.0 | 970 | $1,500 | $1.55 | 24d | 1 | 0.64mi |
| 2789 L B McLeod Rd Unit 2789B Orlando, FL | 1.0 | 1.0 | 780 | $1,100 | $1.41 | 22d | 1 | 0.66mi |
| 2751 L B McLeod Rd Unit 2751-A Orlando, FL | 3.0 | 2.0 | 1338 | $1,600 | $1.20 | 18d | 1 | 0.66mi |
| 4759 S Texas Ave Unit 4759C Orlando, FL | 2.0 | 2.0 | 976 | $1,450 | $1.49 | 16d | 1 | 0.66mi |
| 4746 Rio Grande Ave Orlando, FL | 1.0–3.0 | 1.0–2.0 | 920 | $1,574 | $1.71 | 2d | 40 | 0.66mi |
| 4791 S Texas Ave Orlando, FL | 2.0 | 2.0 | 976 | $1,300 | $1.33 | 24d | 1 | 0.66mi |
| 5017 City St #1923 Orlando, FL | 1.0 | 1.0 | 724 | $1,500 | $2.07 | 24d | 1 | 0.66mi |
| 4795 S Texas Ave Unit 4795A Orlando, FL | 1.0 | 1.0 | 756 | $1,200 | $1.59 | 24d | 1 | 0.66mi |
| 4711 S Texas Ave Unit 4711A Orlando, FL | 2.0 | 2.0 | 976 | $1,600 | $1.64 | 24d | 1 | 0.67mi |
| 4703 S Texas Ave Unit A Orlando, FL | 1.0 | 1.0 | 756 | $1,200 | $1.59 | 24d | 1 | 0.67mi |
| 4801 S Texas Ave Unit 4801D Orlando, FL | 1.0 | 1.0 | 756 | $1,200 | $1.59 | 24d | 1 | 0.67mi |
HOA detail condo
- Monthly dues
- $370 · $4,440/yr
- Assessments
- None detected in remarks — confirm with the listing agent.
Listing history 16 events
-
2026-05-06status Pending
-
2026-04-02status Active
-
2026-03-31historical
-
2026-03-17price $85,000
-
2025-10-17$105,000 Active
-
2013-07-02soldstatus $22,300
-
2013-06-20soldstatus $22,250 781-char remark
Show marketing remark (781 chars)
As you walk into the entrance of this townhome, you are greeted by the spacious living room situated on the first floor with easy access to the open kitchen and dining room, a personal half bath is located in the center of the first floor. The dining roomleads to your privately fenced outdoor space perfect for entertaining. The laundry room is located upstairs right between the master bedroom and 2nd bedroom for easy access. Both bedrooms share a Jack & Jill bath. Come see today for this great opportunity! All information recorded in the MLS is intended to be accurate but cannot be guaranteed, buyer advised to verify. * If exact square footage or room sizes are a concern, unit should be independently measured. Purchase this property for as little as 3 percent down!
-
2013-05-01$19,950 781-char remark
Show marketing remark (781 chars)
As you walk into the entrance of this townhome, you are greeted by the spacious living room situated on the first floor with easy access to the open kitchen and dining room, a personal half bath is located in the center of the first floor. The dining roomleads to your privately fenced outdoor space perfect for entertaining. The laundry room is located upstairs right between the master bedroom and 2nd bedroom for easy access. Both bedrooms share a Jack & Jill bath. Come see today for this great opportunity! All information recorded in the MLS is intended to be accurate but cannot be guaranteed, buyer advised to verify. * If exact square footage or room sizes are a concern, unit should be independently measured. Purchase this property for as little as 3 percent down!
-
2013-02-22historical
-
2012-12-21$24,900
-
2011-11-28historical
-
2011-03-07$13,500
-
2003-11-13soldstatus $40,000
-
2002-09-27soldstatus $36,000
-
2001-02-19soldstatus $30,000
-
1994-09-28soldstatus $30,000
ⓘ Source: listings_history table (triggers on properties + properties_extension) + one-shot
backfill from property_details.listing_events for pre-trigger history.
Tax reassessment forecast FL · Resets to sale price
- Current annual tax
- $1,300 · $108/mo
- Projected year-2 tax
- $1,300 · $108/mo
- Expected delta
- $0/yr ($0/mo · 0.0%)
ⓘ Screening estimate from a state-policy table — verify with the county assessor before closing.
Climate risk First Street
- Flood 1/10 Low FEMA zone X (unshaded) · 0% chance over 30 yrs
- Wildfire 1/10 Low
- Heat 9/10 Extreme 7 d/yr ≥108°F today · 23 d/yr by 30 yrs out
- Wind 9/10 Extreme 99% chance of damaging wind over 30 yrs
- Air quality 1/10 Low 0 unhealthy d/yr today · 0 by 30 yrs out
Nearby sold comps map
Loading sold comps map…
Walkable amenities ~0.75 mi
Loading nearby amenities…
Taxation est. · year 1
- Rental income
- $17,770
- − Mortgage interest
- −$4,761
- − Property taxes
- −$1,300
- − Insurance
- −$425
- − Repairs & maintenance
- −$1,422
- − Management
- −$1,422
- − HOA
- −$4,440
- − Depreciation
- −$2,473
- Taxable income
- $1,528
- Est. tax owed @ 24.0%
- −$367
- After-tax cash flow
- $2,158/yr
For passive investors: Depreciation is non-cash, so a rental often shows a tax loss while cash-flowing — sheltering income. Rental losses are passive: they offset passive income freely, and up to $25,000/yr can offset ordinary (W-2) income if you actively participate and your MAGI is under $100k (phasing out to $0 by $150k); unused losses carry forward. On sale, claimed depreciation is recaptured at up to 25%, and gains may owe capital-gains tax (a 1031 exchange can defer both). Figures are a year-1 estimate at your 24.0% rate — not tax advice; consult a CPA.
Schools (NCES district)
- District
- Orange
- NCES district ID
- 1201440
- Math proficiency
- 46% ▼ -9.00%
- Reading proficiency
- 51% ▼ -2.00%
- Median HH income
- $49,350
- Composite
- 41.47/100
- National rank
- #3461
- State rank
- #43 of 73 in FL
Livability — Orlando
- Score
- 86/100
- State rank
- #12
- US rank
- #360
Category grades
Schools grade is shown separately in the Schools card above.
Census & demographics
- County
- Orange County · 1,471,359 people
- City population
- 964,969
- Metro
- Orlando-Kissimmee-Sanford, FL
- Population (ZIP)
- 53,242
- Household income
- $47,313
- Rent vs Own
- Severe rent burden
- 5337.0
Population outlook (Orange County) Hauer SSP2
- Today (2025)
- 1,618,226 people
- By 2030
- 1,787,404 · +10.5%
- By 2040
- 2,125,621 · +31.4%
- By 2050
- 2,454,016 · +51.6%
- By 2075
- 3,173,711 · +96.1%
- By 2100
- 3,607,781 · +122.9%
Race, ethnicity, and origin ACS 2023
- Neighborhood character
- Diverse neighborhood (Simpson 0.69)
- Race & ethnicity
- Hispanic / Latino 39% Black 35% Two or more races 17% White 16% Asian 4%
- Hispanic origin (detail)
- Mexican 5% Puerto Rican 14% Cuban 2% Dominican 3%
- Common ancestry
- Hispanic 8% Estonian 1% Lithuanian 1%
- Foreign-born
- 30% · Canada, Jamaica, Vietnam
- Languages at home
- 51% English-only · Spanish 33% French/Haitian/Cajun 9% Other Indo-European 2%
Political lean MEDSL · Orange
- 2024 margin
- D (+13.6) · D 56.1% · R 42.5% · Other 1.3%
- 2008→2024 swing
- -5.0pp toward R · 2008: 18.6pp · 2024: 13.6pp
- All cycles
- 2024: D+13.6 2020: D+23.1 2016: D+24.6 2012: D+18.2 2008: D+18.6
Not yet ingested
- Civics
- —
Market trends
- HPI YoY
- ▼ -89.65%
- Current HPI
- 357.4828
- Rent YoY
- ▼ -0.50%
- Metro
- Orlando-Kissimmee-Sanford, FL
- State GDP YoY
- ▲ 3.28%
- F500 in state
- 36
Industry mix (Fortune 500 HQ in FL)
| Industry | F500 HQs | Revenue |
|---|---|---|
| Industrial Technology | 2 | $29B |
|
||
| Insurance | 2 | $17B |
|
||
| Retail | 1 | $60B |
|
||
| Technology Distribution | 1 | $58B |
|
||
| Homebuilding | 1 | $35B |
|
||
| Technology Manufacturing | 1 | $35B |
|
||
Price history
+183.3% since first listed16 events — show timeline
- 2026-05-06 Pending — Stellar MLS as Distributed by MLS Grid
- 2026-04-02 Relisted — Stellar MLS as Distributed by MLS Grid
- 2026-03-31 Listing Removed — Stellar MLS as Distributed by MLS Grid
- 2026-03-17 Price Changed $85,000 Stellar MLS as Distributed by MLS Grid
- 2025-10-17 Listed $105,000 Stellar MLS as Distributed by MLS Grid
- 2013-07-02 Sold (Public Records) $22,300 Public Records
- 2013-06-20 Sold (MLS) $22,250 Stellar MLS as Distributed by MLS Grid
- 2013-05-01 Listed $19,950 Stellar MLS as Distributed by MLS Grid
- 2013-02-22 Listing Removed — Stellar MLS as Distributed by MLS Grid
- 2012-12-21 Listed $24,900 Stellar MLS as Distributed by MLS Grid
- 2011-11-28 Listing Removed — Stellar MLS as Distributed by MLS Grid
- 2011-03-07 Listed $13,500 Stellar MLS as Distributed by MLS Grid
- 2003-11-13 Sold (Public Records) $40,000 Public Records
- 2002-09-27 Sold (Public Records) $36,000 Public Records
- 2001-02-19 Sold (Public Records) $30,000 Public Records
- 1994-09-28 Sold (Public Records) $30,000 Public Records
Property tax history
+13.1%/yrLatest (2025): $1,300 · +8.6% YoY. Source: county tax records.
Cash-flow waterfall
monthlySold comps — $/sqft
last 12 mo · ≤1 miLoading sold comps…