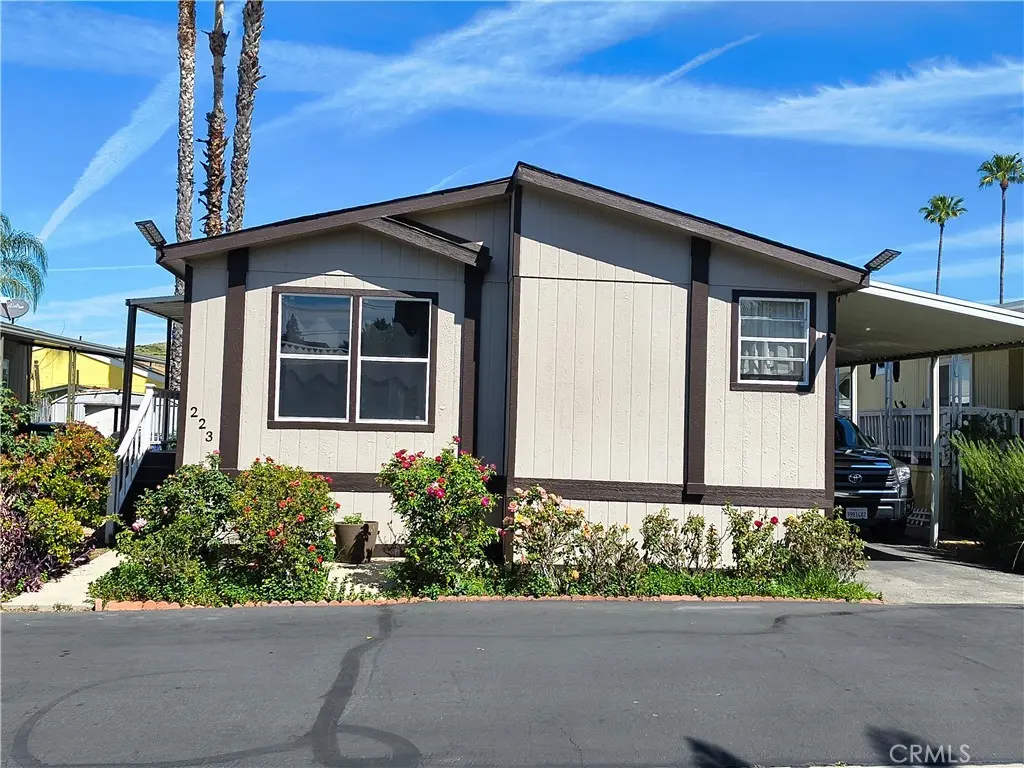
20401 Soledad Canyon Rd #223 · Santa Clarita, CA
Flood risk 3/10 · Minor
- FEMA flood zone
- X (unshaded)
- Chance of flooding over 30 yrs
- 0.17%
- Est. flood insurance / yr
- $507 – $1,088
Fire risk 8/10 · Major
- Est. fire insurance / yr
- $659 – $1,223
Heat risk 7/10 · Major
- Hot days now (above 99°F)
- 7 days/yr
- Hot days in 30 yrs
- 20 days/yr
Wind risk 1/10 · Minimal
- Chance of severe wind over 30 yrs
- —
Air-quality risk 6/10 · Moderate
- Unhealthy air days now
- 9 days/yr
- Unhealthy air days in 30 yrs
- 13 days/yr
Risk factors via First Street. Map © Google.
Why this score? — see what drove the C+ grade
The composite is a weighted blend of 9 inputs, each scored 0–100. Each bar is that input's sub-score; the figure is the points it added to the 100-point composite (weight × sub-score).
- Cash flow +26.0/30.0
- DSCR +8.7/10.0
- ARV discount +7.5/15.0
- Schools +5.9/10.0
- 1% rule +5.5/10.0
- Livability +3.5/5.0
- Rent growth +2.9/5.0
- Condition / age +2.5/5.0
- Appreciation +0.0/10.0
$294,999
🖨 Deal sheet 📄 Offer letter ✓ Due diligence
Listing remarks
This Double Manufactured manufacture home in Canyon Country home with newer interior and remodel 3-bedroom 2-bath approx. 1200 SQFT With Granite counter tops and beautiful tile. Dinning area & laminate wood floors through out. Tile bathrooms floor and newer cabinets. Central air and heat master bedroom walk in closet. Includes sewer-water trash maintenance security pool and jacuzzi, Spa/hot tub two clubhouses, basketball courts, playground and a community laundry room, covered carport for two cars, close to shopping centers and more.
Key facts
- Security pool
- Tile bathrooms floor
- Wood floors
Tags
Property features AI
Finance
- Other: Living area source: Assessor's data; Property condition described as turnkey; Parcel number on file; Mobile home dimensions listed
- Financial info: Land lease (park) — listed amount available in listing details
- HOA & community: Part of an association; Association provides water, sewer, pool, spa and trash; Community features include a park; Land lease in park (amount listed separately)
Exterior
- Parking: Covered parking; Carport; Parking available (park rules/manager approval may apply); Park name: Parklane States
- Security: Manager approval required for residency
- Utilities: 220V electric throughout; Public/district water; Public sewer (sewer connected); Natural gas available; Cable available
- Home design: Mobile home (24' x 52') — mobile home remains on site; Double body type; Single-story; Access road frontage
- Construction: Wood construction; Shingle roof; Assessor-provided year built; Single-story (1 total story)
- Exterior features: Covered patio; Pool (association, in-ground); Association spa (in-ground); Wire fencing; Level with street; Greenbelt
Interior
- Kitchen: Remodeled kitchen; Granite counters; Refrigerator included
- Bedrooms: Walk-in closet (bedroom feature)
- Flooring: Wood flooring
- Bathrooms: 2 full bathrooms; Remodeled bathrooms; Bathtub; Shower-in-tub
- Heating & cooling: Central cooling; Central furnace heating
- Interior features: Granite counters; Turnkey condition; One level; Ground-level entry (with steps); Walk-in closet; Living room; Family room; Laundry room; Association spa (in-ground)
- Laundry & utility: Washer included; Dryer included; Laundry in unit
Neighborhood map
What this means for you Summary
Snapshot
- This is a 3-bed/2.0-bath manufactured listed at $295k.
Deal economics
- At list price, monthly cash flow is $730 ($9k/yr) — positive.
- The deal already cash-flows at list — no discount required.
- Meets the 1% rule at list price ($3k rent vs $295k).
- Recommended offer: $277k (6.0% below list) — sets the bar for market timing.
- Cap rate 9.3% vs local median 2.8% in Santa Clarita — top-decile yield for the area; either an underpriced asset or a hidden risk that comps aren't pricing in. Stress-test before assuming the spread holds.
Location & tenants
- Location reads 70/100 on livability (#229 in CA) — a middle-class / working-renter tenant base. Strengths: employment A+, housing A, crime A-; Watch: amenities D+, cost of living F, health & safety F.
- William S. Hart Union High (suburban): math 52% / reading 72% proficiency, ranked #155 of 1,400 in CA (top 11%) — acceptable for families but not a draw, mixed tenant base, ~2y average lease; only 18% free/reduced lunch — higher-income household profile.
- Market conditions: Rents rising (+1.7%/yr); 106 active listings in the ZIP; 16 comparable units currently listed for rent nearby; rentals leasing fast (median 1d on market — plan ~1-2 weeks tenant-placement turnaround); high-income renter base; 19,697 units permitted in Los Angeles County in 2024 (9,426 in 5+ unit buildings).
- This rent runs 32% of the median local income ($115k/yr) — at the standard rent-burdened threshold; future hikes will face affordability resistance.
Forward outlook
- Local home prices are declining (-3.0%/yr); year-one equity from $2k of loan paydown is wiped out by about $9k of value loss. Plan a longer hold.
- Los Angeles County population projected at +9% by 2050 — modest demand growth; plan on rents tracking national, not racing it.
Negotiation context
- It's been on market 90 days — a 6% lower offer ($277k) is reasonable based on typical stale-listing flexibility.
- 2 sale attempts since 13y ago with the ask held roughly flat each time — persistent listings suggest the price (not the market) is what's stuck; bring a comps-based counter.
Risks & watch-outs
- Climate carrying-cost: severe wildfire risk; extreme-heat days projected 7→20/yr by 2055 (HVAC capex compounding) — expect insurance premiums to compound above CPI over the hold.
Questions for the listing agent
- It's been on market 90 days. Have you received any prior offers? Is the seller open to a 6% concession, seller financing, or rate buy-down credit?
- Why hasn't it sold? Are there any deal-killer items the seller is aware of (foundation, flood, title, zoning, code violations)?
- Is there a deadline driving the sale (1031 exchange, divorce, estate, relocation)? That informs how much negotiation room exists.
- Schools are B-rated — typically a magnet for longer-tenancy family renters. What's the average tenant stay here, and is there a school-zone premium baked into asking?
- What's the average days-on-market for RENTAL listings here right now (not sales)? A rising rental-DOM trend means longer vacancies and softer asking-rent achievability than the comps imply.
- What's the recent tenant-quality profile in this submarket — average credit score on applications, eviction rate, late-payment / NSF rate, and stable-employment percentage? A property-management company in the area should have these aggregated.
- How much new for-sale + rental construction is in the pipeline within 1–3 miles? Heavy new supply typically softens prices + rents 12–24 months out; constrained supply supports both.
Investment metrics
- 1% rule
- 1.05% ✓
- Cap rate
- 9.26%
- Cash-on-cash
- 10.61%
- DSCR
- 1.47
- GRM
- 7.9
CMA / ARV
- ARV (on-the-fly)
- $187,200
- Comps found
- 9
Show comp detail 9 sales within ~0.75 mi
| Address | Dist | Beds/Ba | Sqft | Sold | Price | $/sf | Match |
|---|---|---|---|---|---|---|---|
| 20401 Soledad Canyon Rd #114 | 0.00mi | 3/2.0 | 1,176 (-2%) | 4mo | $184,000 | $156 | 94 |
| 20401 Soledad Cyn #355 | 0.00mi | 3/2.0 | 1,248 (+4%) | 1mo | $224,000 | $179 | 92 |
| 20401 Soledad Canyon Rd #451 | 0.00mi | 3/2.0 | 1,176 (-2%) | 7mo | $157,000 | $134 | 91 |
| 20401 Soledad Canyon Rd #126 | 0.00mi | 3/2.0 | 1,224 (+2%) | 8mo | $130,000 | $106 | 90 |
| 20401 Soledad Cyn #139 | 0.00mi | 4/2.0 (+1) | 1,080 (-10%) | 0mo | $200,000 | $185 | 78 |
| 20401 Soledad Canyon Rd #511 | 0.00mi | 3/2.0 | 1,050 (-12%) | 4mo | $229,000 | $218 | 75 |
| 20401 Soledad Canyon Rd #342 | 0.00mi | 3/2.0 | 1,344 (+12%) | 8mo | $210,000 | $156 | 74 |
| 20401 Soledad Canyon Rd #247 | 0.30mi | 2/2.0 (-1) | 1,248 (+4%) | 8mo | $155,000 | $124 | 68 |
| 20401 Soledad Canyon Rd #690 | 0.00mi | 3/2.0 | 1,344 (+12%) | 15mo | $240,400 | $179 | 67 |
Match score weights: distance 35% · size 25% · config 20% · recency 20%. Top-matched comps best support the ARV.
Projected returns pro-forma
-3.0% appreciation · 1.7% rent growth · sell at horizon
- IRR
- -1.8%
- Equity multiple
- 0.93×
- Total profit
- $-5,464
- Equity at exit
- $43,985
- IRR
- 6.6%
- Equity multiple
- 1.47×
- Total profit
- $38,482
- Equity at exit
- $25,506
Cash invested: $82,600 (down + closing). Projections, not guarantees.
Landlord ↔ Tenant lean methodology
- Overall (STATE)
- 18 Strongly Tenant-Friendly
- State California
- 18 Strongly Tenant-Friendly · D+13
- County
- — inherits STATE
- City
- — inherits STATE
ZIP-level market 91351
- Rents YoY
- 1.7%
- Active inventory
- 106
- Price-to-rent
- 7.9×
Monthly cashflow live
- Estimated rent
- $3,107 high interval (Pro) →
- Mortgage (P&I)
- −$1,547
- Tax from tax record
- −$54 /mo · $654/yr
- Insurance
- −$123
- HOA
- −$0
- Vacancy / Maint / Mgmt
- −$652
- Net cashflow
- $730
Break-even live
UW: 25.0% down · 7.5% · 30yr · 1.5% tax · 5.0% vac · 8.0% maint · 8.0% mgmt
Financing live
Cash to close
- Down payment
- $73,750
- Closing costs
- $8,850
- Reserves months
- —
- Total cash needed
- —
Loan-product check · same deal, 3 products live
Conventional
25% down · 7.5% · 30yr
- Down + closing
- —
- Monthly P&I
- —
- Monthly cashflow
- —
- DSCR
- —
- Eligible?
- —
Personal DTI + credit; lowest rate.
DSCR
20% down · 8.5% · 30yr
- Down + closing
- —
- Monthly P&I
- —
- Monthly cashflow
- —
- DSCR
- —
- Eligible?
- —
No personal income docs; deal must DSCR.
Hard money
10% down · 12.0% · 12mo
- Down + closing
- —
- Monthly P&I
- —
- Monthly cashflow
- —
- DSCR
- —
- Eligible?
- —
Short-term bridge; refi at stabilization.
Rent comps 16 comps
| Address | Beds | Baths | Sqft | Rent | $/sqft | DOM | Units | Dist |
|---|---|---|---|---|---|---|---|---|
| 26955 Rainbow Glen Dr Santa Clarita, CA | 3.0 | 2.0 | 1007 | $2,850 | $2.83 | 1d | 1 | 0.21mi |
| 26941 Rainbow Glen Dr #751 Canyon Country, CA | 2.0 | 2.0 | 907 | $2,900 | $3.20 | 1d | 1 | 0.22mi |
| 26842 Claudette St #204 Canyon Country, CA | 2.0 | 2.0 | 964 | $2,650 | $2.75 | 1d | 1 | 0.24mi |
| 20345 Rue Crevier Santa Clarita, CA | 2.0 | 2.0 | 907 | $2,700 | $2.98 | 1d | 1 | 0.28mi |
| 26921 Flo Ln Canyon Country, CA | 3.0 | 2.0 | 1107 | $2,950 | $2.66 | 1d | 1 | 0.29mi |
| 26956 Flo Ln #338 Canyon Country, CA | 2.0 | 2.0 | 1064 | $2,875 | $2.70 | 1d | 1 | 0.33mi |
| 26901 Rainbow Glen Dr Santa Clarita, CA | 3.0 | 2.0 | 1001 | $2,950 | $2.95 | 1d | 1 | 0.33mi |
| 26741 Isabella Pkwy Canyon Country, CA | 1.0–2.0 | 1.0–2.0 | 850 | $2,989 | $3.52 | 1d | 3 | 0.33mi |
| 27301 Whites Canyon Rd Canyon Country, CA | 2.0 | 2.0 | 900 | $1,995 | $2.22 | 17d | 2 | 1.13mi |
| 28040 Ermine Pl Canyon Country, CA | 4.0 | 2.0 | 1467 | $4,250 | $2.90 | 1d | 1 | 1.15mi |
| 19300 Maybrook LN Santa Clarita, CA | 1.0–3.0 | 1.0–2.0 | 1017 | $3,744 | $3.68 | 1d | 61 | 1.24mi |
| 26379 Rainbow Glen Dr Newhall, CA | 3.0 | 2.0 | 1427 | $3,600 | $2.52 | 1d | 1 | 1.27mi |
| 28085 Whites Canyon Rd Canyon Country, CA | 1.0–2.0 | 1.0–2.0 | 714 | $2,100 | $2.94 | 1d | 7 | 1.32mi |
| 19028 Drycliff St Unit C Canyon Country, CA | 3.0 | 1.5 | 982 | $3,600 | $3.67 | 2d | 1 | 1.36mi |
| 27077 Hidaway Ave Canyon Country, CA | 2.0 | 1.0 | 960 | $2,400 | $2.50 | 1d | 1 | 1.43mi |
| 26265 Rainbow Glen Dr Newhall, CA | 3.0 | 3.0 | 1469 | $3,500 | $2.38 | 1d | 1 | 1.46mi |
Listing history 20 events
-
2026-06-18days on market $294,999 Active 90 DOM
-
2026-06-17days on market $294,999 Active 89 DOM
-
2026-06-16days on market $294,999 Active 88 DOM
-
2026-06-15days on market $294,999 Active 87 DOM
-
2026-06-13days on market $294,999 Active 85 DOM
-
2026-06-13days on market $294,999 Active 84 DOM
-
2026-06-09days on market $294,999 Active 81 DOM
-
2026-06-08days on market $294,999 Active 80 DOM
-
2026-06-07days on market $294,999 Active 79 DOM
-
2026-06-04days on market $294,999 Active 76 DOM
-
2026-06-03days on market $294,999 Active 75 DOM
-
2026-06-02days on market $294,999 Active 74 DOM
-
2026-06-01days on market $294,999 Active 73 DOM
-
2026-05-31days on market $294,999 Active 72 DOM
-
2026-05-20price $294,999
-
2026-03-20$299,999 Active
-
2013-06-28historical
-
2013-05-21price $48,000
-
2013-04-11price $63,500
-
2013-04-05$75,000 Active
ⓘ Source: listings_history table (triggers on properties + properties_extension) + one-shot
backfill from property_details.listing_events for pre-trigger history.
Tax reassessment forecast CA · Resets to sale price
- Current annual tax
- $654 · $54/mo
- Projected year-2 tax
- $2,242 · $187/mo
- Expected delta
- +$1,588/yr (+$132/mo · 243.0%)
ⓘ Screening estimate from a state-policy table — verify with the county assessor before closing.
Climate risk First Street
- Flood 3/10 Moderate FEMA zone X (unshaded) · 17% chance over 30 yrs
- Wildfire 8/10 Severe
- Heat 7/10 Severe 7 d/yr ≥99°F today · 20 d/yr by 30 yrs out
- Wind 1/10 Low
- Air quality 6/10 Major 9 unhealthy d/yr today · 13 by 30 yrs out
Nearby sold comps map
Loading sold comps map…
Walkable amenities ~0.75 mi
Loading nearby amenities…
Taxation est. · year 1
- Rental income
- $37,283
- − Mortgage interest
- −$16,525
- − Property taxes
- −$654
- − Insurance
- −$1,475
- − Repairs & maintenance
- −$2,983
- − Management
- −$2,983
- − Depreciation
- −$8,582
- Taxable income
- $4,082
- Est. tax owed @ 24.0%
- −$980
- After-tax cash flow
- $7,781/yr
For passive investors: Depreciation is non-cash, so a rental often shows a tax loss while cash-flowing — sheltering income. Rental losses are passive: they offset passive income freely, and up to $25,000/yr can offset ordinary (W-2) income if you actively participate and your MAGI is under $100k (phasing out to $0 by $150k); unused losses carry forward. On sale, claimed depreciation is recaptured at up to 25%, and gains may owe capital-gains tax (a 1031 exchange can defer both). Figures are a year-1 estimate at your 24.0% rate — not tax advice; consult a CPA.
Schools (NCES district)
- District
- William S. Hart Union High
- NCES district ID
- 0642510
- Math proficiency
- 52% ▬ 0.00%
- Reading proficiency
- 72% ▲ 1.00%
- Median HH income
- $95,844
- Composite
- 58.6/100
- National rank
- #2030
- State rank
- #155 of 1400 in CA
Livability — Santa Clarita
- Score
- 70/100
- State rank
- #229
- US rank
- #7378
Category grades
Schools grade is shown separately in the Schools card above.
Census & demographics
- Census place
- Santa Clarita, CA
- County
- Los Angeles County · 9,444,647 people
- City population
- 219,066
- Metro
- Los Angeles-Long Beach-Anaheim, CA
- Population (ZIP)
- 33,155
- Household income
- $115,364
- Rent vs Own
- Severe rent burden
- 784.0
Population outlook (Los Angeles County) Hauer SSP2
- Today (2025)
- 10,940,515 people
- By 2030
- 11,256,481 · +2.9%
- By 2040
- 11,729,929 · +7.2%
- By 2050
- 11,948,407 · +9.2%
- By 2075
- 11,818,114 · +8.0%
- By 2100
- 10,842,928 · -0.9%
Race, ethnicity, and origin ACS 2023
- Neighborhood character
- Diverse neighborhood (Simpson 0.64)
- Race & ethnicity
- Hispanic / Latino 49% White 34% Two or more races 21% Asian 6% Black 4% Native American 1%
- Hispanic origin (detail)
- Mexican 36%
- Common ancestry
- Romanian 1% Lithuanian 1% Scotch-Irish 1%
- Foreign-born
- 23% · Canada, Jamaica, South Korea
- Languages at home
- 54% English-only · Spanish 35% Other Indo-European 3% Tagalog/Filipino 2%
Political lean MEDSL · Los Angeles
- 2024 margin
- Solid D (+32.9) · D 64.8% · R 31.9% · Other 3.3%
- 2008→2024 swing
- -7.4pp toward R · 2008: 40.4pp · 2024: 32.9pp
- All cycles
- 2024: D+32.9 2020: D+44.2 2016: D+48.0 2012: D+40.0 2008: D+40.4
Not yet ingested
- Civics
- —
Market trends
- HPI YoY
- ▼ -703.16%
- Current HPI
- 360.9901
- Rent YoY
- ▲ 1.70%
- Metro
- Los Angeles-Long Beach-Anaheim, CA
- State GDP YoY
- ▲ 3.21%
- F500 in state
- 116
Industry mix (Fortune 500 HQ in CA)
| Industry | F500 HQs | Revenue |
|---|---|---|
| Technology | 27 | $1,492B |
|
||
| Financial Services | 3 | $174B |
|
||
| Retail | 3 | $44B |
|
||
| Insurance | 3 | $26B |
|
||
| Media / Entertainment | 2 | $115B |
|
||
| Pharmaceuticals / Biotech | 2 | $62B |
|
||
Price history
+293.3% since first listed6 events — show timeline
- 2026-05-20 Price Changed $294,999 CRMLS
- 2026-03-20 Listed $299,999 CRMLS
- 2013-06-28 Listing Removed — CRMLS
- 2013-05-21 Price Changed $48,000 CRMLS
- 2013-04-11 Price Changed $63,500 CRMLS
- 2013-04-05 Listed $75,000 CRMLS
Property tax history
+4.1%/yrLatest (2025): $654 · +4.1% YoY. Source: county tax records.
Cash-flow waterfall
monthlySold comps — $/sqft
last 12 mo · ≤1 miLoading sold comps…