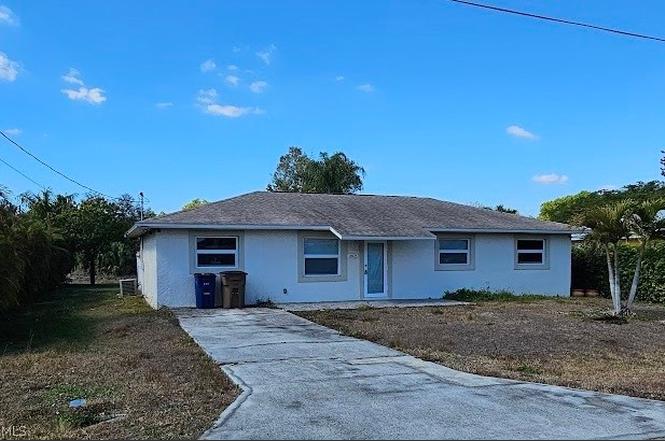
2825 E Cypress Ave · Fort Myers Shores, FL
Flood risk 3/10 · Minor
- FEMA flood zone
- X (shaded)
- Chance of flooding over 30 yrs
- 0.07%
- Est. flood insurance / yr
- $507 – $1,088
Fire risk 3/10 · Minor
- Est. fire insurance / yr
- $947 – $1,759
Heat risk 10/10 · Severe
- Hot days now (above 107°F)
- 7 days/yr
- Hot days in 30 yrs
- 29 days/yr
Wind risk 10/10 · Severe
- Chance of severe wind over 30 yrs
- 99.0%
Air-quality risk 2/10 · Minimal
- Unhealthy air days now
- 1 days/yr
- Unhealthy air days in 30 yrs
- 1 days/yr
Risk factors via First Street. Map © Google.
Why this score? — see what drove the C+ grade
The composite is a weighted blend of 9 inputs, each scored 0–100. Each bar is that input's sub-score; the figure is the points it added to the 100-point composite (weight × sub-score).
- Cash flow +24.2/30.0
- ARV discount +15.0/15.0
- DSCR +7.8/10.0
- 1% rule +5.0/10.0
- Schools +4.1/10.0
- Livability +3.5/5.0
- Condition / age +2.5/5.0
- Rent growth +1.8/5.0
- Appreciation +0.0/10.0
$185,000
🖨 Deal sheet 📄 Offer letter ✓ Due diligence
Listing remarks MLS
Perfect starter home or perfect for the investor. Located just off of hiway 80 in Fort Myers Shores. Being sold AS IS, Bank addendum to follow after acceptance of offer. Please use FAR BAR AS IS Contract.
Key facts
- Large concrete patio
- Spacious backyard
- Drainage canal
Tags
Property features AI
Finance
- Financial info: Pets allowed
- HOA & community: No association fee
Exterior
- Utilities: Public water; Public sewer; Cable available; High-speed internet available
- Home design: Single-story; Resale property; Faces east; RS-1 zoning
- Construction: Block, concrete and stucco construction; Shingle roof
- Exterior features: Open patio and porch; Patio; Porch; Room for pool; Canal access (waterfront); West exposure; Irregular lot
Interior
- Flooring: Tile
- Bathrooms: 1 full bathroom
- Heating & cooling: Central heating (electric); Central air (electric)
- Interior features: Living/dining room; Separate shower; Shower only; Split bedrooms; Single hung windows; Unfurnished
- Laundry & utility: Laundry inside
Neighborhood map
What this means for you Summary
Snapshot
- This is a 3-bed/1.0-bath single-family listed at $185k.
Deal economics
- At list price, monthly cash flow is $369 ($4k/yr) — positive.
- The deal already cash-flows at list — no discount required.
- Meets the 1% rule at list price ($2k rent vs $185k).
- Recommended offer: $174k (6.0% below list) — sets the bar for market timing.
- Cap rate 8.7% vs local median 3.1% in Fort Myers Shores — top-decile yield for the area; either an underpriced asset or a hidden risk that comps aren't pricing in. Stress-test before assuming the spread holds.
Location & tenants
- Location reads 70/100 on livability (#433 in FL) — a middle-class / working-renter tenant base. Strengths: cost of living A+, housing A+, crime B; Watch: schools F, amenities F, commute F.
- Lee (suburban): math 47% / reading 50% proficiency, ranked #42 of 73 in FL (top 58%) — families likely to look elsewhere, expect single-tenant / working-renter base with shorter leases.
- Market conditions: Rents soft (-3.0%/yr); 763 active listings in the ZIP; 23 comparable units currently listed for rent nearby; rentals at typical pace (median 21d on market — plan ~3-4 weeks tenant-placement turnaround); 15,411 units permitted in Lee County in 2024 (4,686 in 5+ unit buildings).
- This rent runs 31% of the median local income ($72k/yr) — at the standard rent-burdened threshold; future hikes will face affordability resistance.
Forward outlook
- Local home prices are declining (-3.0%/yr); year-one equity from $1k of loan paydown is wiped out by about $6k of value loss. Plan a longer hold.
- Lee County population projected at +44% by 2050 — long-run rental-demand tailwind backs the buy-and-hold thesis.
Negotiation context
- It's been on market 75 days — a 6% lower offer ($174k) is reasonable based on typical stale-listing flexibility.
- Current owner paid $68k; list at $185k implies a 170% gain — meaningful room to come down on a strong offer.
Risks & watch-outs
- Climate carrying-cost: severe wind risk, 99% chance of damaging wind over 30y; extreme-heat days projected 7→29/yr by 2055 (HVAC capex compounding) — expect insurance premiums to compound above CPI over the hold.
Questions for the listing agent
- It's been on market 75 days. Have you received any prior offers? Is the seller open to a 6% concession, seller financing, or rate buy-down credit?
- Why hasn't it sold? Are there any deal-killer items the seller is aware of (foundation, flood, title, zoning, code violations)?
- Is there a deadline driving the sale (1031 exchange, divorce, estate, relocation)? That informs how much negotiation room exists.
- Schools are F-rated, which usually means shorter tenancies and higher turnover. Who's the typical renter profile here, and what's been the actual vacancy rate?
- What's the average days-on-market for RENTAL listings here right now (not sales)? A rising rental-DOM trend means longer vacancies and softer asking-rent achievability than the comps imply.
- What's the recent tenant-quality profile in this submarket — average credit score on applications, eviction rate, late-payment / NSF rate, and stable-employment percentage? A property-management company in the area should have these aggregated.
- How much new for-sale + rental construction is in the pipeline within 1–3 miles? Heavy new supply typically softens prices + rents 12–24 months out; constrained supply supports both.
Investment metrics
- 1% rule
- 1.00% ✓
- Cap rate
- 8.69%
- Cash-on-cash
- 8.55%
- DSCR
- 1.38
- GRM
- 8.3
CMA / ARV
- ARV (on-the-fly)
- $238,680
- Comps found
- 7
Show comp detail 7 sales within ~0.75 mi
| Address | Dist | Beds/Ba | Sqft | Sold | Price | $/sf | Match |
|---|---|---|---|---|---|---|---|
| 13820 2nd St | 0.62mi | 3/2.0 | 1,118 (+4%) | 11mo | $275,000 | $246 | 52 |
| 12379 Fourth St | 0.65mi | 3/1.0 | 988 (-8%) | 10mo | $200,000 | $202 | 47 |
| 2350 Poinciana Blvd | 0.39mi | 3/1.0 | 982 (-9%) | 24mo | $235,000 | $239 | 47 |
| 12602 2nd St | 0.52mi | 3/1.0 | 1,004 (-7%) | 22mo | $225,000 | $224 | 46 |
| 2330 Caladium Rd | 0.42mi | 2/2.0 (-1) | 1,220 (+13%) | 7mo | $187,500 | $154 | 44 |
| 12373 Fourth St | 0.66mi | 3/2.0 | 1,176 (+9%) | 20mo | $259,999 | $221 | 34 |
| 2107 Parker Ave | 0.60mi | 2/1.5 (-1) | 975 (-10%) | 21mo | $195,000 | $200 | 32 |
Match score weights: distance 35% · size 25% · config 20% · recency 20%. Top-matched comps best support the ARV.
Projected returns pro-forma
-3.0% appreciation · 0.0% rent growth · sell at horizon
- IRR
- -6.4%
- Equity multiple
- 0.77×
- Total profit
- $-11,973
- Equity at exit
- $27,584
- IRR
- -0.5%
- Equity multiple
- 0.97×
- Total profit
- $-1,458
- Equity at exit
- $15,995
Cash invested: $51,800 (down + closing). Projections, not guarantees.
Landlord ↔ Tenant lean methodology
- Overall (STATE)
- 87 Strongly Landlord-Friendly
- State Florida
- 87 Strongly Landlord-Friendly · R+3
- County
- — inherits STATE
- City
- — inherits STATE
ZIP-level market 33905
- Home prices YoY
- -31.4%
- Rents YoY
- -3.0%
- Active inventory
- 763
- Price-to-rent
- 8.3×
Monthly cashflow live
- Estimated rent
- $1,851 high interval (Pro) →
- Mortgage (P&I)
- −$970
- Tax from tax record
- −$46 /mo · $548/yr
- Insurance
- −$77
- HOA
- −$0
- Vacancy / Maint / Mgmt
- −$389
- Net cashflow
- $369
Break-even live
UW: 25.0% down · 7.5% · 30yr · 1.5% tax · 5.0% vac · 8.0% maint · 8.0% mgmt
Financing live
Cash to close
- Down payment
- $46,250
- Closing costs
- $5,550
- Reserves months
- —
- Total cash needed
- —
Loan-product check · same deal, 3 products live
Conventional
25% down · 7.5% · 30yr
- Down + closing
- —
- Monthly P&I
- —
- Monthly cashflow
- —
- DSCR
- —
- Eligible?
- —
Personal DTI + credit; lowest rate.
DSCR
20% down · 8.5% · 30yr
- Down + closing
- —
- Monthly P&I
- —
- Monthly cashflow
- —
- DSCR
- —
- Eligible?
- —
No personal income docs; deal must DSCR.
Hard money
10% down · 12.0% · 12mo
- Down + closing
- —
- Monthly P&I
- —
- Monthly cashflow
- —
- DSCR
- —
- Eligible?
- —
Short-term bridge; refi at stabilization.
Rent comps 23 comps
| Address | Beds | Baths | Sqft | Rent | $/sqft | DOM | Units | Dist |
|---|---|---|---|---|---|---|---|---|
| 13214 1st St Fort Myers, FL | 4.0 | 2.0 | 1405 | $2,000 | $1.42 | 3d | 1 | 0.09mi |
| 2804 River Ridge Blvd Fort Myers, FL | 2.0 | 2.0 | 1404 | $1,350 | $0.96 | 23d | 1 | 0.17mi |
| 12941 1st St #943 Fort Myers, FL | 2.0 | 1.0 | 875 | $1,350 | $1.54 | 23d | 1 | 0.22mi |
| 13208 Fourth St Fort Myers, FL | 3.0 | 1.0 | 1103 | $1,500 | $1.36 | 3d | 1 | 0.23mi |
| 12937 Fourth St Fort Myers, FL | 2.0 | 1.0 | 1236 | $1,900 | $1.54 | 23d | 1 | 0.30mi |
| 12607 1st St Fort Myers, FL | 2.0 | 1.0 | 798 | $1,200 | $1.50 | 23d | 1 | 0.43mi |
| 2231 Lotus Rd Fort Myers, FL | 3.0 | 2.0 | 1312 | $1,885 | $1.44 | 3d | 1 | 0.46mi |
| 2143 W Tobago Cir Fort Myers, FL | 3.0 | 2.0 | 1326 | $1,800 | $1.36 | 23d | 1 | 0.48mi |
| 12619 Third St Fort Myers, FL | 3.0 | 1.0 | 1015 | $1,950 | $1.92 | 23d | 1 | 0.48mi |
| 13832 1st St Fort Myers, FL | 3.0 | 2.0 | 1164 | $1,900 | $1.63 | 14d | 1 | 0.66mi |
| 13861 First St Unit 13863 Fort Myers, FL | 2.0 | 1.0 | 875 | $1,400 | $1.60 | 23d | 1 | 0.71mi |
| 12274 1st St Fort Myers, FL | 3.0 | 1.0 | 1014 | $1,495 | $1.47 | 3d | 1 | 0.75mi |
| 12274 1st St Fort Myers, FL | 3.0 | 1.0 | 1014 | $1,545 | $1.52 | 16d | 1 | 0.75mi |
| 13926 1st St Fort Myers, FL | 3.0 | 1.0 | 982 | $1,550 | $1.58 | 16d | 1 | 0.77mi |
| 13650 Caribbean Blvd Fort Myers, FL | 3.0 | 1.0 | 1040 | $1,700 | $1.63 | 21d | 1 | 0.92mi |
| 3071 Meandering Way #101 Fort Myers, FL | 2.0 | 2.0 | 1421 | $3,000 | $2.11 | 23d | 1 | 1.02mi |
| 3111 Meandering Way #101 Fort Myers, FL | 2.0 | 2.0 | 1421 | $2,700 | $1.90 | 23d | 1 | 1.07mi |
| 2510 Barcelona Ave Fort Myers, FL | 4.0 | 2.0 | 1257 | $1,870 | $1.49 | 3d | 1 | 1.16mi |
| 14093 Oviedo Pl Fort Myers, FL | 3.0 | 2.0 | 1378 | $1,850 | $1.34 | 16d | 1 | 1.27mi |
| 15688 Spring Line Ln Fort Myers, FL | 3.0 | 2.0 | 1474 | $1,840 | $1.25 | 23d | 1 | 1.32mi |
| 15624 Sunny Crest Ln Fort Myers, FL | 3.0 | 2.0 | 1290 | $1,776 | $1.38 | 11d | 1 | 1.35mi |
| 14236 Oviedo Pl Fort Myers, FL | 3.0 | 2.5 | 1378 | $1,895 | $1.38 | 23d | 1 | 1.46mi |
| 14297 Oviedo Pl Fort Myers, FL | 3.0 | 2.5 | 1378 | $1,795 | $1.30 | 3d | 1 | 1.46mi |
Listing history 9 events
-
2026-05-05status Pending
-
2026-02-19$185,000 Active
-
2013-09-17price $32,500 204-char remark
Show marketing remark (204 chars)
Perfect starter home or perfect for the investor. Located just off of hiway 80 in Fort Myers Shores. Being sold AS IS, Bank addendum to follow after acceptance of offer. Please use FAR BAR AS IS Contract.
-
2010-10-14soldstatus $68,407
-
2009-07-22soldstatus $35,000 204-char remark
Show marketing remark (204 chars)
Perfect starter home or perfect for the investor. Located just off of hiway 80 in Fort Myers Shores. Being sold AS IS, Bank addendum to follow after acceptance of offer. Please use FAR BAR AS IS Contract.
-
2005-09-16soldstatus $182,100
-
2001-07-10soldstatus $63,000
-
2001-07-10soldstatus $63,000
-
1984-12-01soldstatus $7,000
ⓘ Source: listings_history table (triggers on properties + properties_extension) + one-shot
backfill from property_details.listing_events for pre-trigger history.
Tax reassessment forecast FL · Resets to sale price
- Current annual tax
- $548 · $46/mo
- Projected year-2 tax
- $1,536 · $128/mo
- Expected delta
- +$988/yr (+$82/mo · 180.3%)
ⓘ Screening estimate from a state-policy table — verify with the county assessor before closing.
Climate risk First Street
- Flood 3/10 Moderate FEMA zone X (shaded) · 7% chance over 30 yrs
- Wildfire 3/10 Moderate
- Heat 10/10 Extreme 7 d/yr ≥107°F today · 29 d/yr by 30 yrs out
- Wind 10/10 Extreme 99% chance of damaging wind over 30 yrs
- Air quality 2/10 Low 1 unhealthy d/yr today · 1 by 30 yrs out
Nearby sold comps map
Loading sold comps map…
Walkable amenities ~0.75 mi
Loading nearby amenities…
Taxation est. · year 1
- Rental income
- $22,209
- − Mortgage interest
- −$10,363
- − Property taxes
- −$548
- − Insurance
- −$925
- − Repairs & maintenance
- −$1,777
- − Management
- −$1,777
- − Depreciation
- −$5,382
- Taxable income
- $1,438
- Est. tax owed @ 24.0%
- −$345
- After-tax cash flow
- $4,085/yr
For passive investors: Depreciation is non-cash, so a rental often shows a tax loss while cash-flowing — sheltering income. Rental losses are passive: they offset passive income freely, and up to $25,000/yr can offset ordinary (W-2) income if you actively participate and your MAGI is under $100k (phasing out to $0 by $150k); unused losses carry forward. On sale, claimed depreciation is recaptured at up to 25%, and gains may owe capital-gains tax (a 1031 exchange can defer both). Figures are a year-1 estimate at your 24.0% rate — not tax advice; consult a CPA.
Schools (NCES district)
- District
- Lee
- NCES district ID
- 1201080
- Math proficiency
- 47% ▼ -11.00%
- Reading proficiency
- 50% ▼ -4.00%
- Median HH income
- $49,518
- Composite
- 41.49/100
- National rank
- #3458
- State rank
- #42 of 73 in FL
Livability — Fort Myers Shores
- Score
- 70/100
- State rank
- #433
- US rank
- #7747
Category grades
Schools grade is shown separately in the Schools card above.
Census & demographics
- Census place
- Fort Myers Shores, FL
- County
- Lee County · 788,662 people
- Metro
- Cape Coral-Fort Myers, FL
- Population (ZIP)
- 41,381
- Household income
- $71,987
- Rent vs Own
- Severe rent burden
- 1358.0
Population outlook (Lee County) Hauer SSP2
- Today (2025)
- 871,946 people
- By 2030
- 955,468 · +9.6%
- By 2040
- 1,113,587 · +27.7%
- By 2050
- 1,256,891 · +44.1%
- By 2075
- 1,560,270 · +78.9%
- By 2100
- 1,726,848 · +98.0%
Race, ethnicity, and origin ACS 2023
- Neighborhood character
- Diverse neighborhood (Simpson 0.59)
- Race & ethnicity
- White 53% Hispanic / Latino 34% Two or more races 17% Black 9% Native American 4% Asian 2%
- Hispanic origin (detail)
- Mexican 11% Puerto Rican 5% Cuban 2%
- Common ancestry
- Romanian 2% Slovak 2% Lithuanian 2%
- Foreign-born
- 20% · Canada, Jamaica
- Languages at home
- 68% English-only · Spanish 29% Other Indo-European 1% German/W. Germanic 1%
Political lean MEDSL · Lee
- 2024 margin
- Strong R (+28.4) · D 35.5% · R 63.9%
- 2008→2024 swing
- -18.0pp toward R · 2008: -10.4pp · 2024: -28.4pp
- All cycles
- 2024: R+28.4 2020: R+19.2 2016: R+20.4 2012: R+16.6 2008: R+10.4
Not yet ingested
- Civics
- —
Market trends
- HPI YoY
- ▼ -122.89%
- Current HPI
- 268.4598
- Rent YoY
- ▼ -2.97%
- Metro
- Cape Coral-Fort Myers, FL
- State GDP YoY
- ▲ 3.28%
- F500 in state
- 36
Industry mix (Fortune 500 HQ in FL)
| Industry | F500 HQs | Revenue |
|---|---|---|
| Industrial Technology | 2 | $29B |
|
||
| Insurance | 2 | $17B |
|
||
| Retail | 1 | $60B |
|
||
| Technology Distribution | 1 | $58B |
|
||
| Homebuilding | 1 | $35B |
|
||
| Technology Manufacturing | 1 | $35B |
|
||
Price history
+2542.9% since first listed9 events — show timeline
- 2026-05-05 Pending — FORTMLS
- 2026-02-19 Listed $185,000 FORTMLS
- 2013-09-17 Price Changed $32,500 FORTMLS
- 2010-10-14 Sold (Public Records) $68,407 Public Records
- 2009-07-22 Sold (MLS) $35,000 FORTMLS
- 2005-09-16 Sold (Public Records) $182,100 Public Records
- 2001-07-10 Sold (Public Records) $63,000 Public Records
- 2001-07-10 Sold (Public Records) $63,000 Public Records
- 1984-12-01 Sold (Public Records) $7,000 Public Records
Property tax history
+5.6%/yrLatest (2025): $548 · +10.9% YoY. Source: county tax records.
Cash-flow waterfall
monthlySold comps — $/sqft
last 12 mo · ≤1 miLoading sold comps…