 🏗️ New Construction
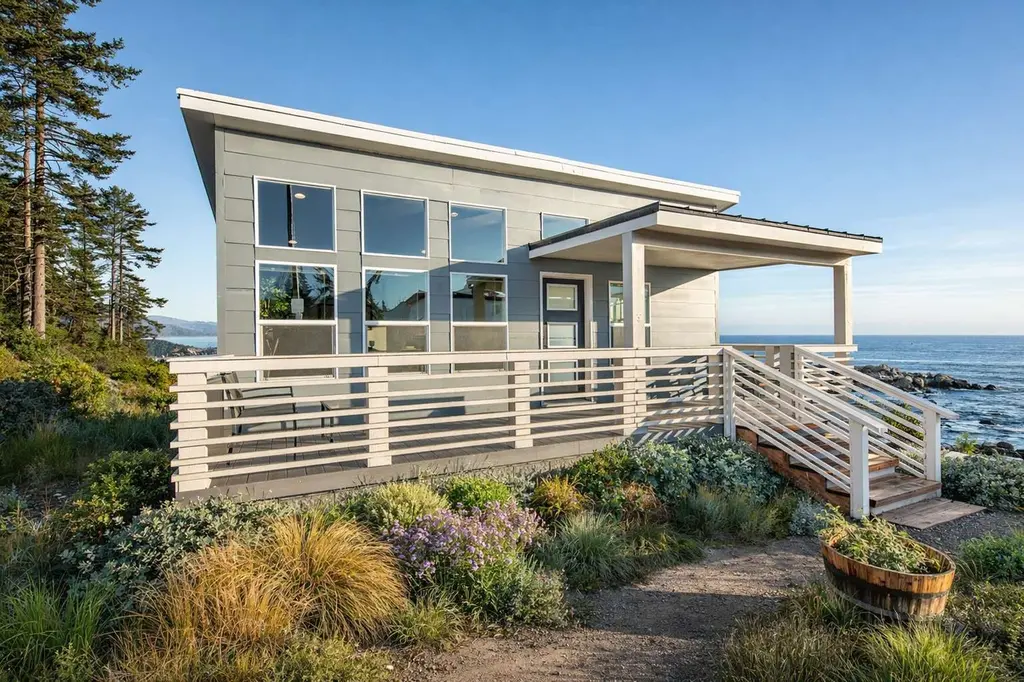
The Pacific Plan · Carlsborg, WA
Flood risk 1/10 · Minimal
- FEMA flood zone
- X
- Chance of flooding over 30 yrs
- 0.0%
- Est. flood insurance / yr
- $507 – $1,088
Fire risk 1/10 · Minimal
- Est. fire insurance / yr
- $604 – $1,122
Heat risk 2/10 · Minimal
- Hot days now (above 83°F)
- 7 days/yr
- Hot days in 30 yrs
- 18 days/yr
Wind risk 1/10 · Minimal
- Chance of severe wind over 30 yrs
- —
Air-quality risk 6/10 · Moderate
- Unhealthy air days now
- 7 days/yr
- Unhealthy air days in 30 yrs
- 8 days/yr
Risk factors via First Street. Map © Google.
Why this score? — see what drove the F grade
The composite is a weighted blend of 9 inputs, each scored 0–100. Each bar is that input's sub-score; the figure is the points it added to the 100-point composite (weight × sub-score).
- ARV discount +7.5/15.0
- Schools +5.3/10.0
- Condition / age +4.0/5.0
- Livability +3.0/5.0
- Cash flow +2.8/30.0
- Rent growth +2.5/5.0
- 1% rule +0.0/10.0
- DSCR +0.0/10.0
- Appreciation +0.0/10.0
$189,000
🖨 Deal sheet 📄 Offer letter ✓ Due diligence
Listing remarks MLS
Value oriented small double section home with big features including spacious living room open to modern kitchen/dining room; large master bedroom with half bath; king size second bedroom and full master bath; available optional covered porch at front entry.
Key facts
- Large master bedroom
- Spacious living room
- Full master bath
Tags
Neighborhood map
What this means for you Summary
Snapshot
- This is a 2-bed/2.0-bath single-family listed at $189k. Condition is rated good.
Deal economics
- At list price, monthly cash flow is $-1k ($-17k/yr) — negative.
- The deal already cash-flows at list — no discount required.
- Meets the 1% rule at list price ($2k rent vs $189k).
- Recommended offer: $178k (6.0% below list) — sets the bar for market timing.
Location & tenants
- Location reads 59/100 on livability (#493 in WA) — a working-class tenant base; expect higher turnover. Strengths: cost of living A+, housing A+; Watch: employment D, health & safety D, crime D-.
- Sequim School District (town): math 55% / reading 66% proficiency, ranked #64 of 291 in WA (top 22%) — acceptable for families but not a draw, mixed tenant base, ~2y average lease.
- Market conditions: 605 active listings in the ZIP; 166 units permitted in Clallam County in 2024 (0 in 5+ unit buildings).
- This rent runs 31% of the median local income ($74k/yr) — at the standard rent-burdened threshold; future hikes will face affordability resistance.
Forward outlook
- Local home prices are declining (-3.0%/yr); year-one equity from $3k of loan paydown is wiped out by about $13k of value loss. Plan a longer hold.
- Clallam County population projected at +5% by 2050 — modest demand growth; plan on rents tracking national, not racing it.
Negotiation context
- It's been on market 84 days — a 6% lower offer ($178k) is reasonable based on typical stale-listing flexibility.
Risks & watch-outs
- Watch-outs: property tax is 3.3% of price.
Questions for the listing agent
- What do current leases actually rent for vs. the listed asking? Can we see a recent rent roll and the last 12 months of T-12 income?
- It's been on market 84 days. Have you received any prior offers? Is the seller open to a 6% concession, seller financing, or rate buy-down credit?
- Property tax is high relative to price — has the assessment been appealed recently, and will the sale trigger a re-assessment?
- Why hasn't it sold? Are there any deal-killer items the seller is aware of (foundation, flood, title, zoning, code violations)?
- Is there a deadline driving the sale (1031 exchange, divorce, estate, relocation)? That informs how much negotiation room exists.
- Schools are B-rated — typically a magnet for longer-tenancy family renters. What's the average tenant stay here, and is there a school-zone premium baked into asking?
- Crime grade is D in this area — have there been break-ins, vandalism, or insurance claims at this property in the last 3 years? What carrier currently insures it and at what premium?
- The area grade is low — what's the realistic commute time and amenity access for the typical tenant pool here? Any planned neighborhood developments (good or bad) we should know about?
- What's the average days-on-market for RENTAL listings here right now (not sales)? A rising rental-DOM trend means longer vacancies and softer asking-rent achievability than the comps imply.
- What's the recent tenant-quality profile in this submarket — average credit score on applications, eviction rate, late-payment / NSF rate, and stable-employment percentage? A property-management company in the area should have these aggregated.
- How much new for-sale + rental construction is in the pipeline within 1–3 miles? Heavy new supply typically softens prices + rents 12–24 months out; constrained supply supports both.
Investment metrics
- 1% rule
- 0.45% ✗
- Cap rate
- 2.27%
- Cash-on-cash
- -14.37%
- DSCR
- 0.36
- GRM
- 18.5
CMA / ARV
- ARV (median comp)
- $419,950
- List price
- $189,000
- Delta
- -54.99%
- Verdict
- UNDERPRICED
- Comps
- 11 within 1.0 mi
Show comp detail 1 sale within ~0.75 mi
| Address | Dist | Beds/Ba | Sqft | Sold | Price | $/sf | Match |
|---|---|---|---|---|---|---|---|
| 71 E Runnion Rd | 0.51mi | 2/1.0 | 1,004 (+3%) | 23mo | $140,000 | $139 | 48 |
Match score weights: distance 35% · size 25% · config 20% · recency 20%. Top-matched comps best support the ARV.
Projected returns pro-forma
-3.0% appreciation · 3.0% rent growth · sell at horizon
- IRR
- -43.6%
- Equity multiple
- -0.34×
- Total profit
- $-157,720
- Equity at exit
- $62,616
- IRR
- -77.0%
- Equity multiple
- -1.15×
- Total profit
- $-252,724
- Equity at exit
- $36,310
Cash invested: $117,586 (down + closing). Projections, not guarantees.
Landlord ↔ Tenant lean methodology
- Overall (STATE)
- 28 Tenant-Leaning
- State Washington
- 28 Tenant-Leaning · D+8
- County
- — inherits STATE
- City
- — inherits STATE
ZIP-level market 98382
- Active inventory
- 605
- Price-to-rent
- 8.3×
Monthly cashflow live
- Estimated rent
- $1,891 medium interval (Pro) →
- Mortgage (P&I)
- −$2,202
- Tax est. 1.5%
- −$525 /mo · $6,299/yr
- Insurance
- −$175
- HOA
- −$0
- Vacancy / Maint / Mgmt
- −$397
- Net cashflow
- $-1,408
Break-even live
UW: 25.0% down · 7.5% · 30yr · 1.5% tax · 5.0% vac · 8.0% maint · 8.0% mgmt
Financing live
Cash to close
- Down payment
- $104,988
- Closing costs
- $12,598
- Reserves months
- —
- Total cash needed
- —
Loan-product check · same deal, 3 products live
Conventional
25% down · 7.5% · 30yr
- Down + closing
- —
- Monthly P&I
- —
- Monthly cashflow
- —
- DSCR
- —
- Eligible?
- —
Personal DTI + credit; lowest rate.
DSCR
20% down · 8.5% · 30yr
- Down + closing
- —
- Monthly P&I
- —
- Monthly cashflow
- —
- DSCR
- —
- Eligible?
- —
No personal income docs; deal must DSCR.
Hard money
10% down · 12.0% · 12mo
- Down + closing
- —
- Monthly P&I
- —
- Monthly cashflow
- —
- DSCR
- —
- Eligible?
- —
Short-term bridge; refi at stabilization.
Listing history 17 events
-
2026-06-19days on market $189,000 Active 84 DOM
-
2026-06-18days on market $189,000 Active 83 DOM
-
2026-06-17days on market $189,000 Active 82 DOM
-
2026-06-16days on market $189,000 Active 81 DOM
-
2026-06-15days on market $189,000 Active 80 DOM
-
2026-06-14days on market $189,000 Active 78 DOM
-
2026-06-12days on market $189,000 Active 77 DOM
-
2026-06-09days on market $189,000 Active 74 DOM
-
2026-06-08days on market $189,000 Active 73 DOM
-
2026-06-07days on market $189,000 Active 72 DOM
-
2026-06-05days on market $189,000 Active 69 DOM
-
2026-06-03days on market $189,000 Active 68 DOM
-
2026-06-02days on market $189,000 Active 67 DOM
-
2026-06-01days on market $189,000 Active 66 DOM
-
2026-05-31days on market $189,000 Active 65 DOM
-
2026-05-30days on market $189,000 Active 64 DOM
-
2026-03-27$189,000 Active 258-char remark
Show marketing remark (258 chars)
Value oriented small double section home with big features including spacious living room open to modern kitchen/dining room; large master bedroom with half bath; king size second bedroom and full master bath; available optional covered porch at front entry.
ⓘ Source: listings_history table (triggers on properties + properties_extension) + one-shot
backfill from property_details.listing_events for pre-trigger history.
Climate risk First Street
- Flood 1/10 Low FEMA zone X · 0% chance over 30 yrs
- Wildfire 1/10 Low
- Heat 2/10 Low 7 d/yr ≥83°F today · 18 d/yr by 30 yrs out
- Wind 1/10 Low
- Air quality 6/10 Major 7 unhealthy d/yr today · 8 by 30 yrs out
Nearby sold comps map
Loading sold comps map…
Walkable amenities ~0.75 mi
Loading nearby amenities…
Taxation est. · year 1
- Rental income
- $22,691
- − Mortgage interest
- −$23,524
- − Property taxes
- −$6,299
- − Insurance
- −$2,100
- − Repairs & maintenance
- −$1,815
- − Management
- −$1,815
- − Depreciation
- −$12,217
- Taxable loss
- −$25,079
- Est. tax savings @ 24.0%
- +$6,019
- After-tax cash flow
- $-10,881/yr
For passive investors: Depreciation is non-cash, so a rental often shows a tax loss while cash-flowing — sheltering income. Rental losses are passive: they offset passive income freely, and up to $25,000/yr can offset ordinary (W-2) income if you actively participate and your MAGI is under $100k (phasing out to $0 by $150k); unused losses carry forward. On sale, claimed depreciation is recaptured at up to 25%, and gains may owe capital-gains tax (a 1031 exchange can defer both). Figures are a year-1 estimate at your 24.0% rate — not tax advice; consult a CPA.
Condition & rehab AI · 1 photo
This modern, well-maintained single-family home with a stunning ocean view is ready for immediate occupancy and minor cosmetic upgrades to enhance its curb appeal and value.
Value-add opportunities
- Both Painting exterior and interior walls — Fresh paint enhances curb appeal and interior aesthetics.
- Both Landscaping improvements — Enhances curb appeal and adds value to the property.
- Both Upgrade to smart home systems — Improves energy efficiency and adds modern amenities for potential buyers/renters.
Renovation cost estimate screening
Value-add ROI direction
- Both Painting exterior and interior walls — Fresh paint enhances curb appeal and interior aesthetics. ↑
- Both Landscaping improvements — Enhances curb appeal and adds value to the property. ↑
- Both Upgrade to smart home systems — Improves energy efficiency and adds modern amenities for potential buyers/renters. ↑
ⓘ Cost ranges are severity-bucket heuristics (US national rule-of-thumb). Get contractor quotes + a written scope before underwriting a rehab budget.
Schools (NCES district)
- District
- Sequim School District
- NCES district ID
- 5307830
- Math proficiency
- 55% ▼ -1.00%
- Reading proficiency
- 66% ▲ 1.00%
- Median HH income
- $46,969
- Composite
- 52.77/100
- National rank
- #3312
- State rank
- #64 of 291 in WA
Livability — Carlsborg
- Score
- 59/100
- State rank
- #493
- US rank
- #20503
Category grades
Schools grade is shown separately in the Schools card above.
Census & demographics
- Census place
- Carlsborg, WA
- County
- Clallam County · 31,052 people
- Metro
- Port Angeles, WA
- Population (ZIP)
- 31,052
- Household income
- $74,189
- Rent vs Own
- Severe rent burden
- 666.0
Population outlook (Clallam County) Hauer SSP2
- Today (2025)
- 76,817 people
- By 2030
- 78,177 · +1.8%
- By 2040
- 79,795 · +3.9%
- By 2050
- 80,890 · +5.3%
- By 2075
- 83,933 · +9.3%
- By 2100
- 82,141 · +6.9%
Race, ethnicity, and origin ACS 2023
- Neighborhood character
- Predominantly White (85%)
- Race & ethnicity
- White 85% Two or more races 7% Hispanic / Latino 4% Asian 2%
- Common ancestry
- Portuguese 5% Slovak 5% Italian 4%
- Foreign-born
- 6% · Canada
- Languages at home
- 95% English-only · Spanish 2% German/W. Germanic 1% Other Indo-European 1%
Political lean MEDSL · Clallam
- 2024 margin
- Lean D (+7.9) · D 52.6% · R 44.7% · Other 2.7%
- 2008→2024 swing
- +4.6pp toward D · 2008: 3.3pp · 2024: 7.9pp
- All cycles
- 2024: D+7.9 2020: D+3.4 2016: R+1.6 2012: D+0.4 2008: D+3.3
Not yet ingested
- Civics
- —
Market trends
- HPI YoY
- ▼ -225.89%
- Current HPI
- 181.4372
- Rent YoY
- —
- Metro
- Port Angeles, WA
- State GDP YoY
- ▲ 4.65%
- F500 in state
- 22
Industry mix (Fortune 500 HQ in WA)
| Industry | F500 HQs | Revenue |
|---|---|---|
| Retail | 2 | $269B |
|
||
| Technology / Retail | 1 | $638B |
|
||
| Technology | 1 | $245B |
|
||
| Telecommunications | 1 | $38B |
|
||
| Food / Beverage | 1 | $36B |
|
||
| Automotive / Trucks | 1 | $34B |
|
||
Price history
1 event — show timeline
- 2026-03-27 Listed $189,000 Zillow
Cash-flow waterfall
monthlySold comps — $/sqft
last 12 mo · ≤1 miLoading sold comps…