 Fourplex
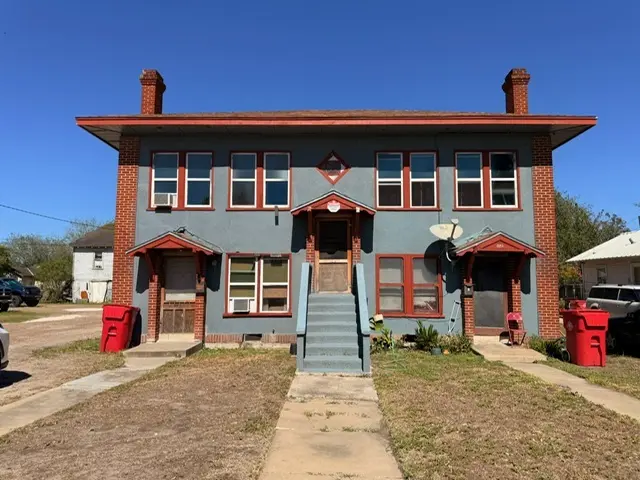
323 E Avenue C Ave · Robstown, TX
Flood risk 7/10 · Major
- FEMA flood zone
- AE
- Chance of flooding over 30 yrs
- 0.99%
- Est. flood insurance / yr
- $1,737 – $8,500
Fire risk 1/10 · Minimal
- Est. fire insurance / yr
- $1,222 – $2,270
Heat risk 9/10 · Severe
- Hot days now (above 110°F)
- 7 days/yr
- Hot days in 30 yrs
- 23 days/yr
Wind risk 9/10 · Severe
- Chance of severe wind over 30 yrs
- 99.0%
Air-quality risk 1/10 · Minimal
- Unhealthy air days now
- 0 days/yr
- Unhealthy air days in 30 yrs
- 0 days/yr
Risk factors via First Street. Map © Google.
Why this score? — see what drove the C grade
The composite is a weighted blend of 9 inputs, each scored 0–100. Each bar is that input's sub-score; the figure is the points it added to the 100-point composite (weight × sub-score).
- Cash flow +24.5/30.0
- DSCR +7.9/10.0
- ARV discount +7.5/15.0
- 1% rule +6.5/10.0
- Livability +4.0/5.0
- Rent growth +2.5/5.0
- Condition / age +2.5/5.0
- Appreciation +2.2/10.0
- Schools +1.9/10.0
$325,000
🖨 Deal sheet (PDF) 📄 Offer letter ✓ Due diligence
Multi-family units
County records classify this as Multi-Family (2-4 Unit). Listing-text estimate: 4 units. confirmed
Listing remarks MLS
Investment opportunity in Robstown! This well-maintained 4-plex at 323 E Ave C offers immediate income potential with a solid rental mix and updated leases already in place. Built in 1960, the property features four spacious units, each approximately 804 square feet, with 2 bedrooms and 1 bathroom, making them highly desirable for long-term tenants. Two of the units are leased through Section 8 housing, providing stable and reliable income, while the other two are traditional rental units, offering flexibility and strong cash flow potential. Three out of the four units have been recently updated. The property also includes a large 770-square-foot carport in the rear, offering covered parking and additional tenant convenience—an attractive amenity that supports tenant retention. Located in a growing rental market, this property is ideal for investors looking to expand their portfolio with a multi-family asset that delivers both stability and upside. Whether you’re a seasoned investor or looking to begin your real estate journey, this income-producing 4-plex is a must-see.
Key facts
- Updated leases
- Solid rental mix
- Spacious units
Tags
Neighborhood map
What this means for you Summary
Snapshot
- This is a 4 × 2-bed/1.0-bath units multifamily listed at $325k.
Deal economics
- At list price, monthly cash flow is $242 ($3k/yr) — positive. Per door: $61/mo.
- The deal already cash-flows at list — no discount required.
- Meets the 1% rule at list price ($4k rent vs $325k).
- Recommended offer: $296k (9.0% below list) — sets the bar for market timing.
- Cap rate 8.8% vs local median 5.2% in Robstown — top-decile yield for the area; either an underpriced asset or a hidden risk that comps aren't pricing in. Stress-test before assuming the spread holds.
Location & tenants
- Location reads 80/100 on livability (#47 in TX, #1,942 nationally) — a professional / high-income tenant draw. Strengths: commute A+, cost of living A+, housing A+; Watch: crime D-, amenities F, employment F.
- Robstown ISD (town): math 18% / reading 28% proficiency, ranked #757 of 826 in TX (top 92%) — low school quality limits family demand, transient renter base, plan for 1-2y turnover; 71% free/reduced lunch — lower-income household profile, screen leases tightly.
- Zoned schools: Robert Driscoll Jr Stem Academy (math 22% / reading 22%, grade F, #3,333 of 4,322 statewide, top 80%, 662 students, 91% FRL); Seale J H (math 16% / reading 29%, grade F, #1,341 of 1,662 statewide, top 82%, 521 students, 90% FRL); Robstown Early College H S (math 22% / reading 36%, grade F, #1,147 of 1,632 statewide, top 71%, 741 students, 90% FRL) — zoned schools average 90% FRL vs 71% district-wide (19 pts higher); higher-poverty schools than district average — tighter screening recommended.
- Market conditions: 194 active listings in the ZIP; 1,397 units permitted in Nueces County in 2024 (47 in 5+ unit buildings).
Forward outlook
- Local home prices are declining (-3.0%/yr); year-one equity from $2k of loan paydown is wiped out by about $10k of value loss. Plan a longer hold.
- Nueces County population projected at +36% by 2050 — long-run rental-demand tailwind backs the buy-and-hold thesis.
Negotiation context
- It's been on market 116 days — a 9% lower offer ($296k) is reasonable based on typical stale-listing flexibility.
- 2 sale attempts since 7y ago with the ask held roughly flat each time — persistent listings suggest the price (not the market) is what's stuck; bring a comps-based counter.
- Current owner paid $31k; list at $325k implies a 948% gain — meaningful room to come down on a strong offer.
Risks & watch-outs
- Watch-outs: flood insurance adds $427/mo.
- Climate carrying-cost: in FEMA flood zone AE (mandatory federal flood insurance); severe wind risk, 99% chance of damaging wind over 30y; extreme-heat days projected 7→23/yr by 2055 (HVAC capex compounding) — expect insurance premiums to compound above CPI over the hold.
Questions for the listing agent
- It's been on market 116 days. Have you received any prior offers? Is the seller open to a 9% concession, seller financing, or rate buy-down credit?
- Can we see the unit-by-unit rent roll, current vacancy, and any below-market leases? What's the average tenancy length?
- What capital expenditures (roof, boiler, parking lot, exteriors) have been made in the last 5 years, and what's planned in the next 2?
- Built in 1960 — when were the roof, HVAC, electrical panel, plumbing, and water heater last replaced?
- What's the actual annual flood-insurance premium (NFIP or private), and is the property in a SFHA with mandatory coverage?
- Why hasn't it sold? Are there any deal-killer items the seller is aware of (foundation, flood, title, zoning, code violations)?
- Is there a deadline driving the sale (1031 exchange, divorce, estate, relocation)? That informs how much negotiation room exists.
- Schools are D-rated, which usually means shorter tenancies and higher turnover. Who's the typical renter profile here, and what's been the actual vacancy rate?
- Crime grade is D in this area — have there been break-ins, vandalism, or insurance claims at this property in the last 3 years? What carrier currently insures it and at what premium?
- What's the average days-on-market for RENTAL listings here right now (not sales)? A rising rental-DOM trend means longer vacancies and softer asking-rent achievability than the comps imply.
- What's the recent tenant-quality profile in this submarket — average credit score on applications, eviction rate, late-payment / NSF rate, and stable-employment percentage? A property-management company in the area should have these aggregated.
- How much new apartment / multifamily construction is in the pipeline within 1–3 miles? Heavy new supply (>2% of stock underway) typically softens rents 12–24 months out; light construction supports rent growth.
Investment metrics
- 1% rule
- 1.15% ✓
- Cap rate
- 8.76%
- Cash-on-cash
- 8.82%
- DSCR
- 1.39
- GRM
- 7.3
CMA / ARV
- ARV (median comp)
- $128,597
- List price
- $325,000
- Delta
- 152.73%
- Verdict
- OVERPRICED
- Comps
- 2 within 1.0 mi
Projected returns pro-forma
-3.0% appreciation · 3.0% rent growth · sell at horizon
- IRR
- -11.1%
- Equity multiple
- 0.59×
- Total profit
- $-36,886
- Equity at exit
- $48,459
- IRR
- -1.7%
- Equity multiple
- 0.88×
- Total profit
- $-10,876
- Equity at exit
- $28,100
Cash invested: $91,000 (down + closing). Projections, not guarantees.
Landlord ↔ Tenant lean methodology
- Overall (STATE)
- 87 Strongly Landlord-Friendly
- State Texas
- 87 Strongly Landlord-Friendly · R+5
- County
- — inherits STATE
- City
- — inherits STATE
ZIP-level market 78380
- Home prices YoY
- -1.9%
- Active inventory
- 194
- Price-to-rent
- 29.1×
Monthly cashflow live
- Estimated rent
- $3,723 medium interval (Pro) →
- Mortgage (P&I)
- −$1,704
- Tax from tax record
- −$432 /mo · $5,189/yr
- Insurance
- −$135
- Flood insurance flood zone
- −$427 /mo · $5,118/yr
- HOA
- −$0
- Vacancy / Maint / Mgmt
- −$782
- Net cashflow
- $242
Break-even live
Sensitivity live
| Price | -10% $426 | -5% $334 | +0% $242 | +5% $150 | +10% $58 |
|---|---|---|---|---|---|
| Rent | -10% $-52 | -5% $95 | +0% $242 | +5% $390 | +10% $537 |
| Rate | -1.0pp $406 | -0.5pp $325 | base $242 | +0.5pp $158 | +1.0pp $73 |
4-unit breakdown (identical units grouped — click to expand)
| Units | Beds | Baths | Est. rent |
|---|---|---|---|
| 4× units | 2 | 1 | $3,724 |
| #1 | 2 | 1 | $931 |
| #2 | 2 | 1 | $931 |
| #3 | 2 | 1 | $931 |
| #4 | 2 | 1 | $931 |
| Total (4 units) | $3,723 | ||
UW: 25.0% down · 7.5% · 30yr · 1.5% tax · 5.0% vac · 8.0% maint · 8.0% mgmt
Financing live
Cash to close
- Down payment
- $81,250
- Closing costs
- $9,750
- Reserves months
- —
- Total cash needed
- —
Loan-product check · same deal, 3 products live
Conventional
25% down · 7.5% · 30yr
- Down + closing
- —
- Monthly P&I
- —
- Monthly cashflow
- —
- DSCR
- —
- Eligible?
- —
Personal DTI + credit; lowest rate.
DSCR
20% down · 8.5% · 30yr
- Down + closing
- —
- Monthly P&I
- —
- Monthly cashflow
- —
- DSCR
- —
- Eligible?
- —
No personal income docs; deal must DSCR.
Hard money
10% down · 12.0% · 12mo
- Down + closing
- —
- Monthly P&I
- —
- Monthly cashflow
- —
- DSCR
- —
- Eligible?
- —
Short-term bridge; refi at stabilization.
Listing history 24 events
-
2026-06-21days on market $325,000 Active 116 DOM
-
2026-06-21days on market $325,000 Active 115 DOM
-
2026-06-18days on market $325,000 Active 113 DOM
-
2026-06-17days on market $325,000 Active 112 DOM
-
2026-06-16days on market $325,000 Active 111 DOM
-
2026-06-15days on market $325,000 Active 110 DOM
-
2026-06-15days on market $325,000 Active 109 DOM
-
2026-06-13days on market $325,000 Active 108 DOM
-
2026-06-09days on market $325,000 Active 104 DOM
-
2026-06-08days on market $325,000 Active 103 DOM
-
2026-06-08days on market $325,000 Active 102 DOM
-
2026-06-07days on market $325,000 Active 101 DOM
-
2026-06-03days on market $325,000 Active 98 DOM
-
2026-06-02days on market $325,000 Active 97 DOM
-
2026-06-01days on market $325,000 Active 96 DOM
-
2026-05-31days on market $325,000 Active 95 DOM
-
2026-02-25$325,000 Active 1099-char remark
Show marketing remark (1099 chars)
Investment opportunity in Robstown! This well-maintained 4-plex at 323 E Ave C offers immediate income potential with a solid rental mix and updated leases already in place. Built in 1960, the property features four spacious units, each approximately 804 square feet, with 2 bedrooms and 1 bathroom, making them highly desirable for long-term tenants. Two of the units are leased through Section 8 housing, providing stable and reliable income, while the other two are traditional rental units, offering flexibility and strong cash flow potential. Three out of the four units have been recently updated. The property also includes a large 770-square-foot carport in the rear, offering covered parking and additional tenant convenience—an attractive amenity that supports tenant retention. Located in a growing rental market, this property is ideal for investors looking to expand their portfolio with a multi-family asset that delivers both stability and upside. Whether you’re a seasoned investor or looking to begin your real estate journey, this income-producing 4-plex is a must-see.
-
2019-07-22soldstatus
-
2019-07-19historical 313-char remark
Show marketing remark (313 chars)
Investors Special! 4 plex for sale, both units on the bottom are 2 bedrooms 1 bath units, upstairs units are unfinished, studs are exposed. The property needs work. The bottom right unit ( unit "A") is and has been leased for several years for approx. $700 per month. The other 3 units are not occupied.
-
2019-07-19soldstatus Closed 313-char remark
Show marketing remark (313 chars)
Investors Special! 4 plex for sale, both units on the bottom are 2 bedrooms 1 bath units, upstairs units are unfinished, studs are exposed. The property needs work. The bottom right unit ( unit "A") is and has been leased for several years for approx. $700 per month. The other 3 units are not occupied.
-
2019-07-15status Pending 313-char remark
Show marketing remark (313 chars)
Investors Special! 4 plex for sale, both units on the bottom are 2 bedrooms 1 bath units, upstairs units are unfinished, studs are exposed. The property needs work. The bottom right unit ( unit "A") is and has been leased for several years for approx. $700 per month. The other 3 units are not occupied.
-
2019-06-13$49,900 Active 313-char remark
Show marketing remark (313 chars)
Investors Special! 4 plex for sale, both units on the bottom are 2 bedrooms 1 bath units, upstairs units are unfinished, studs are exposed. The property needs work. The bottom right unit ( unit "A") is and has been leased for several years for approx. $700 per month. The other 3 units are not occupied.
-
2016-04-15soldstatus
-
2002-11-26soldstatus $31,000
ⓘ Source: listings_history table (triggers on properties + properties_extension) + one-shot
backfill from property_details.listing_events for pre-trigger history.
Tax reassessment forecast TX · Resets to sale price
- Current annual tax
- $5,189 · $432/mo
- Projected year-2 tax
- $5,948 · $496/mo
- Expected delta
- +$759/yr (+$63/mo · 14.6%)
ⓘ Screening estimate from a state-policy table — verify with the county assessor before closing.
Climate risk First Street
- Flood 7/10 Severe FEMA zone AE · 99% chance over 30 yrs
- Wildfire 1/10 Low
- Heat 9/10 Extreme 7 d/yr ≥110°F today · 23 d/yr by 30 yrs out
- Wind 9/10 Extreme 99% chance of damaging wind over 30 yrs
- Air quality 1/10 Low 0 unhealthy d/yr today · 0 by 30 yrs out
Nearby sold comps map
Loading sold comps map…
Walkable amenities ~0.75 mi
Loading nearby amenities…
Taxation est. · year 1
- Rental income
- $44,676
- − Mortgage interest
- −$18,205
- − Property taxes
- −$5,189
- − Insurance
- −$6,744
- − Repairs & maintenance
- −$3,574
- − Management
- −$3,574
- − Depreciation
- −$9,455
- Taxable loss
- −$2,064
- Est. tax savings @ 24.0%
- +$495
- After-tax cash flow
- $3,405/yr
For passive investors: Depreciation is non-cash, so a rental often shows a tax loss while cash-flowing — sheltering income. Rental losses are passive: they offset passive income freely, and up to $25,000/yr can offset ordinary (W-2) income if you actively participate and your MAGI is under $100k (phasing out to $0 by $150k); unused losses carry forward. On sale, claimed depreciation is recaptured at up to 25%, and gains may owe capital-gains tax (a 1031 exchange can defer both). Figures are a year-1 estimate at your 24.0% rate — not tax advice; consult a CPA.
Schools (NCES district)
- District
- Robstown ISD
- NCES district ID
- 4837440
- Math proficiency
- 18% ▼ -21.00%
- Reading proficiency
- 28% ▼ -5.00%
- Median HH income
- $33,362
- Composite
- 18.77/100
- National rank
- #8875
- State rank
- #757 of 826 in TX
Livability — Robstown
- Score
- 80/100
- State rank
- #47
- US rank
- #1942
Category grades
Schools grade is shown separately in the Schools card above.
Census & demographics
- Census place
- Robstown, TX
- Population (ZIP)
- 23,752
Population outlook (Nueces County) Hauer SSP2
- Today (2025)
- 418,037 people
- By 2030
- 447,123 · +7.0%
- By 2040
- 505,911 · +21.0%
- By 2050
- 567,522 · +35.8%
- By 2075
- 729,686 · +74.6%
- By 2100
- 847,087 · +102.6%
Race, ethnicity, and origin ACS 2023
- Neighborhood character
- Predominantly Hispanic (76%)
- Race & ethnicity
- Hispanic / Latino 76% Two or more races 38% White 23%
- Hispanic origin (detail)
- Mexican 71%
- Foreign-born
- 5% · Canada, Vietnam
- Languages at home
- 52% English-only · Spanish 47%
Political lean MEDSL · Nueces
- 2024 margin
- R (+11.5) · D 43.8% · R 55.3%
- 2008→2024 swing
- -7.1pp toward R · 2008: -4.4pp · 2024: -11.5pp
- All cycles
- 2024: R+11.5 2020: R+2.9 2016: R+1.5 2012: R+3.2 2008: R+4.4
Not yet ingested
- Civics
- —
Market trends
- HPI YoY
- ▼ -5.51%
- Current HPI
- 286.19
- Rent YoY
- —
- Metro
- —
- State GDP YoY
- ▲ 3.95%
- F500 in state
- 110
Industry mix (Fortune 500 HQ in TX)
| Industry | F500 HQs | Revenue |
|---|---|---|
| Energy | 16 | $1,198B |
|
||
| Technology | 5 | $198B |
|
||
| Engineering / Construction | 4 | $72B |
|
||
| Energy Services | 3 | $60B |
|
||
| Utilities | 3 | $41B |
|
||
| Healthcare | 2 | $330B |
|
||
Price history
+948.4% since first listed8 events — show timeline
- 2026-02-25 Listed $325,000 Unlock MLS
- 2019-07-22 Sold (Public Records) — Public Records
- 2019-07-19 Delisted — CBMLS
- 2019-07-19 Sold (MLS) — CBMLS
- 2019-07-15 Pending — CBMLS
- 2019-06-13 Listed $49,900 CBMLS
- 2016-04-15 Sold (Public Records) — Public Records
- 2002-11-26 Sold (Public Records) $31,000 Public Records
Property tax history
+11.7%/yrLatest (2025): $5,189 · +2.2% YoY. Source: county tax records.
Cash-flow waterfall
monthlySold comps — $/sqft
last 12 mo · ≤1 miLoading sold comps…