60905 Bearville Trl · Cook, MN
Flood risk 1/10 · Minimal
- FEMA flood zone
- —
- Chance of flooding over 30 yrs
- 0.0%
- Est. flood insurance / yr
- —
Fire risk 4/10 · Minor
- Est. fire insurance / yr
- $888 – $1,650
Heat risk 1/10 · Minimal
- Hot days now (above 91°F)
- 7 days/yr
- Hot days in 30 yrs
- 12 days/yr
Wind risk 1/10 · Minimal
- Chance of severe wind over 30 yrs
- —
Air-quality risk 2/10 · Minimal
- Unhealthy air days now
- 0 days/yr
- Unhealthy air days in 30 yrs
- 1 days/yr
Risk factors via First Street. Map © Google.
Why this score? — see what drove the C+ grade
The composite is a weighted blend of 9 inputs, each scored 0–100. Each bar is that input's sub-score; the figure is the points it added to the 100-point composite (weight × sub-score).
- Cash flow +26.1/30.0
- DSCR +8.8/10.0
- ARV discount +7.5/15.0
- 1% rule +6.9/10.0
- Schools +4.3/10.0
- Condition / age +3.8/5.0
- Livability +3.2/5.0
- Rent growth +2.5/5.0
- Appreciation +0.0/10.0
$69,900
🖨 Deal sheet 📄 Offer letter ✓ Due diligence
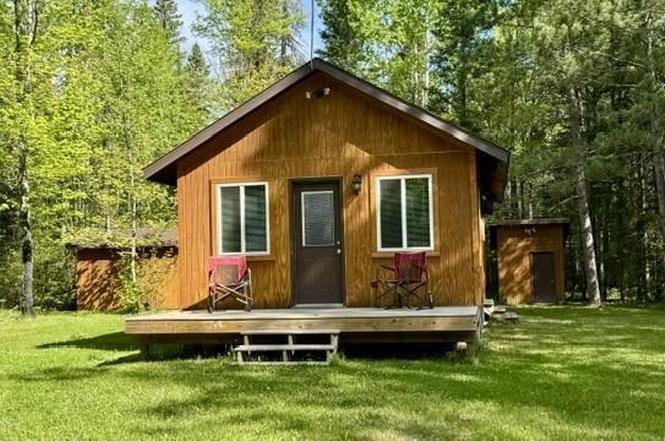
Listing remarks
Hunting Shack on 4.38 Acres with Prime Outdoor Access. Escape to your perfect wilderness retreat on this 4.38-acre lot featuring a cabin, an outhouse, and a large shed. Recently upgraded with a new steel roof (shed, outhouse, back cabin), siding, doors, new furnace, wall AC units, and decks. Option for the convenience of a furnished cabin/hunting shack ready for your next adventure. Adjacent to tax-forfeited and township land, plus the George Washington State Forest, this property offers unparalleled access to nature’s best. It’s an ideal spot for hunting, fishing nearby lakes, snowshoeing, snowmobiling, and exploring extensive ATV trails. Secluded enough for privacy, the locati
Key facts
- New furnace
- Cabin
- New steel roof
Tags
Property features AI
Finance
- Other: Corner lot on approximately 4.38 acres (332 x 584 x 322 x 584); Property adjoins public land; Heavy tree coverage; Access via county road and private road (private road is privately maintained); Map coordinate: 999-A1
- Financial info: Free and clear mortgage status
Exterior
- Parking: No designated parking
- Utilities: No piped water (no water source); Outhouse sewer; Propane fuel; Electric with circuit breakers
- Home design: Residential property; One story; Pillar/post/pier foundation
- Construction: Frame construction; Roof age information varies
- Exterior features: Deck; Wood exterior; Storage shed; Other outbuilding
Interior
- Kitchen: Microwave; Range; Refrigerator
- Bedrooms: One bedroom on the main level (16 x 16)
- Bathrooms: One quarter bath
- Heating & cooling: Space heater; Window air conditioning units
- Interior features: All living facilities on one level; Eat-in kitchen
- Laundry & utility: No laundry hookups / no laundry room
Neighborhood map
What this means for you Summary
Snapshot
- This is a 1-bed/1.0-bath single-family listed at $70k. Condition is rated good.
Deal economics
- At list price, monthly cash flow is $177 ($2k/yr) — positive.
- The deal already cash-flows at list — no discount required.
- Meets the 1% rule at list price ($835 rent vs $70k).
- Cap rate 9.3% vs local median 0.7% in Cook — top-decile yield for the area; either an underpriced asset or a hidden risk that comps aren't pricing in. Stress-test before assuming the spread holds.
Location & tenants
- Location reads 65/100 on livability (#545 in MN) — a middle-class / working-renter tenant base. Strengths: cost of living A+, housing A+; Watch: crime C-, schools D+, health & safety D.
- Grand Rapids Public School District (town): math 46% / reading 55% proficiency, ranked #119 of 301 in MN (top 40%) — acceptable for families but not a draw, mixed tenant base, ~2y average lease.
- Market conditions: 84 active listings in the ZIP; 121 units permitted in Itasca County in 2024 (0 in 5+ unit buildings).
Forward outlook
- Local home prices are declining (-3.0%/yr); year-one equity from $483 of loan paydown is wiped out by about $2k of value loss. Plan a longer hold.
- Itasca County population projected to shrink 4% by 2050 — rents likely to lag national; underwrite the cash flow, not the appreciation.
- At projected returns (-3.0% appreciation + 3.0% rent growth), your $20k cash investment doubles in ~10 years — after that, you're playing with house money.
Negotiation context
- Only 5 days on market — expect competitive offers; lowballing is unlikely to land.
Questions for the listing agent
- Is there a deadline driving the sale (1031 exchange, divorce, estate, relocation)? That informs how much negotiation room exists.
- Schools are D-rated, which usually means shorter tenancies and higher turnover. Who's the typical renter profile here, and what's been the actual vacancy rate?
- What's the average days-on-market for RENTAL listings here right now (not sales)? A rising rental-DOM trend means longer vacancies and softer asking-rent achievability than the comps imply.
- What's the recent tenant-quality profile in this submarket — average credit score on applications, eviction rate, late-payment / NSF rate, and stable-employment percentage? A property-management company in the area should have these aggregated.
- How much new for-sale + rental construction is in the pipeline within 1–3 miles? Heavy new supply typically softens prices + rents 12–24 months out; constrained supply supports both.
Investment metrics
- 1% rule
- 1.19% ✓
- Cap rate
- 9.33%
- Cash-on-cash
- 10.83%
- DSCR
- 1.48
- GRM
- 7.0
CMA / ARV
No comps found within radius.
Projected returns pro-forma
-3.0% appreciation · 3.0% rent growth · sell at horizon
- IRR
- -0.1%
- Equity multiple
- 1.00×
- Total profit
- $-65
- Equity at exit
- $10,422
- IRR
- 9.6%
- Equity multiple
- 1.74×
- Total profit
- $14,479
- Equity at exit
- $6,044
Cash invested: $19,572 (down + closing). Projections, not guarantees.
Landlord ↔ Tenant lean methodology
- Overall (STATE)
- 46 Balanced
- State Minnesota
- 46 Balanced · D+2
- County
- — inherits STATE
- City
- — inherits STATE
ZIP-level market 55723
- Home prices YoY
- -22.9%
- Active inventory
- 84
- Price-to-rent
- 7.0×
Monthly cashflow live
- Estimated rent
- $835 medium interval (Pro) →
- Mortgage (P&I)
- −$367
- Tax est. 1.5%
- −$87 /mo · $1,048/yr
- Insurance
- −$29
- HOA
- −$0
- Vacancy / Maint / Mgmt
- −$175
- Net cashflow
- $177
Break-even live
UW: 25.0% down · 7.5% · 30yr · 1.5% tax · 5.0% vac · 8.0% maint · 8.0% mgmt
Financing live
Cash to close
- Down payment
- $17,475
- Closing costs
- $2,097
- Reserves months
- —
- Total cash needed
- —
Loan-product check · same deal, 3 products live
Conventional
25% down · 7.5% · 30yr
- Down + closing
- —
- Monthly P&I
- —
- Monthly cashflow
- —
- DSCR
- —
- Eligible?
- —
Personal DTI + credit; lowest rate.
DSCR
20% down · 8.5% · 30yr
- Down + closing
- —
- Monthly P&I
- —
- Monthly cashflow
- —
- DSCR
- —
- Eligible?
- —
No personal income docs; deal must DSCR.
Hard money
10% down · 12.0% · 12mo
- Down + closing
- —
- Monthly P&I
- —
- Monthly cashflow
- —
- DSCR
- —
- Eligible?
- —
Short-term bridge; refi at stabilization.
Listing history 6 events
-
2026-06-19days on market $69,900 Active 5 DOM
-
2026-06-18days on market $69,900 Active 4 DOM
-
2026-06-17days on market $69,900 Active 3 DOM
-
2026-06-16days on market $69,900 Active 2 DOM
-
2026-06-15remarks 687-char remark
-
2026-06-15$69,900 Active 1 DOM
ⓘ Source: listings_history table (triggers on properties + properties_extension) + one-shot
backfill from property_details.listing_events for pre-trigger history.
Climate risk First Street
- Flood 1/10 Low 0% chance over 30 yrs
- Wildfire 4/10 Moderate
- Heat 1/10 Low 7 d/yr ≥91°F today · 12 d/yr by 30 yrs out
- Wind 1/10 Low
- Air quality 2/10 Low 0 unhealthy d/yr today · 1 by 30 yrs out
Nearby sold comps map
Loading sold comps map…
Walkable amenities ~0.75 mi
Loading nearby amenities…
Taxation est. · year 1
- Rental income
- $10,020
- − Mortgage interest
- −$3,915
- − Property taxes
- −$1,048
- − Insurance
- −$350
- − Repairs & maintenance
- −$802
- − Management
- −$802
- − Depreciation
- −$2,033
- Taxable income
- $1,070
- Est. tax owed @ 24.0%
- −$257
- After-tax cash flow
- $1,863/yr
For passive investors: Depreciation is non-cash, so a rental often shows a tax loss while cash-flowing — sheltering income. Rental losses are passive: they offset passive income freely, and up to $25,000/yr can offset ordinary (W-2) income if you actively participate and your MAGI is under $100k (phasing out to $0 by $150k); unused losses carry forward. On sale, claimed depreciation is recaptured at up to 25%, and gains may owe capital-gains tax (a 1031 exchange can defer both). Figures are a year-1 estimate at your 24.0% rate — not tax advice; consult a CPA.
Condition & rehab AI · 12 photos
This cabin is in good condition with recent upgrades, offering a perfect wilderness retreat with excellent curb appeal and a functional layout.
Value-add opportunities
- Both Paint exterior siding — Enhances curb appeal and protects the siding.
- Both Replace gutters — Prevents water damage and improves drainage.
Renovation cost estimate screening
Value-add ROI direction
- Both Paint exterior siding — Enhances curb appeal and protects the siding. ↑
- Both Replace gutters — Prevents water damage and improves drainage. ↑
ⓘ Cost ranges are severity-bucket heuristics (US national rule-of-thumb). Get contractor quotes + a written scope before underwriting a rehab budget.
Schools (NCES district)
- District
- Grand Rapids Public School District
- NCES district ID
- 2713170
- Math proficiency
- 46% ▼ -7.00%
- Reading proficiency
- 55% ▼ -6.00%
- Median HH income
- $49,762
- Composite
- 43.14/100
- National rank
- #3077
- State rank
- #119 of 301 in MN
Livability — Cook
- Score
- 65/100
- State rank
- #545
- US rank
- #13111
Category grades
Schools grade is shown separately in the Schools card above.
Census & demographics
- Population (ZIP)
- 1,861
Population outlook (Itasca County) Hauer SSP2
- Today (2025)
- 45,885 people
- By 2030
- 45,890 · +0.0%
- By 2040
- 45,171 · -1.6%
- By 2050
- 43,946 · -4.2%
- By 2075
- 40,950 · -10.8%
- By 2100
- 34,909 · -23.9%
Race, ethnicity, and origin ACS 2023
- Neighborhood character
- Predominantly White (96%)
- Race & ethnicity
- White 96% Two or more races 3% Hispanic / Latino 1%
- Common ancestry
- Portuguese 14% Romanian 7% Lithuanian 4%
- Foreign-born
- 1% · Canada
- Languages at home
- 98% English-only · Spanish 1%
Political lean MEDSL · Itasca
- 2024 margin
- Strong R (+20.2) · D 39.1% · R 59.3% · Other 1.6%
- 2008→2024 swing
- -33.1pp toward R · 2008: 12.9pp · 2024: -20.2pp
- All cycles
- 2024: R+20.2 2020: R+16.8 2016: R+16.5 2012: D+9.9 2008: D+12.9
Not yet ingested
- Civics
- —
Market trends
- HPI YoY
- ▼ -57.80%
- Current HPI
- 194.5825
- Rent YoY
- —
- Metro
- —
- State GDP YoY
- ▲ 2.41%
- F500 in state
- 34
Industry mix (Fortune 500 HQ in MN)
| Industry | F500 HQs | Revenue |
|---|---|---|
| Healthcare | 2 | $407B |
|
||
| Retail | 2 | $150B |
|
||
| Consumer Goods | 2 | $32B |
|
||
| Industrial Machinery | 2 | $6B |
|
||
| Agriculture | 1 | $40B |
|
||
| Healthcare / Medical Devices | 1 | $32B |
|
||
Price history
1 event — show timeline
- 2026-06-14 Listed $69,900 NORTHSTARMLS as Distributed by MLS Grid
Cash-flow waterfall
monthlySold comps — $/sqft
last 12 mo · ≤1 miLoading sold comps…