604 Richmond Hill Pkwy · Warner Robins, GA
Flood risk 1/10 · Minimal
- FEMA flood zone
- X (unshaded)
- Chance of flooding over 30 yrs
- 0.0%
- Est. flood insurance / yr
- $507 – $1,088
Fire risk 3/10 · Minor
- Est. fire insurance / yr
- $963 – $1,789
Heat risk 7/10 · Major
- Hot days now (above 108°F)
- 7 days/yr
- Hot days in 30 yrs
- 19 days/yr
Wind risk 6/10 · Moderate
- Chance of severe wind over 30 yrs
- 73.0%
Air-quality risk 3/10 · Minor
- Unhealthy air days now
- 2 days/yr
- Unhealthy air days in 30 yrs
- 3 days/yr
Risk factors via First Street. Map © Google.
Why this score? — see what drove the B- grade
The composite is a weighted blend of 9 inputs, each scored 0–100. Each bar is that input's sub-score; the figure is the points it added to the 100-point composite (weight × sub-score).
- Cash flow +30.0/30.0
- DSCR +10.0/10.0
- 1% rule +9.9/10.0
- ARV discount +7.5/15.0
- Schools +3.9/10.0
- Livability +3.2/5.0
- Rent growth +2.5/5.0
- Condition / age +2.5/5.0
- Appreciation +0.0/10.0
$120,000
🖨 Deal sheet 📄 Offer letter ✓ Due diligence
Listing remarks
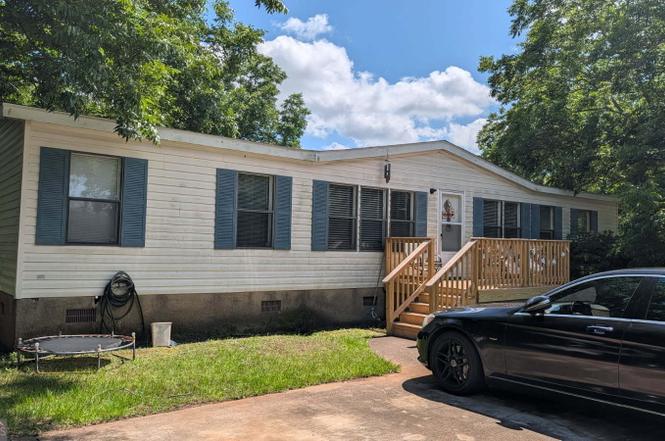
Excellent investment opportunity with a tenant already in place paying $1,150 per month. This 3-bedroom, 2-bath home offers immediate rental income and strong investment potential. Recent improvements include a brand-new HVAC system and new front and back decks, adding value and appeal to the property. The home sits on its own land with no lot rent, providing additional long-term benefits for investors. The current tenant lease ends in December and would like to remain in the property. Please do not disturb the tenant. Showings are available by appointment only.
Key facts
- Own land
- Front and back decks
- Hvac system
Tags
Property features AI
Finance
- Other: Located in the Richmond Hill subdivision in Byron, GA
- HOA & community: No HOA
Exterior
- Parking: No designated parking
- Utilities: Public water; Public sewer; Cable available; Electricity available
- Home design: Manufactured single-family residence; Manufactured house; Resale property
- Construction: Built in 2002
- Exterior features: Vinyl siding; Composition roof; Lot approximately 0.26 acres; Public records list lot size
Interior
- Kitchen: Refrigerator included
- Bedrooms: 3 bedrooms (all on the main level)
- Flooring: Carpet; Vinyl
- Bathrooms: 2 full bathrooms (on the main level)
- Heating & cooling: Central heating; Central air conditioning
- Interior features: One-level living; Family room
- Laundry & utility: Laundry closet
Neighborhood map
What this means for you Summary
Snapshot
- This is a 3-bed/2.0-bath other listed at $120k.
Deal economics
- At list price, monthly cash flow is $679 ($8k/yr) — positive.
- The deal already cash-flows at list — no discount required.
- Meets the 1% rule at list price ($2k rent vs $120k).
- Recommended offer: $118k (1.5% below list) — sets the bar for market timing.
- Cap rate 13.1% vs local median 4.9% in Warner Robins — top-decile yield for the area; either an underpriced asset or a hidden risk that comps aren't pricing in. Stress-test before assuming the spread holds.
Location & tenants
- Location reads 65/100 on livability (#227 in GA) — a middle-class / working-renter tenant base. Strengths: cost of living A+, housing A+, health & safety A+; Watch: employment D+, crime F, amenities F.
- Houston County (urban): math 43% / reading 46% proficiency, ranked #23 of 174 in GA (top 13%) — families likely to look elsewhere, expect single-tenant / working-renter base with shorter leases.
- Zoned schools: Eagle Springs Elementary (math 45% / reading 47%, grade D-, #316 of 1,228 statewide, top 26%, 704 students, 66% FRL); Thomson Middle School (math 29% / reading 34%, grade F, #234 of 470 statewide, top 50%, 736 students, 84% FRL); Northside High School (math 5% / reading 21%, grade F, #331 of 424 statewide, top 78%, 1,959 students, 84% FRL) — zoned schools average 78% FRL vs 46% district-wide (32 pts higher); higher-poverty schools than district average — tighter screening recommended.
- Zoned-school proficiency averages 30% at this address vs 44% district-wide (-14 pts) — the specific schools serving this property underperform the Houston County average; the district grade overstates school quality for this exact location.
- Market conditions: 205 active listings in the ZIP; 18 comparable units currently listed for rent nearby; rentals at typical pace (median 21d on market — plan ~3-4 weeks tenant-placement turnaround); 1,545 units permitted in Houston County in 2024 (336 in 5+ unit buildings).
Forward outlook
- Local home prices are declining (-3.0%/yr); year-one equity from $830 of loan paydown is wiped out by about $4k of value loss. Plan a longer hold.
- Houston County population projected at +22% by 2050 — long-run rental-demand tailwind backs the buy-and-hold thesis.
- At projected returns (-3.0% appreciation + 3.0% rent growth), your $34k cash investment doubles in ~6 years — after that, you're playing with house money.
Negotiation context
- It's been on market 18 days — a 2% lower offer ($118k) is reasonable based on typical stale-listing flexibility.
- 4 sale attempts since 2y ago with the ask held roughly flat each time — persistent listings suggest the price (not the market) is what's stuck; bring a comps-based counter.
- Current owner paid $16k; list at $120k implies a 650% gain — meaningful room to come down on a strong offer.
Risks & watch-outs
- Climate carrying-cost: major wind risk, 73% chance of damaging wind over 30y; extreme-heat days projected 7→19/yr by 2055 (HVAC capex compounding) — expect insurance premiums to compound above CPI over the hold.
Questions for the listing agent
- Is there a deadline driving the sale (1031 exchange, divorce, estate, relocation)? That informs how much negotiation room exists.
- Schools are D-rated, which usually means shorter tenancies and higher turnover. Who's the typical renter profile here, and what's been the actual vacancy rate?
- Crime grade is F in this area — have there been break-ins, vandalism, or insurance claims at this property in the last 3 years? What carrier currently insures it and at what premium?
- What's the average days-on-market for RENTAL listings here right now (not sales)? A rising rental-DOM trend means longer vacancies and softer asking-rent achievability than the comps imply.
- What's the recent tenant-quality profile in this submarket — average credit score on applications, eviction rate, late-payment / NSF rate, and stable-employment percentage? A property-management company in the area should have these aggregated.
- How much new for-sale + rental construction is in the pipeline within 1–3 miles? Heavy new supply typically softens prices + rents 12–24 months out; constrained supply supports both.
Investment metrics
- 1% rule
- 1.49% ✓
- Cap rate
- 13.08%
- Cash-on-cash
- 24.25%
- DSCR
- 2.08
- GRM
- 5.6
CMA / ARV
No comps found within radius.
Projected returns pro-forma
-3.0% appreciation · 3.0% rent growth · sell at horizon
- IRR
- 17.5%
- Equity multiple
- 1.71×
- Total profit
- $23,764
- Equity at exit
- $17,892
- IRR
- 26.0%
- Equity multiple
- 3.27×
- Total profit
- $76,244
- Equity at exit
- $10,375
Cash invested: $33,600 (down + closing). Projections, not guarantees.
Landlord ↔ Tenant lean methodology
- Overall (STATE)
- 90 Strongly Landlord-Friendly
- State Georgia
- 90 Strongly Landlord-Friendly · R+3
- County
- — inherits STATE
- City
- — inherits STATE
ZIP-level market 31008
- Home prices YoY
- -18.1%
- Active inventory
- 205
- Price-to-rent
- 5.6×
Monthly cashflow live
- Estimated rent
- $1,788 high interval (Pro) →
- Mortgage (P&I)
- −$629
- Tax from tax record
- −$54 /mo · $651/yr
- Insurance
- −$50
- HOA
- −$0
- Vacancy / Maint / Mgmt
- −$375
- Net cashflow
- $679
Break-even live
UW: 25.0% down · 7.5% · 30yr · 1.5% tax · 5.0% vac · 8.0% maint · 8.0% mgmt
Financing live
Cash to close
- Down payment
- $30,000
- Closing costs
- $3,600
- Reserves months
- —
- Total cash needed
- —
Loan-product check · same deal, 3 products live
Conventional
25% down · 7.5% · 30yr
- Down + closing
- —
- Monthly P&I
- —
- Monthly cashflow
- —
- DSCR
- —
- Eligible?
- —
Personal DTI + credit; lowest rate.
DSCR
20% down · 8.5% · 30yr
- Down + closing
- —
- Monthly P&I
- —
- Monthly cashflow
- —
- DSCR
- —
- Eligible?
- —
No personal income docs; deal must DSCR.
Hard money
10% down · 12.0% · 12mo
- Down + closing
- —
- Monthly P&I
- —
- Monthly cashflow
- —
- DSCR
- —
- Eligible?
- —
Short-term bridge; refi at stabilization.
Rent comps 18 comps
| Address | Beds | Baths | Sqft | Rent | $/sqft | DOM | Units | Dist |
|---|---|---|---|---|---|---|---|---|
| 420 Madison Place Pkwy Byron, GA | 3.0 | 2.0 | 1341 | $2,000 | $1.49 | 13d | 1 | 0.13mi |
| 415 Covington Cv Byron, GA | 4.0 | 2.0 | 1472 | $1,820 | $1.24 | 13d | 1 | 0.13mi |
| 213 Merlot Dr Byron, GA | 2.0 | 2.0 | 1632 | $1,500 | $0.92 | 43d | 1 | 0.25mi |
| 302 Timberwind Dr Byron, GA | 3.0 | 2.0 | 1449 | $1,500 | $1.04 | 13d | 1 | 0.36mi |
| 307 Timberwind Dr Byron, GA | 3.0 | 2.5 | 1908 | $1,850 | $0.97 | 13d | 1 | 0.38mi |
| 206 Beau Claire Cir Byron, GA | 4.0 | 3.0 | 2145 | $1,950 | $0.91 | 43d | 1 | 0.45mi |
| 800 Gunn Rd Centerville, GA | 1.0–3.0 | 1.0–2.0 | 1100 | $1,715 | $1.56 | 13d | 2 | 0.53mi |
| 3415 US Highway 41 N Byron, GA | 2.0 | 2.0 | 1170 | $1,490 | $1.27 | 13d | 15 | 0.64mi |
| 104 Village Walk Centerville, GA | 3.0 | 2.0 | 1887 | $1,950 | $1.03 | 43d | 1 | 0.74mi |
| 111 Brighton Dr Byron, GA | 3.0 | 2.0 | 1782 | $1,400 | $0.79 | 21d | 1 | 0.91mi |
| 111 Brighton Dr Byron, GA | 3.0 | 2.0 | 1782 | $1,500 | $0.84 | 43d | 1 | 0.91mi |
| 100 Place Dr Byron, GA | 1.0–3.0 | 1.0–2.0 | 1099 | $1,925 | $1.75 | 13d | 41 | 1.00mi |
| 115 Tom Chapman Blvd Warner Robins, GA | 1.0–3.0 | 1.0–2.0 | 1066 | $1,632 | $1.53 | 13d | 10 | 1.01mi |
| 114 Tahoe Ln Warner Robins, GA | 3.0 | 2.0 | 1349 | $1,800 | $1.33 | 43d | 1 | 1.26mi |
| 807 Citrona Dr Byron, GA | 4.0 | 2.5 | 2164 | $2,020 | $0.93 | 43d | 1 | 1.27mi |
| 807 Citrona Dr Byron, GA | 4.0 | 2.5 | 2164 | $2,020 | $0.93 | 21d | 1 | 1.27mi |
| 156 Amelia Dr Byron, GA | 4.0 | 3.0 | 2200 | $2,300 | $1.05 | 13d | 1 | 1.33mi |
| 110 Sea Oaks Ct Byron, GA | 3.0 | 2.0 | 2055 | $2,050 | $1.00 | 43d | 1 | 1.41mi |
Listing history 15 events
-
2026-06-19days on market $120,000 Active 18 DOM
-
2026-06-18days on market $120,000 Active 17 DOM
-
2026-06-17days on market $120,000 Active 16 DOM
-
2026-06-16days on market $120,000 Active 15 DOM
-
2026-06-15statusdays on market $120,000 Active 14 DOM
-
2026-06-14days on market $120,000 New 12 DOM
-
2026-06-13days on market $120,000 New 11 DOM
-
2026-06-10days on market $120,000 New 9 DOM
-
2026-06-09days on market $120,000 New 8 DOM
-
2026-06-08days on market $120,000 New 7 DOM
-
2026-06-07days on market $120,000 New 6 DOM
-
2026-06-05days on market $120,000 New 3 DOM
-
2026-06-03days on market $120,000 New 2 DOM
-
2026-06-02remarks 568-char remark
-
2026-06-02$120,000 New 1 DOM
ⓘ Source: listings_history table (triggers on properties + properties_extension) + one-shot
backfill from property_details.listing_events for pre-trigger history.
Tax reassessment forecast GA · Resets to sale price
- Current annual tax
- $651 · $54/mo
- Projected year-2 tax
- $1,104 · $92/mo
- Expected delta
- +$453/yr (+$38/mo · 69.7%)
ⓘ Screening estimate from a state-policy table — verify with the county assessor before closing.
Climate risk First Street
- Flood 1/10 Low FEMA zone X (unshaded) · 0% chance over 30 yrs
- Wildfire 3/10 Moderate
- Heat 7/10 Severe 7 d/yr ≥108°F today · 19 d/yr by 30 yrs out
- Wind 6/10 Major 73% chance of damaging wind over 30 yrs
- Air quality 3/10 Moderate 2 unhealthy d/yr today · 3 by 30 yrs out
Nearby sold comps map
Loading sold comps map…
Walkable amenities ~0.75 mi
Loading nearby amenities…
Taxation est. · year 1
- Rental income
- $21,455
- − Mortgage interest
- −$6,722
- − Property taxes
- −$651
- − Insurance
- −$600
- − Repairs & maintenance
- −$1,716
- − Management
- −$1,716
- − Depreciation
- −$3,491
- Taxable income
- $6,559
- Est. tax owed @ 24.0%
- −$1,574
- After-tax cash flow
- $6,573/yr
For passive investors: Depreciation is non-cash, so a rental often shows a tax loss while cash-flowing — sheltering income. Rental losses are passive: they offset passive income freely, and up to $25,000/yr can offset ordinary (W-2) income if you actively participate and your MAGI is under $100k (phasing out to $0 by $150k); unused losses carry forward. On sale, claimed depreciation is recaptured at up to 25%, and gains may owe capital-gains tax (a 1031 exchange can defer both). Figures are a year-1 estimate at your 24.0% rate — not tax advice; consult a CPA.
Schools (NCES district)
- District
- Houston County
- NCES district ID
- 1302880
- Math proficiency
- 43% ▼ -7.00%
- Reading proficiency
- 46% ▼ -2.00%
- Median HH income
- $54,823
- Composite
- 38.68/100
- National rank
- #4144
- State rank
- #23 of 174 in GA
Livability — Warner Robins
- Score
- 65/100
- State rank
- #227
- US rank
- #13290
Category grades
Schools grade is shown separately in the Schools card above.
Census & demographics
- Census place
- Warner Robins, GA
- City population
- 92,102
- Population (ZIP)
- 20,882
Population outlook (Houston County) Hauer SSP2
- Today (2025)
- 169,502 people
- By 2030
- 178,486 · +5.3%
- By 2040
- 194,642 · +14.8%
- By 2050
- 207,119 · +22.2%
- By 2075
- 231,480 · +36.6%
- By 2100
- 235,034 · +38.7%
Race, ethnicity, and origin ACS 2023
- Neighborhood character
- Majority White (61%)
- Race & ethnicity
- White 61% Black 27% Two or more races 7% Hispanic / Latino 6%
- Hispanic origin (detail)
- Mexican 3% Puerto Rican 2%
- Common ancestry
- Slovak 2% Serbian 1% Lithuanian 1%
- Foreign-born
- 2% · Canada
- Languages at home
- 95% English-only · Spanish 4%
Political lean MEDSL · Houston
- 2024 margin
- R (+11.3) · D 44.0% · R 55.3%
- 2008→2024 swing
- +8.9pp toward D · 2008: -20.2pp · 2024: -11.3pp
- All cycles
- 2024: R+11.3 2020: R+12.4 2016: R+21.6 2012: R+20.7 2008: R+20.2
Not yet ingested
- Civics
- —
Market trends
- HPI YoY
- ▼ -45.93%
- Current HPI
- 208.0889
- Rent YoY
- —
- Metro
- —
- State GDP YoY
- ▲ 2.66%
- F500 in state
- 28
Industry mix (Fortune 500 HQ in GA)
| Industry | F500 HQs | Revenue |
|---|---|---|
| Paper / Packaging | 2 | $29B |
|
||
| Retail | 1 | $160B |
|
||
| Transportation / Logistics | 1 | $91B |
|
||
| Airlines | 1 | $62B |
|
||
| Consumer Goods | 1 | $47B |
|
||
| Utilities | 1 | $25B |
|
||
Price history
+650.0% since first listed8 events — show timeline
- 2026-05-30 Listed $120,000 GAMLS
- 2024-11-16 Delisted — CGMLS
- 2024-11-15 Listing Removed — GAMLS
- 2024-11-15 Listing Removed — GAMLS
- 2024-05-16 Listed $480,000 CGMLS
- 2024-05-15 Listed $480,000 GAMLS
- 2024-05-15 Listed $120,000 GAMLS
- 2002-06-12 Sold (Public Records) $16,000 Public Records
Property tax history
+7.0%/yrLatest (2025): $651 · +8.9% YoY. Source: county tax records.
Cash-flow waterfall
monthlySold comps — $/sqft
last 12 mo · ≤1 miLoading sold comps…