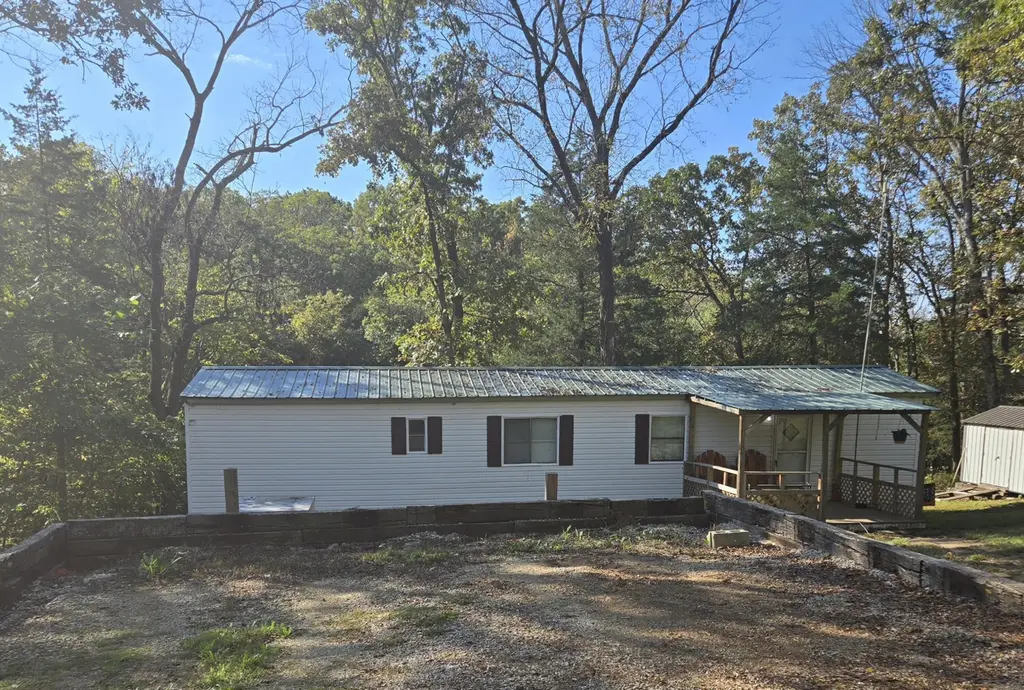
26756 County Road 365c · Urbana, MO
Flood risk 1/10 · Minimal
- FEMA flood zone
- —
- Chance of flooding over 30 yrs
- 0.0%
- Est. flood insurance / yr
- —
Fire risk 4/10 · Minor
- Est. fire insurance / yr
- $1,054 – $1,958
Heat risk 4/10 · Minor
- Hot days now (above 107°F)
- 7 days/yr
- Hot days in 30 yrs
- 19 days/yr
Wind risk 2/10 · Minimal
- Chance of severe wind over 30 yrs
- —
Air-quality risk 2/10 · Minimal
- Unhealthy air days now
- 0 days/yr
- Unhealthy air days in 30 yrs
- 1 days/yr
Risk factors via First Street. Map © Google.
Why this score? — see what drove the C grade
The composite is a weighted blend of 9 inputs, each scored 0–100. Each bar is that input's sub-score; the figure is the points it added to the 100-point composite (weight × sub-score).
- ARV discount +14.3/15.0
- Cash flow +12.9/30.0
- Appreciation +8.2/10.0
- Schools +5.4/10.0
- DSCR +3.9/10.0
- 1% rule +3.7/10.0
- Livability +2.9/5.0
- Rent growth +2.5/5.0
- Condition / age +2.2/5.0
$95,000
🖨 Deal sheet 📄 Offer letter ✓ Due diligence
Listing remarks MLS
Wonderful country setting from the drive in on CR 365C to arriving at the property is so tranquil. This property has so many nice features, 2 bedroom, 1 bathroom, 728 square feet of rustic living with covered decks. The kitchen has so much character, seller has updated the property including a bath remodel in 2025. The property is a . 8 acre lot that borders Corp land and minutes from the Pomme de Terre lake access. For the hunter enthusiast a deer stand is set up on the property and stays with the property. There is a wet weather creek that runs through the property. The wildlife is plentiful, and the interior is so cozy to enjoy and love the country lifestyle. Currently, there is an electric fence that will go with the seller along with the horse! All appliances stay and furnishing are negotiable. The septic and well is on this property and the neighbor shares access with the water. The shed has electric and would be a nice workshop. The property is surrounded by woods and waiting for you!
Key facts
- Covered decks
- Wet weather creek
- Borders corp land
Tags
Neighborhood map
What this means for you Summary
Snapshot
- This is a 2-bed/1.0-bath manufactured listed at $95k. Condition is rated fair.
Deal economics
- At list price, monthly cash flow is $-7 ($-83/yr) — negative.
- To cash-flow at today's rent, offer at most $94k (1.1% below list).
- To meet the 1% rule (rent ≥ 1% of price), the offer needs to be $82k (13.4% below list).
- Recommended offer: $82k (13.4% below list) — sets the bar for 1% rule.
- Cap rate 6.2% vs local median 4.2% in Urbana — top-decile yield for the area; either an underpriced asset or a hidden risk that comps aren't pricing in. Stress-test before assuming the spread holds.
Location & tenants
- Location reads 57/100 on livability (#629 in MO) — a working-class tenant base; expect higher turnover. Strengths: cost of living A+, housing A+; Watch: crime F, amenities F, commute F.
- Hickory County R-I (rural): math 65% / reading 66% proficiency, ranked #8 of 324 in MO (top 2%) — acceptable for families but not a draw, mixed tenant base, ~2y average lease.
- Market conditions: 35 active listings in the ZIP.
Forward outlook
- In year one you build about $7k of equity ($657 loan paydown + $6k appreciation (6.3% local appreciation)).
- Hickory County population projected at -26% by 2050 — secular population decline; favor cash flow + early exit over multi-decade hold.
- At projected returns (6.3% appreciation + 3.0% rent growth), your $27k cash investment doubles in ~4 years — after that, you're playing with house money.
- By year 6, paydown + projected appreciation supports a ~$37k cash-out refi (75% LTV) — recoverable capital for the next deal without selling this one.
Negotiation context
- It's been on market 247 days — a 12% lower offer ($84k) is reasonable based on typical stale-listing flexibility.
Questions for the listing agent
- What do current leases actually rent for vs. the listed asking? Can we see a recent rent roll and the last 12 months of T-12 income?
- It's been on market 247 days. Have you received any prior offers? Is the seller open to a 13% concession, seller financing, or rate buy-down credit?
- Have any recent inspections been done? Can we get a copy of the seller's disclosures and any deferred-maintenance estimates?
- Why hasn't it sold? Are there any deal-killer items the seller is aware of (foundation, flood, title, zoning, code violations)?
- Is there a deadline driving the sale (1031 exchange, divorce, estate, relocation)? That informs how much negotiation room exists.
- Schools are B-rated — typically a magnet for longer-tenancy family renters. What's the average tenant stay here, and is there a school-zone premium baked into asking?
- Crime grade is F in this area — have there been break-ins, vandalism, or insurance claims at this property in the last 3 years? What carrier currently insures it and at what premium?
- What's the average days-on-market for RENTAL listings here right now (not sales)? A rising rental-DOM trend means longer vacancies and softer asking-rent achievability than the comps imply.
- What's the recent tenant-quality profile in this submarket — average credit score on applications, eviction rate, late-payment / NSF rate, and stable-employment percentage? A property-management company in the area should have these aggregated.
- How much new for-sale + rental construction is in the pipeline within 1–3 miles? Heavy new supply typically softens prices + rents 12–24 months out; constrained supply supports both.
Investment metrics
- 1% rule
- 0.87% ✗
- Cap rate
- 6.21%
- Cash-on-cash
- -0.31%
- DSCR
- 0.99
- GRM
- 9.6
CMA / ARV
- ARV (median comp)
- $111,857
- List price
- $95,000
- Delta
- -15.07%
- Verdict
- UNDERPRICED
- Comps
- 2 within 2.0 mi
Projected returns pro-forma
6.35% appreciation · 3.0% rent growth · sell at horizon
- IRR
- 16.0%
- Equity multiple
- 2.09×
- Total profit
- $28,982
- Equity at exit
- $61,827
- IRR
- 15.8%
- Equity multiple
- 4.20×
- Total profit
- $85,134
- Equity at exit
- $113,986
Cash invested: $26,600 (down + closing). Projections, not guarantees.
Landlord ↔ Tenant lean methodology
- Overall (STATE)
- 81 Strongly Landlord-Friendly
- State Missouri
- 81 Strongly Landlord-Friendly · R+10
- County
- — inherits STATE
- City
- — inherits STATE
ZIP-level market 65767
- Home prices YoY
- 2.5%
- Active inventory
- 35
- Price-to-rent
- 9.6×
Monthly cashflow live
- Estimated rent
- $822 medium interval (Pro) →
- Mortgage (P&I)
- −$498
- Tax est. 1.5%
- −$119 /mo · $1,425/yr
- Insurance
- −$40
- HOA
- −$0
- Vacancy / Maint / Mgmt
- −$173
- Net cashflow
- $-7
Break-even live
UW: 25.0% down · 7.5% · 30yr · 1.5% tax · 5.0% vac · 8.0% maint · 8.0% mgmt
Financing live
Cash to close
- Down payment
- $23,750
- Closing costs
- $2,850
- Reserves months
- —
- Total cash needed
- —
Loan-product check · same deal, 3 products live
Conventional
25% down · 7.5% · 30yr
- Down + closing
- —
- Monthly P&I
- —
- Monthly cashflow
- —
- DSCR
- —
- Eligible?
- —
Personal DTI + credit; lowest rate.
DSCR
20% down · 8.5% · 30yr
- Down + closing
- —
- Monthly P&I
- —
- Monthly cashflow
- —
- DSCR
- —
- Eligible?
- —
No personal income docs; deal must DSCR.
Hard money
10% down · 12.0% · 12mo
- Down + closing
- —
- Monthly P&I
- —
- Monthly cashflow
- —
- DSCR
- —
- Eligible?
- —
Short-term bridge; refi at stabilization.
Listing history 17 events
-
2026-06-19days on market $95,000 Active 247 DOM
-
2026-06-18days on market $95,000 Active 246 DOM
-
2026-06-17days on market $95,000 Active 245 DOM
-
2026-06-16days on market $95,000 Active 244 DOM
-
2026-06-15days on market $95,000 Active 243 DOM
-
2026-06-14days on market $95,000 Active 241 DOM
-
2026-06-12days on market $95,000 Active 240 DOM
-
2026-06-09days on market $95,000 Active 237 DOM
-
2026-06-08days on market $95,000 Active 236 DOM
-
2026-06-07days on market $95,000 Active 235 DOM
-
2026-06-05days on market $95,000 Active 232 DOM
-
2026-06-03days on market $95,000 Active 231 DOM
-
2026-06-02days on market $95,000 Active 230 DOM
-
2026-06-01days on market $95,000 Active 229 DOM
-
2026-05-31days on market $95,000 Active 228 DOM
-
2026-05-30days on market $95,000 Active 227 DOM
-
2025-10-15$95,000 Active 1007-char remark
Show marketing remark (1007 chars)
Wonderful country setting from the drive in on CR 365C to arriving at the property is so tranquil. This property has so many nice features, 2 bedroom, 1 bathroom, 728 square feet of rustic living with covered decks. The kitchen has so much character, seller has updated the property including a bath remodel in 2025. The property is a . 8 acre lot that borders Corp land and minutes from the Pomme de Terre lake access. For the hunter enthusiast a deer stand is set up on the property and stays with the property. There is a wet weather creek that runs through the property. The wildlife is plentiful, and the interior is so cozy to enjoy and love the country lifestyle. Currently, there is an electric fence that will go with the seller along with the horse! All appliances stay and furnishing are negotiable. The septic and well is on this property and the neighbor shares access with the water. The shed has electric and would be a nice workshop. The property is surrounded by woods and waiting for you!
ⓘ Source: listings_history table (triggers on properties + properties_extension) + one-shot
backfill from property_details.listing_events for pre-trigger history.
Climate risk First Street
- Flood 1/10 Low 0% chance over 30 yrs
- Wildfire 4/10 Moderate
- Heat 4/10 Moderate 7 d/yr ≥107°F today · 19 d/yr by 30 yrs out
- Wind 2/10 Low
- Air quality 2/10 Low 0 unhealthy d/yr today · 1 by 30 yrs out
Nearby sold comps map
Loading sold comps map…
Walkable amenities ~0.75 mi
Loading nearby amenities…
Taxation est. · year 1
- Rental income
- $9,868
- − Mortgage interest
- −$5,321
- − Property taxes
- −$1,425
- − Insurance
- −$475
- − Repairs & maintenance
- −$789
- − Management
- −$789
- − Depreciation
- −$2,764
- Taxable loss
- −$1,696
- Est. tax savings @ 24.0%
- +$407
- After-tax cash flow
- $324/yr
For passive investors: Depreciation is non-cash, so a rental often shows a tax loss while cash-flowing — sheltering income. Rental losses are passive: they offset passive income freely, and up to $25,000/yr can offset ordinary (W-2) income if you actively participate and your MAGI is under $100k (phasing out to $0 by $150k); unused losses carry forward. On sale, claimed depreciation is recaptured at up to 25%, and gains may owe capital-gains tax (a 1031 exchange can defer both). Figures are a year-1 estimate at your 24.0% rate — not tax advice; consult a CPA.
Condition & rehab AI · 12 photos
This manufactured home requires moderate repairs and maintenance, particularly in the kitchen and exterior. Upgrades to the interior walls, kitchen cabinets, and bathroom fixtures can significantly enhance its resale and rental value.
Repairs flagged
- Moderate Kitchen cabinets — Worn and dated appearance
- Minor Bathroom fixtures — Simple and outdated fixtures
- Moderate Exterior siding — Some areas appear loose or damaged
- Moderate Interior walls — Paint peeling and discoloration
- Minor Windows — May need sealing or replacement
Value-add opportunities
- Resale Paint interior walls — Fresh paint can significantly improve the home's appearance and value.
- Resale Replace worn kitchen cabinets — New cabinets can enhance the kitchen's functionality and aesthetic.
- Resale Update bathroom fixtures — Modern fixtures can make the bathroom more appealing and functional.
- Both Landscaping improvements — Enhanced landscaping can improve curb appeal and add value to the property.
- Rental HVAC maintenance — A well-maintained HVAC system can attract renters and reduce utility costs.
Renovation cost estimate screening
| Repair item | Severity | Est. cost |
|---|---|---|
| Kitchen cabinets · Worn and dated appearance | Moderate | $3,000–15,000 |
| Bathroom fixtures · Simple and outdated fixtures | Minor | $500–3,000 |
| Exterior siding · Some areas appear loose or damaged | Moderate | $3,000–15,000 |
| Interior walls · Paint peeling and discoloration | Moderate | $3,000–15,000 |
| Windows · May need sealing or replacement | Minor | $500–3,000 |
| Total estimated repair cost · 5 items | $10,000–51,000 |
Value-add ROI direction
- Resale Paint interior walls — Fresh paint can significantly improve the home's appearance and value. ↑
- Resale Replace worn kitchen cabinets — New cabinets can enhance the kitchen's functionality and aesthetic. ↑
- Resale Update bathroom fixtures — Modern fixtures can make the bathroom more appealing and functional. ↑
- Both Landscaping improvements — Enhanced landscaping can improve curb appeal and add value to the property. ↑
- Rental HVAC maintenance — A well-maintained HVAC system can attract renters and reduce utility costs. ↑
ⓘ Cost ranges are severity-bucket heuristics (US national rule-of-thumb). Get contractor quotes + a written scope before underwriting a rehab budget.
Schools (NCES district)
- District
- Hickory County R-I
- NCES district ID
- 2914320
- Math proficiency
- 65% ▼ -4.00%
- Reading proficiency
- 66% ▲ 1.00%
- Median HH income
- $33,125
- Composite
- 54.03/100
- National rank
- #1393
- State rank
- #8 of 324 in MO
Livability — Urbana
- Score
- 57/100
- State rank
- #629
- US rank
- #21576
Category grades
Schools grade is shown separately in the Schools card above.
Census & demographics
- Population (ZIP)
- 1,860
Population outlook (Hickory County) Hauer SSP2
- Today (2025)
- 8,206 people
- By 2030
- 7,690 · -6.3%
- By 2040
- 6,780 · -17.4%
- By 2050
- 6,076 · -26.0%
- By 2075
- 5,088 · -38.0%
- By 2100
- 4,489 · -45.3%
Race, ethnicity, and origin ACS 2023
- Neighborhood character
- Predominantly White (94%)
- Race & ethnicity
- White 94% Two or more races 5%
- Common ancestry
- Romanian 14% Iranian 9% Italian 1%
- Foreign-born
- 0%
Political lean MEDSL · Hickory
- 2024 margin
- Solid R (+61.1) · D 19.1% · R 80.2%
- 2008→2024 swing
- -47.9pp toward R · 2008: -13.3pp · 2024: -61.1pp
- All cycles
- 2024: R+61.1 2020: R+57.3 2016: R+53.5 2012: R+23.6 2008: R+13.3
Not yet ingested
- Civics
- —
Market trends
- HPI YoY
- ▲ 6.35%
- Current HPI
- 256.3794
- Rent YoY
- —
- Metro
- —
- State GDP YoY
- ▲ 1.84%
- F500 in state
- 20
Industry mix (Fortune 500 HQ in MO)
| Industry | F500 HQs | Revenue |
|---|---|---|
| Healthcare | 1 | $163B |
|
||
| Insurance | 1 | $21B |
|
||
| Industrial Technology | 1 | $17B |
|
||
| Retail | 1 | $16B |
|
||
| Industrial Distribution | 1 | $10B |
|
||
| Utilities | 1 | $9B |
|
||
Price history
1 event — show timeline
- 2025-10-15 Listed $95,000 SOMO
Cash-flow waterfall
monthlySold comps — $/sqft
last 12 mo · ≤1 miLoading sold comps…