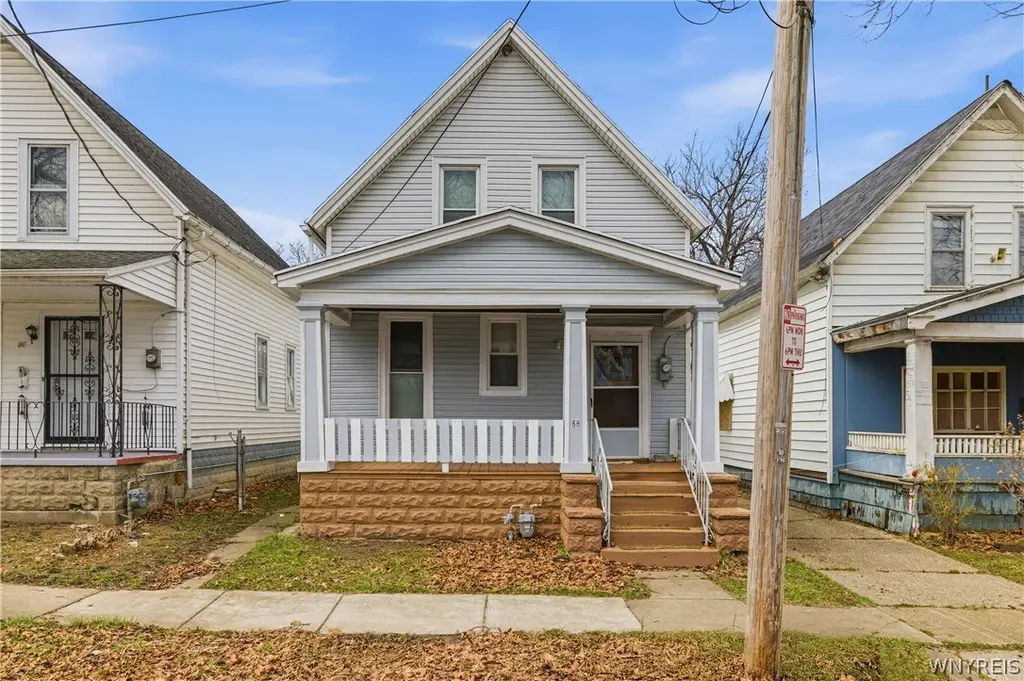
88 Roehrer Ave · Buffalo, NY
Flood risk 1/10 · Minimal
- FEMA flood zone
- X (unshaded)
- Chance of flooding over 30 yrs
- 0.0%
- Est. flood insurance / yr
- $473 – $860
Fire risk 1/10 · Minimal
- Est. fire insurance / yr
- $691 – $1,283
Heat risk 2/10 · Minimal
- Hot days now (above 93°F)
- 7 days/yr
- Hot days in 30 yrs
- 14 days/yr
Wind risk 1/10 · Minimal
- Chance of severe wind over 30 yrs
- —
Air-quality risk 3/10 · Minor
- Unhealthy air days now
- 2 days/yr
- Unhealthy air days in 30 yrs
- 3 days/yr
Risk factors via First Street. Map © Google.
Why this score? — see what drove the B+ grade
The composite is a weighted blend of 9 inputs, each scored 0–100. Each bar is that input's sub-score; the figure is the points it added to the 100-point composite (weight × sub-score).
- Cash flow +30.0/30.0
- ARV discount +15.0/15.0
- 1% rule +10.0/10.0
- DSCR +10.0/10.0
- Livability +3.9/5.0
- Schools +3.3/10.0
- Rent growth +2.5/5.0
- Condition / age +2.5/5.0
- Appreciation +0.0/10.0
$99,900
🖨 Deal sheet 📄 Offer letter ✓ Due diligence
Listing remarks MLS
Check out this well maintained house right around the corner from City Honors. With a little TLC, this property would make an amazing rental or family home for whomever owns it next. Vinyl floors, new windows, and a newer kitchen and bathroom make this home a must see. The roof needs some work. The back room is in need of your finishing touches. Initial drywall and flooring work has been finished, but the rest is up to next owner. Open house this weekend on Saturday from 1-3 and Sunday from 11-1. Offers are due May 6th at 1pm.
Key facts
- 3,300 sq ft lot
- Built 1857
- Listed 40 days
Neighborhood map
What this means for you Summary
Snapshot
- This is a 3-bed/1.0-bath single-family listed at $100k.
Deal economics
- At list price, monthly cash flow is $899 ($11k/yr) — positive.
- The deal already cash-flows at list — no discount required.
- Meets the 1% rule at list price ($2k rent vs $100k).
- Recommended offer: $97k (3.0% below list) — sets the bar for market timing.
- Cap rate 17.1% vs local median 8.0% in Buffalo — top-decile yield for the area; either an underpriced asset or a hidden risk that comps aren't pricing in. Stress-test before assuming the spread holds.
Location & tenants
- Location reads 77/100 on livability (#195 in NY, #3,011 nationally) — a middle-class / working-renter tenant base. Strengths: commute A+, housing A+, health & safety A+; Watch: crime F, employment D-.
- Buffalo City School District (urban): math 41% / reading 40% proficiency, ranked #535 of 590 in NY (top 91%) — families likely to look elsewhere, expect single-tenant / working-renter base with shorter leases; 75% free/reduced lunch — lower-income household profile, screen leases tightly.
- Market conditions: 54 active listings in the ZIP; 34 comparable units currently listed for rent nearby; rentals at typical pace (median 21d on market — plan ~3-4 weeks tenant-placement turnaround); 1,244 units permitted in Erie County in 2024 (563 in 5+ unit buildings).
- At $2,012/mo this rent would consume 50% of the median local household income ($48k/yr) (locally 723% of renters already pay >50% of income on rent) — very limited rent-growth headroom before tenants either downsize or default.
Forward outlook
- Local home prices are declining (-3.0%/yr); year-one equity from $691 of loan paydown is wiped out by about $3k of value loss. Plan a longer hold.
- At projected returns (-3.0% appreciation + 3.0% rent growth), your $28k cash investment doubles in ~4 years — after that, you're playing with house money.
Negotiation context
- It's been on market 40 days — a 3% lower offer ($97k) is reasonable based on typical stale-listing flexibility.
- 3 sale attempts since 2y ago; this cycle's ask has dropped $25k (20%) from the opening price — seller is motivated, your offer sets the floor, not the list.
- Current owner paid $55k; list at $100k implies a 82% gain — meaningful room to come down on a strong offer.
Risks & watch-outs
- Watch-outs: built in 1857 — expect roof / HVAC / electrical / plumbing capex.
Questions for the listing agent
- It's been on market 40 days. Have you received any prior offers? Is the seller open to a 3% concession, seller financing, or rate buy-down credit?
- Built in 1857 — when were the roof, HVAC, electrical panel, plumbing, and water heater last replaced?
- Is there a deadline driving the sale (1031 exchange, divorce, estate, relocation)? That informs how much negotiation room exists.
- Crime grade is F in this area — have there been break-ins, vandalism, or insurance claims at this property in the last 3 years? What carrier currently insures it and at what premium?
- What's the average days-on-market for RENTAL listings here right now (not sales)? A rising rental-DOM trend means longer vacancies and softer asking-rent achievability than the comps imply.
- What's the recent tenant-quality profile in this submarket — average credit score on applications, eviction rate, late-payment / NSF rate, and stable-employment percentage? A property-management company in the area should have these aggregated.
- How much new for-sale + rental construction is in the pipeline within 1–3 miles? Heavy new supply typically softens prices + rents 12–24 months out; constrained supply supports both.
Investment metrics
- 1% rule
- 2.01% ✓
- Cap rate
- 17.09%
- Cash-on-cash
- 38.56%
- DSCR
- 2.72
- GRM
- 4.1
CMA / ARV
- ARV (median comp)
- $122,337
- List price
- $99,900
- Delta
- -18.34%
- Verdict
- UNDERPRICED
- Comps
- 20 within 1.0 mi
Show comp detail 4 sales within ~0.75 mi
| Address | Dist | Beds/Ba | Sqft | Sold | Price | $/sf | Match |
|---|---|---|---|---|---|---|---|
| 718 Northampton St | 0.47mi | 3/1.0 | 1,041 (-0%) | 14mo | $112,000 | $108 | 65 |
| 598 High St | 0.44mi | 3/1.0 | 1,139 (+9%) | 7mo | $115,000 | $101 | 59 |
| 218 Locust St St | 0.72mi | 4/1.0 (+1) | 1,100 (+5%) | 18mo | $53,000 | $48 | 38 |
| 1274 Michigan Ave | 0.69mi | 3/1.5 | 1,152 (+10%) | 23mo | $213,000 | $185 | 29 |
Match score weights: distance 35% · size 25% · config 20% · recency 20%. Top-matched comps best support the ARV.
Projected returns pro-forma
-3.0% appreciation · 3.0% rent growth · sell at horizon
- IRR
- 34.7%
- Equity multiple
- 2.47×
- Total profit
- $41,082
- Equity at exit
- $14,895
- IRR
- 41.5%
- Equity multiple
- 4.92×
- Total profit
- $109,603
- Equity at exit
- $8,638
Cash invested: $27,972 (down + closing). Projections, not guarantees.
Landlord ↔ Tenant lean methodology
- Overall (STATE)
- 15 Strongly Tenant-Friendly
- State New York
- 15 Strongly Tenant-Friendly · D+10
- County
- — inherits STATE
- City
- — inherits STATE
ZIP-level market 14208
- Home prices YoY
- -3.4%
- Active inventory
- 54
- Price-to-rent
- 4.1×
Monthly cashflow live
- Estimated rent
- $2,012 high interval (Pro) →
- Mortgage (P&I)
- −$524
- Tax est. 1.5%
- −$125 /mo · $1,498/yr
- Insurance
- −$42
- HOA
- −$0
- Vacancy / Maint / Mgmt
- −$422
- Net cashflow
- $899
Break-even live
UW: 25.0% down · 7.5% · 30yr · 1.5% tax · 5.0% vac · 8.0% maint · 8.0% mgmt
Financing live
Cash to close
- Down payment
- $24,975
- Closing costs
- $2,997
- Reserves months
- —
- Total cash needed
- —
Loan-product check · same deal, 3 products live
Conventional
25% down · 7.5% · 30yr
- Down + closing
- —
- Monthly P&I
- —
- Monthly cashflow
- —
- DSCR
- —
- Eligible?
- —
Personal DTI + credit; lowest rate.
DSCR
20% down · 8.5% · 30yr
- Down + closing
- —
- Monthly P&I
- —
- Monthly cashflow
- —
- DSCR
- —
- Eligible?
- —
No personal income docs; deal must DSCR.
Hard money
10% down · 12.0% · 12mo
- Down + closing
- —
- Monthly P&I
- —
- Monthly cashflow
- —
- DSCR
- —
- Eligible?
- —
Short-term bridge; refi at stabilization.
Rent comps 34 comps
| Address | Beds | Baths | Sqft | Rent | $/sqft | DOM | Units | Dist |
|---|---|---|---|---|---|---|---|---|
| 1145 Michigan Ave Buffalo, NY | 2.0 | 1.0–2.0 | 655 | $2,049 | $3.13 | 43d | 1 | 0.69mi |
| 104 Butler Ave Buffalo, NY | 3.0 | 1.0 | 1000 | $1,400 | $1.40 | 43d | 1 | 0.72mi |
| 184 Butler Ave Unit 1545840P Buffalo, NY | 4.0 | 1.0 | 1496 | $3,226 | $2.16 | 14d | 1 | 0.74mi |
| 408 Winslow Ave Unit 2 Buffalo, NY | 3.0 | 1.0 | 1000 | $1,050 | $1.05 | 14d | 1 | 0.77mi |
| 76 Chester St Unit 1 Buffalo, NY | 3.0 | 1.0 | 1100 | $1,000 | $0.91 | 14d | 1 | 0.77mi |
| 983 Michigan Ave Buffalo, NY | 2.0 | 1.0–2.0 | 804 | $3,202 | $3.98 | 2d | 58 | 0.84mi |
| 19 E Utica St Unit 203 Buffalo, NY | 2.0 | 1.0 | 850 | $1,300 | $1.53 | 14d | 1 | 0.89mi |
| 179 Donaldson Rd Buffalo, NY | 3.0 | 1.0 | 1152 | $1,350 | $1.17 | 3d | 1 | 0.89mi |
| 1155 Main St Buffalo, NY | 2.0 | 1.0–2.0 | 592 | $2,300 | $3.88 | 43d | 1 | 0.94mi |
| 1152 Main St Apt 3 Buffalo, NY | 3.0 | 1.0 | 1000 | $2,400 | $2.40 | 14d | 1 | 0.99mi |
| 102 Florida St Buffalo, NY | 3.0 | 1.0 | 1296 | $1,650 | $1.27 | 43d | 1 | 1.05mi |
| 130 Linwood Ave Buffalo, NY | 2.0 | 1.0 | 900 | $1,900 | $2.11 | 23d | 1 | 1.08mi |
| 19 North St Buffalo, NY | 2.0 | 1.0–2.0 | 1306 | $2,910 | $2.23 | 10d | 7 | 1.09mi |
| 88 W Utica St Unit 1 Buffalo, NY | 3.0 | 2.0 | 990 | $2,150 | $2.17 | 14d | 1 | 1.10mi |
| 88 W Utica St Unit 1 Buffalo, NY | 3.0 | 2.0 | 990 | $2,150 | $2.17 | 3d | 1 | 1.10mi |
| 40 North St Unit 306 Buffalo, NY | 2.0 | 1.5 | 1125 | $1,950 | $1.73 | 43d | 1 | 1.13mi |
| 1786 Main St Unit 104 Buffalo, NY | 2.0 | 2.0 | 1256 | $1,875 | $1.49 | 43d | 1 | 1.16mi |
| 1786 Main St Unit 103 Buffalo, NY | 2.0 | 1.5 | 1110 | $1,677 | $1.51 | 43d | 1 | 1.16mi |
| 916 Delaware Ave Buffalo, NY | 2.0 | 1.0 | 750 | $1,625 | $2.17 | 3d | 9 | 1.17mi |
| 888 Delaware Ave Buffalo, NY | 2.0 | 1.0–2.0 | 899 | $2,440 | $2.71 | 23d | 1 | 1.19mi |
| 1040 Delaware Ave Buffalo, NY | 1.0–2.0 | 1.0 | 687 | $1,500 | $2.18 | 3d | 4 | 1.19mi |
| 1165 Delaware Ave Buffalo, NY | 1.0–2.0 | 1.0 | 658 | $1,250 | $1.90 | 43d | 1 | 1.20mi |
| 44 N Pearl St #5 Buffalo, NY | 3.0 | 1.0 | 1200 | $2,400 | $2.00 | 43d | 1 | 1.28mi |
| 628 Ellicott St Buffalo, NY | 1.0–2.0 | 1.0–2.0 | 1059 | $2,812 | $2.65 | 2d | 5 | 1.29mi |
| 17 N Pearl St Buffalo, NY | 2.0 | 2.0 | 1077 | $2,700 | $2.51 | 23d | 1 | 1.29mi |
| 17 N Pearl St Unit 3 Buffalo, NY | 3.0 | 2.0 | 1197 | $3,100 | $2.59 | 23d | 1 | 1.29mi |
| 238 Oxford Ave Unit Upper Buffalo, NY | 3.0 | 1.0 | 1100 | $1,600 | $1.45 | 23d | 1 | 1.34mi |
| 519 Virginia St Buffalo, NY | 1.0–2.0 | 1.0–2.0 | 700 | $1,700 | $2.43 | 3d | 3 | 1.35mi |
| 1310 Delaware Ave Buffalo, NY | 2.0 | 1.0 | 684 | $1,275 | $1.86 | 43d | 1 | 1.38mi |
| 213 Summer St Unit 3 Buffalo, NY | 2.0 | 1.0 | 1020 | $2,450 | $2.40 | 21d | 1 | 1.38mi |
| 506 Delaware Ave Buffalo, NY | 1.0–2.0 | 1.0–1.5 | 1190 | $2,995 | $2.52 | 10d | 6 | 1.42mi |
| 489 Ellicott St Unit 36 Buffalo, NY | 2.0 | 2.0 | 1000 | $1,550 | $1.55 | 3d | 1 | 1.45mi |
| 344 Elmwood Ave Unit 3rd floor Buffalo, NY | 2.0 | 1.0 | 1000 | $1,400 | $1.40 | 23d | 1 | 1.45mi |
| 569 Elmwood Ave Buffalo, NY | 2.0 | 1.0 | 1500 | $1,750 | $1.17 | 11d | 1 | 1.48mi |
Listing history 8 events
-
2026-05-16status Pending
-
2026-04-16status Active
-
2026-04-15price $99,900
-
2026-04-06$124,999 Active
-
2026-02-13soldstatus $55,000
-
2024-05-22status Pending 532-char remark
Show marketing remark (532 chars)
Check out this well maintained house right around the corner from City Honors. With a little TLC, this property would make an amazing rental or family home for whomever owns it next. Vinyl floors, new windows, and a newer kitchen and bathroom make this home a must see. The roof needs some work. The back room is in need of your finishing touches. Initial drywall and flooring work has been finished, but the rest is up to next owner. Open house this weekend on Saturday from 1-3 and Sunday from 11-1. Offers are due May 6th at 1pm.
-
2024-04-26$69,900 Active 532-char remark
Show marketing remark (532 chars)
Check out this well maintained house right around the corner from City Honors. With a little TLC, this property would make an amazing rental or family home for whomever owns it next. Vinyl floors, new windows, and a newer kitchen and bathroom make this home a must see. The roof needs some work. The back room is in need of your finishing touches. Initial drywall and flooring work has been finished, but the rest is up to next owner. Open house this weekend on Saturday from 1-3 and Sunday from 11-1. Offers are due May 6th at 1pm.
-
2017-02-16soldstatus $300,000
ⓘ Source: listings_history table (triggers on properties + properties_extension) + one-shot
backfill from property_details.listing_events for pre-trigger history.
Climate risk First Street
- Flood 1/10 Low FEMA zone X (unshaded) · 0% chance over 30 yrs
- Wildfire 1/10 Low
- Heat 2/10 Low 7 d/yr ≥93°F today · 14 d/yr by 30 yrs out
- Wind 1/10 Low
- Air quality 3/10 Moderate 2 unhealthy d/yr today · 3 by 30 yrs out
Nearby sold comps map
Loading sold comps map…
Walkable amenities ~0.75 mi
Loading nearby amenities…
Taxation est. · year 1
- Rental income
- $24,138
- − Mortgage interest
- −$5,596
- − Property taxes
- −$1,498
- − Insurance
- −$500
- − Repairs & maintenance
- −$1,931
- − Management
- −$1,931
- − Depreciation
- −$2,906
- Taxable income
- $9,776
- Est. tax owed @ 24.0%
- −$2,346
- After-tax cash flow
- $8,438/yr
For passive investors: Depreciation is non-cash, so a rental often shows a tax loss while cash-flowing — sheltering income. Rental losses are passive: they offset passive income freely, and up to $25,000/yr can offset ordinary (W-2) income if you actively participate and your MAGI is under $100k (phasing out to $0 by $150k); unused losses carry forward. On sale, claimed depreciation is recaptured at up to 25%, and gains may owe capital-gains tax (a 1031 exchange can defer both). Figures are a year-1 estimate at your 24.0% rate — not tax advice; consult a CPA.
Schools (NCES district)
- District
- Buffalo City School District
- NCES district ID
- 3605850
- Math proficiency
- 41% ▲ 11.00%
- Reading proficiency
- 40% ▲ 7.00%
- Median HH income
- $31,665
- Composite
- 33.17/100
- National rank
- #5544
- State rank
- #535 of 590 in NY
Livability — Buffalo
- Score
- 77/100
- State rank
- #195
- US rank
- #3011
Category grades
Schools grade is shown separately in the Schools card above.
Census & demographics
- Census place
- Buffalo, NY
- County
- Erie County · 714,559 people
- City population
- 440,021
- Metro
- Buffalo-Cheektowaga, NY
- Population (ZIP)
- 12,572
- Household income
- $48,476
- Rent vs Own
- Severe rent burden
- 723.0
Population outlook (Erie County) Hauer SSP2
- Today (2025)
- 933,037 people
- By 2030
- 935,181 · +0.2%
- By 2040
- 928,531 · -0.5%
- By 2050
- 905,725 · -2.9%
- By 2075
- 834,037 · -10.6%
- By 2100
- 708,033 · -24.1%
Race, ethnicity, and origin ACS 2023
- Neighborhood character
- Predominantly Black (72%)
- Race & ethnicity
- Black 72% White 15% Asian 6% Two or more races 4% Hispanic / Latino 3%
- Common ancestry
- Romanian 2% Italian 1% Hispanic 0%
- Foreign-born
- 7% · Canada, South Korea, Philippines
- Languages at home
- 89% English-only · Other Indo-European 3% Spanish 2% French/Haitian/Cajun 1%
Political lean MEDSL · Erie
- 2024 margin
- Lean D (+9.7) · D 54.8% · R 45.2%
- 2008→2024 swing
- -7.9pp toward R · 2008: 17.5pp · 2024: 9.7pp
- All cycles
- 2024: D+9.7 2020: D+14.7 2016: D+4.8 2012: D+15.6 2008: D+17.5
Not yet ingested
- Civics
- —
Market trends
- HPI YoY
- ▼ -16.37%
- Current HPI
- 459.2084
- Rent YoY
- —
- Metro
- Buffalo-Cheektowaga, NY
- State GDP YoY
- ▲ 2.60%
- F500 in state
- 92
Industry mix (Fortune 500 HQ in NY)
| Industry | F500 HQs | Revenue |
|---|---|---|
| Financial Services | 10 | $950B |
|
||
| Consumer Goods | 9 | $162B |
|
||
| Insurance | 4 | $225B |
|
||
| Telecommunications | 2 | $144B |
|
||
| Pharmaceuticals | 2 | $112B |
|
||
| Media / Entertainment | 2 | $69B |
|
||
Price history
-66.7% since first listed8 events — show timeline
- 2026-05-16 Pending — WNYREIS
- 2026-04-16 Relisted — WNYREIS
- 2026-04-15 Price Changed $99,900 WNYREIS
- 2026-04-06 Listed $124,999 WNYREIS
- 2026-02-13 Sold (Public Records) $55,000 Public Records
- 2024-05-22 Pending — WNYREIS
- 2024-04-26 Listed $69,900 WNYREIS
- 2017-02-16 Sold (Public Records) $300,000 Public Records
Property tax history
+4.9%/yrLatest (2025): $146 · +0.0% YoY. Source: county tax records.
Cash-flow waterfall
monthlySold comps — $/sqft
last 12 mo · ≤1 miLoading sold comps…