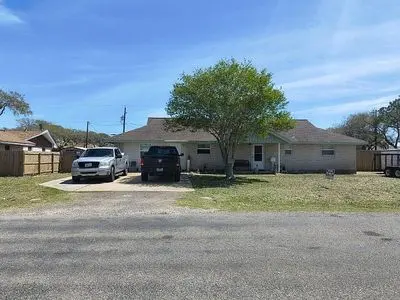
168 Sunset · Ingleside on the Bay, TX
Flood risk 1/10 · Minimal
- FEMA flood zone
- X (unshaded)
- Chance of flooding over 30 yrs
- 0.0%
- Est. flood insurance / yr
- $507 – $1,088
Fire risk 3/10 · Minor
- Est. fire insurance / yr
- $1,222 – $2,270
Heat risk 10/10 · Severe
- Hot days now (above 106°F)
- 7 days/yr
- Hot days in 30 yrs
- 28 days/yr
Wind risk 9/10 · Severe
- Chance of severe wind over 30 yrs
- 99.0%
Air-quality risk 1/10 · Minimal
- Unhealthy air days now
- 0 days/yr
- Unhealthy air days in 30 yrs
- 0 days/yr
Risk factors via First Street. Map © Google.
Why this score? — see what drove the C- grade
The composite is a weighted blend of 9 inputs, each scored 0–100. Each bar is that input's sub-score; the figure is the points it added to the 100-point composite (weight × sub-score).
- Cash flow +16.5/30.0
- ARV discount +15.0/15.0
- DSCR +5.1/10.0
- 1% rule +4.7/10.0
- Livability +3.7/5.0
- Schools +3.6/10.0
- Condition / age +2.5/5.0
- Appreciation +0.0/10.0
- Rent growth +0.0/5.0
$205,000
🖨 Deal sheet 📄 Offer letter ✓ Due diligence
Listing remarks MLS
Walking distance to the new boat launch and the bay for some of the best fishing in South Texas. .. .this 3 bedroom, 2 bath home has lots of extras. .. the open floor plan is a plus and the screened in sun room for relaxing in the hot tub, the covered patio to enjoy the breeze all day long, a metal storage bldg previously used for an art studio and an additional 2 car metal workshop in the back of the house with alley access. .. RV/Boat parking. .. large lot and a house that is full of potential. ..
Key facts
- Large backyard
- 40 ft shop
- Built 1970
Tags
Neighborhood map
What this means for you Summary
Snapshot
- This is a 4-bed/2.0-bath single-family listed at $205k.
Deal economics
- At list price, monthly cash flow is $121 ($1k/yr) — positive.
- The deal already cash-flows at list — no discount required.
- To meet the 1% rule (rent ≥ 1% of price), the offer needs to be $200k (2.6% below list).
- Recommended offer: $200k (2.6% below list) — sets the bar for 1% rule.
Location & tenants
- Location reads 73/100 on livability (#233 in TX) — a middle-class / working-renter tenant base. Strengths: employment A+, housing A+, crime B+; Watch: schools D-, amenities F, commute F.
- Ingleside ISD (town): math 39% / reading 44% proficiency, ranked #319 of 826 in TX (top 39%) — families likely to look elsewhere, expect single-tenant / working-renter base with shorter leases.
- Market conditions: Rents falling (-11.8%/yr); 146 active listings in the ZIP; 344 units permitted in San Patricio County in 2024 (0 in 5+ unit buildings).
- This rent runs 34% of the median local income ($71k/yr) — at the standard rent-burdened threshold; future hikes will face affordability resistance.
Forward outlook
- Local home prices are declining (-3.0%/yr); year-one equity from $1k of loan paydown is wiped out by about $6k of value loss. Plan a longer hold.
- San Patricio County population projected at +27% by 2050 — long-run rental-demand tailwind backs the buy-and-hold thesis.
Negotiation context
- It's been on market 16 days — a 2% lower offer ($202k) is reasonable based on typical stale-listing flexibility.
- 3 sale attempts since 17y ago with the ask held roughly flat each time — persistent listings suggest the price (not the market) is what's stuck; bring a comps-based counter.
Risks & watch-outs
- Climate carrying-cost: severe wind risk, 99% chance of damaging wind over 30y; extreme-heat days projected 7→28/yr by 2055 (HVAC capex compounding) — expect insurance premiums to compound above CPI over the hold.
Questions for the listing agent
- Built in 1970 — when were the roof, HVAC, electrical panel, plumbing, and water heater last replaced?
- Is there a deadline driving the sale (1031 exchange, divorce, estate, relocation)? That informs how much negotiation room exists.
- Schools are D-rated, which usually means shorter tenancies and higher turnover. Who's the typical renter profile here, and what's been the actual vacancy rate?
- What's the average days-on-market for RENTAL listings here right now (not sales)? A rising rental-DOM trend means longer vacancies and softer asking-rent achievability than the comps imply.
- What's the recent tenant-quality profile in this submarket — average credit score on applications, eviction rate, late-payment / NSF rate, and stable-employment percentage? A property-management company in the area should have these aggregated.
- How much new for-sale + rental construction is in the pipeline within 1–3 miles? Heavy new supply typically softens prices + rents 12–24 months out; constrained supply supports both.
Investment metrics
- 1% rule
- 0.97% ✗
- Cap rate
- 7.00%
- Cash-on-cash
- 2.54%
- DSCR
- 1.11
- GRM
- 8.6
CMA / ARV
- ARV (median comp)
- $311,790
- List price
- $205,000
- Delta
- 2.31%
- Verdict
- FAIR
- Comps
- 20 within 1.0 mi
Show comp detail 4 sales within ~0.75 mi
| Address | Dist | Beds/Ba | Sqft | Sold | Price | $/sf | Match |
|---|---|---|---|---|---|---|---|
| 316 Inglewood | 0.22mi | 4/3.0 | 1,846 (-7%) | 14mo | $489,000 | $265 | 62 |
| 605 Woodhaven | 0.62mi | 3/2.0 (-1) | 2,222 (+11%) | 7mo | $595,000 | $268 | 41 |
| 602 N Sandpiper | 0.70mi | 3/2.0 (-1) | 1,716 (-14%) | 9mo | $185,000 | $108 | 31 |
| 109 Bayshore Ct | 0.66mi | 3/4.0 (-1) | 2,180 (+9%) | 13mo | $528,000 | $242 | 30 |
Match score weights: distance 35% · size 25% · config 20% · recency 20%. Top-matched comps best support the ARV.
Projected returns pro-forma
-3.0% appreciation · 0.0% rent growth · sell at horizon
- IRR
- -15.8%
- Equity multiple
- 0.46×
- Total profit
- $-31,280
- Equity at exit
- $30,566
- IRR
- -13.9%
- Equity multiple
- 0.31×
- Total profit
- $-39,669
- Equity at exit
- $17,725
Cash invested: $57,400 (down + closing). Projections, not guarantees.
Landlord ↔ Tenant lean methodology
- Overall (STATE)
- 87 Strongly Landlord-Friendly
- State Texas
- 87 Strongly Landlord-Friendly · R+5
- County
- — inherits STATE
- City
- — inherits STATE
ZIP-level market 78362
- Home prices YoY
- -21.7%
- Rents YoY
- -11.8%
- Active inventory
- 146
- Price-to-rent
- 8.6×
Monthly cashflow live
- Estimated rent
- $1,997 medium interval (Pro) →
- Mortgage (P&I)
- −$1,075
- Tax from tax record
- −$295 /mo · $3,544/yr
- Insurance
- −$85
- HOA
- −$0
- Vacancy / Maint / Mgmt
- −$419
- Net cashflow
- $121
Break-even live
UW: 25.0% down · 7.5% · 30yr · 1.5% tax · 5.0% vac · 8.0% maint · 8.0% mgmt
Financing live
Cash to close
- Down payment
- $51,250
- Closing costs
- $6,150
- Reserves months
- —
- Total cash needed
- —
Loan-product check · same deal, 3 products live
Conventional
25% down · 7.5% · 30yr
- Down + closing
- —
- Monthly P&I
- —
- Monthly cashflow
- —
- DSCR
- —
- Eligible?
- —
Personal DTI + credit; lowest rate.
DSCR
20% down · 8.5% · 30yr
- Down + closing
- —
- Monthly P&I
- —
- Monthly cashflow
- —
- DSCR
- —
- Eligible?
- —
No personal income docs; deal must DSCR.
Hard money
10% down · 12.0% · 12mo
- Down + closing
- —
- Monthly P&I
- —
- Monthly cashflow
- —
- DSCR
- —
- Eligible?
- —
Short-term bridge; refi at stabilization.
Listing history 17 events
-
2026-06-18days on market $205,000 Active 16 DOM
-
2026-06-17days on market $205,000 Active 15 DOM
-
2026-06-16days on market $205,000 Active 14 DOM
-
2026-06-15days on market $205,000 Active 13 DOM
-
2026-06-14days on market $205,000 Active 11 DOM
-
2026-06-10days on market $205,000 Active 8 DOM
-
2026-06-09days on market $205,000 Active 7 DOM
-
2026-06-08days on market $205,000 Active 6 DOM
-
2026-06-07days on market $205,000 Active 5 DOM
-
2026-06-03remarks 655-char remark
-
2026-06-03pricestatusdays on market $205,000 Active 1 DOM
-
2026-04-23price $319,000
-
2026-03-29$329,000 Active
-
2016-08-31soldstatus
-
2009-09-03soldstatus
-
2009-09-01soldstatus 504-char remark
Show marketing remark (504 chars)
Walking distance to the new boat launch and the bay for some of the best fishing in South Texas. .. .this 3 bedroom, 2 bath home has lots of extras. .. the open floor plan is a plus and the screened in sun room for relaxing in the hot tub, the covered patio to enjoy the breeze all day long, a metal storage bldg previously used for an art studio and an additional 2 car metal workshop in the back of the house with alley access. .. RV/Boat parking. .. large lot and a house that is full of potential. ..
-
2009-07-16$95,500 504-char remark
Show marketing remark (504 chars)
Walking distance to the new boat launch and the bay for some of the best fishing in South Texas. .. .this 3 bedroom, 2 bath home has lots of extras. .. the open floor plan is a plus and the screened in sun room for relaxing in the hot tub, the covered patio to enjoy the breeze all day long, a metal storage bldg previously used for an art studio and an additional 2 car metal workshop in the back of the house with alley access. .. RV/Boat parking. .. large lot and a house that is full of potential. ..
ⓘ Source: listings_history table (triggers on properties + properties_extension) + one-shot
backfill from property_details.listing_events for pre-trigger history.
Tax reassessment forecast TX · Resets to sale price
- Current annual tax
- $3,544 · $295/mo
- Projected year-2 tax
- $3,752 · $313/mo
- Expected delta
- +$207/yr (+$17/mo · 5.8%)
ⓘ Screening estimate from a state-policy table — verify with the county assessor before closing.
Climate risk First Street
- Flood 1/10 Low FEMA zone X (unshaded) · 0% chance over 30 yrs
- Wildfire 3/10 Moderate
- Heat 10/10 Extreme 7 d/yr ≥106°F today · 28 d/yr by 30 yrs out
- Wind 9/10 Extreme 99% chance of damaging wind over 30 yrs
- Air quality 1/10 Low 0 unhealthy d/yr today · 0 by 30 yrs out
Nearby sold comps map
Loading sold comps map…
Walkable amenities ~0.75 mi
Loading nearby amenities…
Taxation est. · year 1
- Rental income
- $23,958
- − Mortgage interest
- −$11,483
- − Property taxes
- −$3,544
- − Insurance
- −$1,025
- − Repairs & maintenance
- −$1,917
- − Management
- −$1,917
- − Depreciation
- −$5,964
- Taxable loss
- −$1,891
- Est. tax savings @ 24.0%
- +$454
- After-tax cash flow
- $1,911/yr
For passive investors: Depreciation is non-cash, so a rental often shows a tax loss while cash-flowing — sheltering income. Rental losses are passive: they offset passive income freely, and up to $25,000/yr can offset ordinary (W-2) income if you actively participate and your MAGI is under $100k (phasing out to $0 by $150k); unused losses carry forward. On sale, claimed depreciation is recaptured at up to 25%, and gains may owe capital-gains tax (a 1031 exchange can defer both). Figures are a year-1 estimate at your 24.0% rate — not tax advice; consult a CPA.
Schools (NCES district)
- District
- Ingleside ISD
- NCES district ID
- 4824180
- Math proficiency
- 39% ▼ -9.00%
- Reading proficiency
- 44% ▲ 1.00%
- Median HH income
- $57,908
- Composite
- 36.48/100
- National rank
- #4659
- State rank
- #319 of 826 in TX
Livability — Ingleside on the Bay
- Score
- 73/100
- State rank
- #233
- US rank
- #5685
Category grades
Schools grade is shown separately in the Schools card above.
Census & demographics
- Census place
- Ingleside on the Bay, TX
- County
- San Patricio County · 31,224 people
- Metro
- Corpus Christi, TX
- Population (ZIP)
- 10,816
- Household income
- $71,058
- Rent vs Own
- Severe rent burden
- 226.0
Population outlook (San Patricio County) Hauer SSP2
- Today (2025)
- 75,538 people
- By 2030
- 79,575 · +5.3%
- By 2040
- 87,670 · +16.1%
- By 2050
- 96,107 · +27.2%
- By 2075
- 117,984 · +56.2%
- By 2100
- 130,010 · +72.1%
Race, ethnicity, and origin ACS 2023
- Neighborhood character
- Diverse neighborhood (Simpson 0.56)
- Race & ethnicity
- White 52% Hispanic / Latino 42% Two or more races 19% Black 2%
- Hispanic origin (detail)
- Mexican 39% Cuban 2%
- Common ancestry
- Slovak 1% Portuguese 1% Romanian 1%
- Foreign-born
- 8% · Canada
- Languages at home
- 78% English-only · Spanish 20%
Political lean MEDSL · San Patricio
- 2024 margin
- Solid R (+36.4) · D 31.4% · R 67.8%
- 2008→2024 swing
- -19.8pp toward R · 2008: -16.6pp · 2024: -36.4pp
- All cycles
- 2024: R+36.4 2020: R+29.1 2016: R+24.1 2012: R+20.6 2008: R+16.6
Not yet ingested
- Civics
- —
Market trends
- HPI YoY
- ▼ -54.88%
- Current HPI
- 197.9261
- Rent YoY
- ▼ -11.80%
- Metro
- Corpus Christi, TX
- State GDP YoY
- ▲ 3.95%
- F500 in state
- 110
Industry mix (Fortune 500 HQ in TX)
| Industry | F500 HQs | Revenue |
|---|---|---|
| Energy | 16 | $1,198B |
|
||
| Technology | 5 | $198B |
|
||
| Engineering / Construction | 4 | $72B |
|
||
| Energy Services | 3 | $60B |
|
||
| Utilities | 3 | $41B |
|
||
| Healthcare | 2 | $330B |
|
||
Price history
+114.7% since first listed7 events — show timeline
- 2026-06-03 Listed $205,000 FSBO.com
- 2026-04-23 Price Changed $319,000 CBMLS
- 2026-03-29 Listed $329,000 CBMLS
- 2016-08-31 Sold (Public Records) — Public Records
- 2009-09-03 Sold (Public Records) — Public Records
- 2009-09-01 Sold (MLS) — CBMLS
- 2009-07-16 Listed $95,500 CBMLS
Property tax history
+6.6%/yrLatest (2025): $3,544 · +12.0% YoY. Source: county tax records.
Cash-flow waterfall
monthlySold comps — $/sqft
last 12 mo · ≤1 miLoading sold comps…