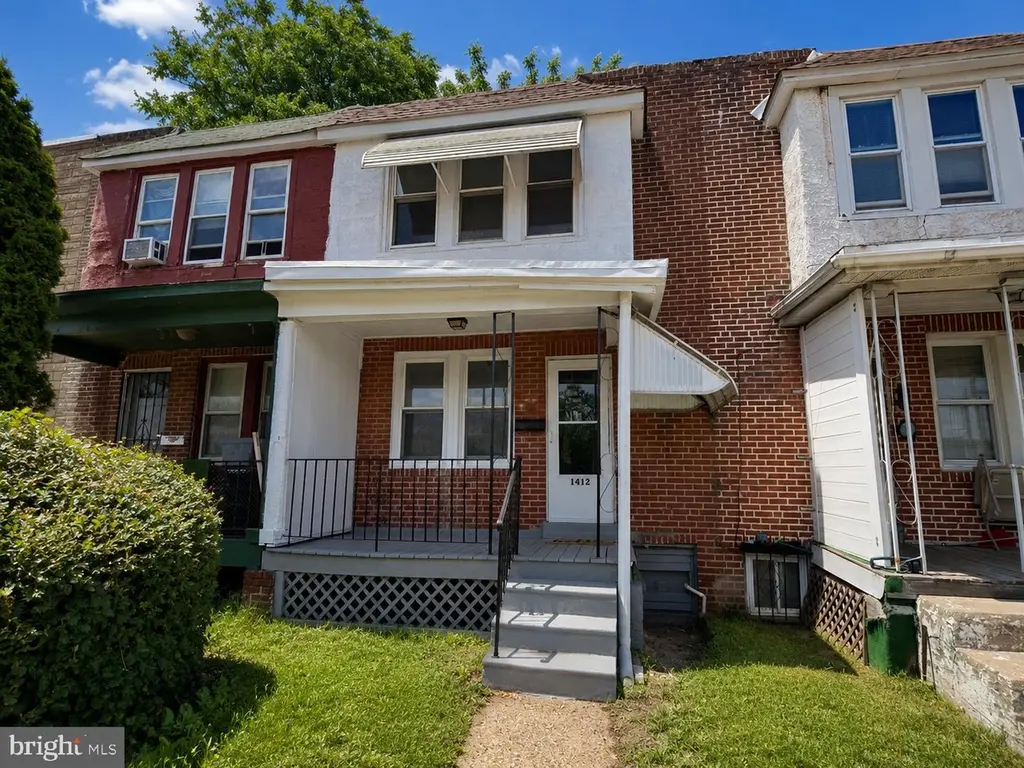
1412 W 9th St · Chester, PA
Flood risk 1/10 · Minimal
- FEMA flood zone
- X (unshaded)
- Chance of flooding over 30 yrs
- 0.0%
- Est. flood insurance / yr
- $473 – $860
Fire risk 1/10 · Minimal
- Est. fire insurance / yr
- $511 – $949
Heat risk 7/10 · Major
- Hot days now (above 105°F)
- 7 days/yr
- Hot days in 30 yrs
- 15 days/yr
Wind risk 6/10 · Moderate
- Chance of severe wind over 30 yrs
- 27.0%
Air-quality risk 4/10 · Minor
- Unhealthy air days now
- 4 days/yr
- Unhealthy air days in 30 yrs
- 7 days/yr
Risk factors via First Street. Map © Google.
Why this score? — see what drove the D- grade
The composite is a weighted blend of 9 inputs, each scored 0–100. Each bar is that input's sub-score; the figure is the points it added to the 100-point composite (weight × sub-score).
- Cash flow +16.2/30.0
- DSCR +5.0/10.0
- 1% rule +4.2/10.0
- Rent growth +4.2/5.0
- Livability +3.7/5.0
- Condition / age +2.5/5.0
- Schools +0.8/10.0
- ARV discount +0.0/15.0
- Appreciation +0.0/10.0
$169,959
🖨 Deal sheet (PDF) 📄 Offer letter ✓ Due diligence
Listing remarks
Welcome to 1412 W. 9th Street, a beautifully updated brick row home offering charm, comfort, and modern upgrades throughout. Enjoy peaceful mornings on the inviting covered front porch, perfectly positioned on an elevated lot with a pleasant neighborhood view. Inside, a bright and spacious living room flows into a formal dining room, creating an ideal space for both everyday living and entertaining. The modern kitchen features sleek quartz countertops, stylish white cabinetry, and stainless steel appliances. Upstairs you'll find three comfortable bedrooms with brand-new carpeting and an updated full bathroom. A rear door off the kitchen leads to a private fenced backyard retreat. Relax bene
Key facts
- Garage
- Built 1930
- Listed 6 days
Property features AI
Finance
- HOA & community: Ground rent paid annually
Exterior
- Parking: Rear-entry garage; One garage space; On-street parking available; Parking garage access
- Utilities: Public water; Public sewer; Electric service available; Natural gas available
- Home design: Interior townhouse/rowhouse; Fee simple ownership; Effective year of major remodel: 2026
- Construction: Brick construction; Block and brick/mortar foundation; Asphalt architectural shingle roof; Above- and below-grade structures
- Exterior features: Not located in a federal flood zone; Municipal trash service; Irrigation water rights
Interior
- Kitchen: Dishwasher; Microwave; Gas range/oven; Stainless steel appliances
- Bedrooms: Three bedrooms on the first upper level
- Flooring: Luxury vinyl plank; Carpet
- Bathrooms: One full bathroom
- Heating & cooling: Forced air heating; Natural gas heating
- Interior features: Living room; Dining room; Full basement; Two or more access exits
- Laundry & utility: Laundry in the basement; Electric hot water
Neighborhood map
What this means for you Summary
Snapshot
- This is a 3-bed/1.5-bath townhouse listed at $170k.
Deal economics
- At list price, monthly cash flow is $89 ($1k/yr) — positive.
- The deal already cash-flows at list — no discount required.
- To meet the 1% rule (rent ≥ 1% of price), the offer needs to be $157k (7.5% below list).
- Recommended offer: $157k (7.5% below list) — sets the bar for 1% rule.
Location & tenants
- Location reads 73/100 on livability (#540 in PA) — a middle-class / working-renter tenant base. Strengths: amenities A+, commute A+, cost of living A+; Watch: crime F, employment F.
- Chester-Upland SD (suburban): math 4% / reading 17% proficiency, ranked #533 of 539 in PA (top 99%) — low school quality limits family demand, transient renter base, plan for 1-2y turnover; 81% free/reduced lunch — lower-income household profile, screen leases tightly.
- Zoned schools: Toby Farms Intermediate School (math 2% / reading 12%, grade F, #506 of 512 statewide, top 99%, 299 students, 100% FRL) — zoned schools average 100% FRL vs 81% district-wide (19 pts higher); higher-poverty schools than district average — tighter screening recommended.
- Market conditions: Rents rising fast (+6.9%/yr); 140 active listings in the ZIP; 22 comparable units currently listed for rent nearby; rentals at typical pace (median 24d on market — plan ~3-4 weeks tenant-placement turnaround); lower-income renter base — watch delinquency; 299 units permitted in Delaware County in 2024 (5 in 5+ unit buildings).
- At $1,572/mo this rent would consume 46% of the median local household income ($41k/yr) (locally 2668% of renters already pay >50% of income on rent) — very limited rent-growth headroom before tenants either downsize or default.
Forward outlook
- Local home prices are declining (-3.0%/yr); year-one equity from $1k of loan paydown is wiped out by about $5k of value loss. Plan a longer hold.
Negotiation context
- Only 7 days on market — expect competitive offers; lowballing is unlikely to land.
Risks & watch-outs
- Watch-outs: built in 1930 — expect roof / HVAC / electrical / plumbing capex.
- Climate carrying-cost: major wind risk, 27% chance of damaging wind over 30y; extreme-heat days projected 7→15/yr by 2055 (HVAC capex compounding) — expect insurance premiums to compound above CPI over the hold.
Questions for the listing agent
- Built in 1930 — when were the roof, HVAC, electrical panel, plumbing, and water heater last replaced?
- Is there a deadline driving the sale (1031 exchange, divorce, estate, relocation)? That informs how much negotiation room exists.
- Schools are F-rated, which usually means shorter tenancies and higher turnover. Who's the typical renter profile here, and what's been the actual vacancy rate?
- Crime grade is F in this area — have there been break-ins, vandalism, or insurance claims at this property in the last 3 years? What carrier currently insures it and at what premium?
- The area grade is low — what's the realistic commute time and amenity access for the typical tenant pool here? Any planned neighborhood developments (good or bad) we should know about?
- What's the average days-on-market for RENTAL listings here right now (not sales)? A rising rental-DOM trend means longer vacancies and softer asking-rent achievability than the comps imply.
- What's the recent tenant-quality profile in this submarket — average credit score on applications, eviction rate, late-payment / NSF rate, and stable-employment percentage? A property-management company in the area should have these aggregated.
- How much new for-sale + rental construction is in the pipeline within 1–3 miles? Heavy new supply typically softens prices + rents 12–24 months out; constrained supply supports both.
Investment metrics
- 1% rule
- 0.92% ✗
- Cap rate
- 6.92%
- Cash-on-cash
- 2.24%
- DSCR
- 1.10
- GRM
- 9.0
CMA / ARV
- ARV (on-the-fly)
- $118,984
- Comps found
- 12
Show comp detail 12 sales within ~0.75 mi
| Address | Dist | Beds/Ba | Sqft | Sold | Price | $/sf | Match |
|---|---|---|---|---|---|---|---|
| 606 Norris St | 0.18mi | 3/1.0 | 1,188 (+7%) | 2mo | $149,500 | $126 | 77 |
| 920 Pennell St | 0.21mi | 3/1.0 | 1,042 (-6%) | 5mo | $55,000 | $53 | 73 |
| 224 Pennell St | 0.49mi | 2/1.0 (-1) | 1,134 (+2%) | 1mo | $60,000 | $53 | 66 |
| 1213 W 9th St | 0.20mi | 3/1.0 | 992 (-11%) | 8mo | $135,000 | $136 | 64 |
| 610 W 8th St | 0.62mi | 3/1.0 | 1,104 (-1%) | 5mo | $49,900 | $45 | 64 |
| 920 Butler St | 0.51mi | 3/1.0 | 1,024 (-8%) | 3mo | $143,100 | $140 | 58 |
| 1027 Butler St | 0.55mi | 3/1.5 | 1,200 (+8%) | 6mo | $136,000 | $113 | 56 |
| 2012 W 6th St | 0.42mi | 3/1.5 | 1,260 (+13%) | 10mo | $101,000 | $80 | 50 |
| 612 W 8th St | 0.62mi | 2/1.0 (-1) | 1,188 (+7%) | 7mo | $47,000 | $40 | 47 |
| 2314 W 3rd St | 0.72mi | 3/2.0 | 1,250 (+12%) | 1mo | $159,000 | $127 | 43 |
| 715 Engle St | 0.51mi | 3/2.0 | 1,268 (+14%) | 10mo | $130,000 | $103 | 43 |
| 803 W Mary St | 0.63mi | 4/1.5 (+1) | 1,256 (+13%) | 4mo | $135,000 | $107 | 41 |
Match score weights: distance 35% · size 25% · config 20% · recency 20%. Top-matched comps best support the ARV.
Projected returns pro-forma
-3.0% appreciation · 6.88% rent growth · sell at horizon
- IRR
- -8.5%
- Equity multiple
- 0.67×
- Total profit
- $-15,501
- Equity at exit
- $25,341
- IRR
- 5.4%
- Equity multiple
- 1.47×
- Total profit
- $22,164
- Equity at exit
- $14,695
Cash invested: $47,589 (down + closing). Projections, not guarantees.
Landlord ↔ Tenant lean methodology
- Overall (STATE)
- 62 Landlord-Friendly
- State Pennsylvania
- 62 Landlord-Friendly · EVEN
- County
- — inherits STATE
- City
- — inherits STATE
ZIP-level market 19013
- Rents YoY
- 6.9%
- Active inventory
- 140
- Price-to-rent
- 9.0×
Monthly cashflow live
- Estimated rent
- $1,572 high interval (Pro) →
- Mortgage (P&I)
- −$891
- Tax from tax record
- −$191 /mo · $2,289/yr
- Insurance
- −$71
- HOA
- −$0
- Vacancy / Maint / Mgmt
- −$330
- Net cashflow
- $89
Break-even live
Sensitivity live
| Price | -10% $185 | -5% $137 | +0% $89 | +5% $41 | +10% $-7 |
|---|---|---|---|---|---|
| Rent | -10% $-35 | -5% $27 | +0% $89 | +5% $151 | +10% $213 |
| Rate | -1.0pp $174 | -0.5pp $132 | base $89 | +0.5pp $45 | +1.0pp $0 |
UW: 25.0% down · 7.5% · 30yr · 1.5% tax · 5.0% vac · 8.0% maint · 8.0% mgmt
Financing live
Cash to close
- Down payment
- $42,490
- Closing costs
- $5,099
- Reserves months
- —
- Total cash needed
- —
Loan-product check · same deal, 3 products live
Conventional
25% down · 7.5% · 30yr
- Down + closing
- —
- Monthly P&I
- —
- Monthly cashflow
- —
- DSCR
- —
- Eligible?
- —
Personal DTI + credit; lowest rate.
DSCR
20% down · 8.5% · 30yr
- Down + closing
- —
- Monthly P&I
- —
- Monthly cashflow
- —
- DSCR
- —
- Eligible?
- —
No personal income docs; deal must DSCR.
Hard money
10% down · 12.0% · 12mo
- Down + closing
- —
- Monthly P&I
- —
- Monthly cashflow
- —
- DSCR
- —
- Eligible?
- —
Short-term bridge; refi at stabilization.
Rent comps 22 comps
| Address | Beds | Baths | Sqft | Rent | $/sqft | DOM | Units | Dist |
|---|---|---|---|---|---|---|---|---|
| 925 W 3rd St Chester, PA | 4.0 | 1.0 | 1500 | $1,700 | $1.13 | 20d | 1 | 0.51mi |
| 1127 Ward St Chester, PA | 2.0 | 1.0 | 800 | $1,250 | $1.56 | 9d | 1 | 0.76mi |
| 418 Penn St Chester, PA | 3.0 | 1.0 | 1250 | $1,350 | $1.08 | 45d | 1 | 0.94mi |
| 425 Highland Ave Apt A Chester, PA | 2.0 | 1.5 | 990 | $1,000 | $1.01 | 22d | 1 | 0.94mi |
| 1315 Harshaw Rd Brookhaven, PA | 3.0 | 2.5 | 1260 | $2,395 | $1.90 | 0d | 1 | 0.99mi |
| 2832 W 6th St Unit 306 Chester, PA | 3.0 | 1.0 | 1428 | $1,500 | $1.05 | 6d | 1 | 1.00mi |
| 1224 Elson Rd Brookhaven, PA | 3.0 | 2.0 | 1200 | $1,900 | $1.58 | 19d | 1 | 1.02mi |
| 1425 Highland Ave Chester, PA | 3.0 | 1.0 | 1212 | $7,998 | $6.60 | 0d | 1 | 1.04mi |
| 330 W 21st St Chester, PA | 3.0 | 1.0 | 1152 | $1,500 | $1.30 | 45d | 1 | 1.23mi |
| 908 Keystone Rd Chester, PA | 2.0 | 1.0 | 750 | $1,200 | $1.60 | 45d | 1 | 1.23mi |
| 906 Keystone Rd Unit 1 Chester, PA | 2.0 | 1.0 | 800 | $1,200 | $1.50 | 26d | 1 | 1.23mi |
| 906 Keystone Rd Chester, PA | 2.0 | 1.0 | 800 | $1,200 | $1.50 | 23d | 1 | 1.23mi |
| 3312 W 13th St Chester, PA | 2.0 | 1.0 | 936 | $1,499 | $1.60 | 23d | 1 | 1.24mi |
| 1107-1115 Keystone Rd Chester, PA | 2.0 | 1.0 | 700 | $1,250 | $1.79 | 45d | 1 | 1.24mi |
| 1006 Keystone Rd Unit 1 Chester, PA | 2.0 | 1.0 | 750 | $1,200 | $1.60 | 0d | 1 | 1.26mi |
| 1006 Keystone Rd Chester, PA | 2.0 | 1.0 | 750 | $1,200 | $1.60 | 26d | 1 | 1.26mi |
| 814 Upland St Chester, PA | 3.0 | 1.0 | 1344 | $1,525 | $1.13 | 9d | 1 | 1.43mi |
| 125 W 21st St Chester, PA | 4.0 | 1.5 | 1152 | $1,850 | $1.61 | 26d | 1 | 1.44mi |
| 280 Bridgewater Rd Brookhaven, PA | 1.0–2.0 | 1.0–1.5 | 775 | $1,800 | $2.32 | 26d | 2 | 1.45mi |
| 280 Bridgewater Rd Brookhaven, PA | 1.0–2.0 | 1.0–1.5 | 775 | $1,695 | $2.19 | 0d | 2 | 1.45mi |
| 25 W Parkway Ave Chester, PA | 3.0 | 1.0 | 1324 | $1,600 | $1.21 | 7d | 1 | 1.49mi |
| 30 W Roland Rd Brookhaven, PA | 3.0 | 1.0 | 1424 | $1,695 | $1.19 | 45d | 1 | 1.49mi |
Listing history 8 events
-
2026-06-18days on market $169,959 Active 7 DOM
-
2026-06-17days on market $169,959 Active 6 DOM
-
2026-06-16days on market $169,959 Active 5 DOM
-
2026-06-15days on market $169,959 Active 4 DOM
-
2026-06-13days on market $169,959 Active 2 DOM
-
2026-06-13status $169,959 Active 1 DOM
-
2026-06-09remarks 699-char remark
-
2026-06-09$169,959 Coming Soon 1 DOM
ⓘ Source: listings_history table (triggers on properties + properties_extension) + one-shot
backfill from property_details.listing_events for pre-trigger history.
Tax reassessment forecast PA · Partial reset (capped growth)
- Current annual tax
- $2,289 · $191/mo
- Projected year-2 tax
- $2,487 · $207/mo
- Expected delta
- +$198/yr (+$17/mo · 8.7%)
ⓘ Screening estimate from a state-policy table — verify with the county assessor before closing.
Climate risk First Street
- Flood 1/10 Low FEMA zone X (unshaded) · 0% chance over 30 yrs
- Wildfire 1/10 Low
- Heat 7/10 Severe 7 d/yr ≥105°F today · 15 d/yr by 30 yrs out
- Wind 6/10 Major 27% chance of damaging wind over 30 yrs
- Air quality 4/10 Moderate 4 unhealthy d/yr today · 7 by 30 yrs out
Nearby sold comps map
Loading sold comps map…
Walkable amenities ~0.75 mi
Loading nearby amenities…
Taxation est. · year 1
- Rental income
- $18,860
- − Mortgage interest
- −$9,520
- − Property taxes
- −$2,289
- − Insurance
- −$850
- − Repairs & maintenance
- −$1,509
- − Management
- −$1,509
- − Depreciation
- −$4,944
- Taxable loss
- −$1,761
- Est. tax savings @ 24.0%
- +$423
- After-tax cash flow
- $1,488/yr
For passive investors: Depreciation is non-cash, so a rental often shows a tax loss while cash-flowing — sheltering income. Rental losses are passive: they offset passive income freely, and up to $25,000/yr can offset ordinary (W-2) income if you actively participate and your MAGI is under $100k (phasing out to $0 by $150k); unused losses carry forward. On sale, claimed depreciation is recaptured at up to 25%, and gains may owe capital-gains tax (a 1031 exchange can defer both). Figures are a year-1 estimate at your 24.0% rate — not tax advice; consult a CPA.
Schools (NCES district)
- District
- Chester-Upland SD
- NCES district ID
- 4205860
- Math proficiency
- 4% ▼ -3.00%
- Reading proficiency
- 17% ▼ -6.00%
- Median HH income
- $29,790
- Composite
- 8.05/100
- National rank
- #9918
- State rank
- #533 of 539 in PA
Livability — Chester
- Score
- 73/100
- State rank
- #540
- US rank
- #5053
Category grades
Schools grade is shown separately in the Schools card above.
Census & demographics
- Census place
- Chester, PA
- County
- Delaware County · 399,863 people
- City population
- 35,064
- Metro
- Philadelphia-Camden-Wilmington, PA-NJ-DE-MD
- Population (ZIP)
- 35,064
- Household income
- $41,261
- Rent vs Own
- Severe rent burden
- 2668.0
Population outlook (Delaware County) Hauer SSP2
- Today (2025)
- 577,490 people
- By 2030
- 581,243 · +0.6%
- By 2040
- 584,700 · +1.2%
- By 2050
- 586,581 · +1.6%
- By 2075
- 598,706 · +3.7%
- By 2100
- 590,823 · +2.3%
Race, ethnicity, and origin ACS 2023
- Neighborhood character
- Predominantly Black (71%)
- Race & ethnicity
- Black 71% White 14% Hispanic / Latino 9% Two or more races 4%
- Hispanic origin (detail)
- Puerto Rican 6%
- Common ancestry
- Romanian 2%
- Foreign-born
- 4% · Canada
- Languages at home
- 92% English-only · Spanish 6%
Political lean MEDSL · Delaware
- 2024 margin
- Strong D (+23.7) · D 61.4% · R 37.6% · Other 1.0%
- 2008→2024 swing
- +2.3pp toward D · 2008: 21.4pp · 2024: 23.7pp
- All cycles
- 2024: D+23.7 2020: D+26.7 2016: D+22.0 2012: D+21.8 2008: D+21.4
Not yet ingested
- Civics
- —
Market trends
- HPI YoY
- ▼ -149.69%
- Current HPI
- 219.5173
- Rent YoY
- ▲ 6.88%
- Metro
- Philadelphia-Camden-Wilmington, PA-NJ-DE-MD
- State GDP YoY
- ▲ 1.68%
- F500 in state
- 34
Industry mix (Fortune 500 HQ in PA)
| Industry | F500 HQs | Revenue |
|---|---|---|
| Healthcare | 2 | $309B |
|
||
| Insurance | 2 | $27B |
|
||
| Telecommunications / Media | 1 | $124B |
|
||
| Industrial Distribution | 1 | $22B |
|
||
| Financial Services | 1 | $20B |
|
||
| Chemicals / Materials | 1 | $18B |
|
||
Price history
+387.0% since first listed3 events — show timeline
- 2026-06-08 Coming Soon $169,959 BRIGHT MLS
- 2001-09-30 Listing Removed — BRIGHT MLS
- 2000-12-07 Listed $34,900 BRIGHT MLS
Property tax history
+20.7%/yrLatest (2026): $2,289 · +143.3% YoY. Source: county tax records.
Cash-flow waterfall
monthlySold comps — $/sqft
last 12 mo · ≤1 miLoading sold comps…