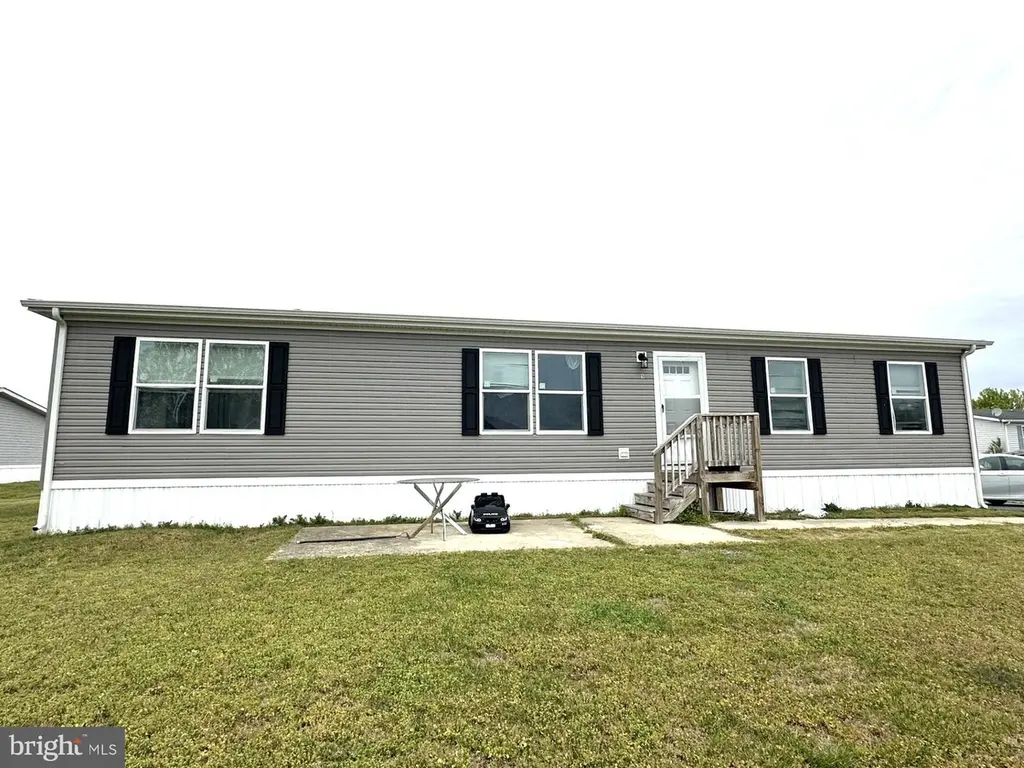
9 Estopel Ln · Magnolia, DE
Flood risk No data
- FEMA flood zone
- —
- Chance of flooding over 30 yrs
- —
- Est. flood insurance / yr
- —
Fire risk No data
- Est. fire insurance / yr
- —
Heat risk No data
- Hot days now (above threshold)
- —
- Hot days in 30 yrs
- —
Wind risk No data
- Chance of severe wind over 30 yrs
- —
Air-quality risk No data
- Unhealthy air days now
- —
- Unhealthy air days in 30 yrs
- —
Risk factors via First Street. Map © Google.
Why this score? — see what drove the B+ grade
The composite is a weighted blend of 9 inputs, each scored 0–100. Each bar is that input's sub-score; the figure is the points it added to the 100-point composite (weight × sub-score).
- Cash flow +30.0/30.0
- ARV discount +14.8/15.0
- 1% rule +10.0/10.0
- DSCR +10.0/10.0
- Schools +3.3/10.0
- Livability +3.2/5.0
- Rent growth +2.5/5.0
- Condition / age +2.5/5.0
- Appreciation +0.0/10.0
$99,999
🖨 Deal sheet (PDF) 📄 Offer letter ✓ Due diligence
Listing remarks
Nestled in the charming Barkers Landing community, this beautifully crafted 2023 manufactured home offers a perfect blend of modern comfort and neighborhood warmth. With three spacious bedrooms and two full bathrooms, this residence is designed for both relaxation and entertaining. Step into the heart of the home, where a well-appointed kitchen awaits, featuring essential appliances such as a built-in microwave, electric oven/range, dishwasher, and refrigerator (all appliances are AS IS). The convenience of a washer and dryer adds to the ease of daily living. Barkers Landing is not just a place to live; it's a vibrant community with access to local parks, perfect for leisurely strolls or we
Key facts
- Built 2023
- Listed 41 days
Property features AI
Finance
- Financial info: Tax information available (not included per instructions)
- HOA & community: Monthly land lease of $589; Approximately 30 years of land lease remaining
Exterior
- Parking: Driveway
- Utilities: Public water; Public sewer; Electric service
- Home design: Manufactured property (double wide); Land lease ownership
- Construction: Modular/Manufactured construction; Estimated year built
- Exterior features: Above-grade other structures
Interior
- Kitchen: Built-in microwave; Dishwasher; Electric oven/range; Refrigerator; Stainless steel appliances
- Bedrooms: 3 bedrooms on the main level
- Bathrooms: 2 full bathrooms on the main level; 2 full bathrooms total
- Heating & cooling: Central heating (electric); Central air conditioning; Ceiling fans
- Interior features: No basement; Estimated living area
- Laundry & utility: Washer and dryer included; Electric water heater
Neighborhood map
What this means for you Summary
Snapshot
- This is a 3-bed/2.0-bath manufactured listed at $100k.
Deal economics
- At list price, monthly cash flow is $746 ($9k/yr) — positive.
- The deal already cash-flows at list — no discount required.
- Meets the 1% rule at list price ($2k rent vs $100k).
- Recommended offer: $97k (3.0% below list) — sets the bar for market timing.
- Cap rate 15.2% vs local median 2.2% in Magnolia — top-decile yield for the area; either an underpriced asset or a hidden risk that comps aren't pricing in. Stress-test before assuming the spread holds.
Location & tenants
- Location reads 64/100 on livability (#51 in DE) — a middle-class / working-renter tenant base. Strengths: cost of living A+, employment A-, housing B+; Watch: schools F, crime F, amenities F.
- Caesar Rodney School District (suburban): math 26% / reading 49% proficiency, ranked #9 of 26 in DE (top 35%) — families likely to look elsewhere, expect single-tenant / working-renter base with shorter leases.
- Market conditions: 126 active listings in the ZIP; 1 comparable units currently listed for rent nearby; 1,201 units permitted in Kent County in 2024 (116 in 5+ unit buildings).
Forward outlook
- Local home prices are declining (-3.0%/yr); year-one equity from $691 of loan paydown is wiped out by about $3k of value loss. Plan a longer hold.
- Kent County population projected at +22% by 2050 — long-run rental-demand tailwind backs the buy-and-hold thesis.
- At projected returns (-3.0% appreciation + 3.0% rent growth), your $28k cash investment doubles in ~4 years — after that, you're playing with house money.
Negotiation context
- It's been on market 42 days — a 3% lower offer ($97k) is reasonable based on typical stale-listing flexibility.
Questions for the listing agent
- It's been on market 42 days. Have you received any prior offers? Is the seller open to a 3% concession, seller financing, or rate buy-down credit?
- Is there a deadline driving the sale (1031 exchange, divorce, estate, relocation)? That informs how much negotiation room exists.
- Schools are F-rated, which usually means shorter tenancies and higher turnover. Who's the typical renter profile here, and what's been the actual vacancy rate?
- Crime grade is F in this area — have there been break-ins, vandalism, or insurance claims at this property in the last 3 years? What carrier currently insures it and at what premium?
- What's the average days-on-market for RENTAL listings here right now (not sales)? A rising rental-DOM trend means longer vacancies and softer asking-rent achievability than the comps imply.
- What's the recent tenant-quality profile in this submarket — average credit score on applications, eviction rate, late-payment / NSF rate, and stable-employment percentage? A property-management company in the area should have these aggregated.
- How much new for-sale + rental construction is in the pipeline within 1–3 miles? Heavy new supply typically softens prices + rents 12–24 months out; constrained supply supports both.
Investment metrics
- 1% rule
- 1.70% ✓
- Cap rate
- 15.25%
- Cash-on-cash
- 31.98%
- DSCR
- 2.42
- GRM
- 4.9
CMA / ARV
- ARV (median comp)
- $119,218
- List price
- $99,999
- Delta
- -16.12%
- Verdict
- UNDERPRICED
- Comps
- 20 within 1.0 mi
Show comp detail 1 sale within ~0.75 mi
| Address | Dist | Beds/Ba | Sqft | Sold | Price | $/sf | Match |
|---|---|---|---|---|---|---|---|
| 335 Erica Ave #335 | 0.26mi | 3/2.0 | 1,344 (-14%) | 15mo | $70,000 | $52 | 52 |
Match score weights: distance 35% · size 25% · config 20% · recency 20%. Top-matched comps best support the ARV.
Projected returns pro-forma
-3.0% appreciation · 3.0% rent growth · sell at horizon
- IRR
- 26.9%
- Equity multiple
- 2.12×
- Total profit
- $31,285
- Equity at exit
- $14,910
- IRR
- 34.5%
- Equity multiple
- 4.15×
- Total profit
- $88,302
- Equity at exit
- $8,646
Cash invested: $28,000 (down + closing). Projections, not guarantees.
Landlord ↔ Tenant lean methodology
- Overall (STATE)
- 70 Landlord-Friendly
- State Delaware
- 70 Landlord-Friendly · D+7
- County
- — inherits STATE
- City
- — inherits STATE
ZIP-level market 19962
- Home prices YoY
- -29.4%
- Active inventory
- 126
- Price-to-rent
- 4.9×
Monthly cashflow live
- Estimated rent
- $1,699 medium interval (Pro) →
- Mortgage (P&I)
- −$524
- Tax from tax record
- −$30 /mo · $360/yr
- Insurance
- −$42
- HOA
- −$0
- Vacancy / Maint / Mgmt
- −$357
- Net cashflow
- $746
Break-even live
Sensitivity live
| Price | -10% $803 | -5% $774 | +0% $746 | +5% $718 | +10% $690 |
|---|---|---|---|---|---|
| Rent | -10% $612 | -5% $679 | +0% $746 | +5% $813 | +10% $880 |
| Rate | -1.0pp $796 | -0.5pp $772 | base $746 | +0.5pp $720 | +1.0pp $694 |
UW: 25.0% down · 7.5% · 30yr · 1.5% tax · 5.0% vac · 8.0% maint · 8.0% mgmt
Financing live
Cash to close
- Down payment
- $25,000
- Closing costs
- $3,000
- Reserves months
- —
- Total cash needed
- —
Loan-product check · same deal, 3 products live
Conventional
25% down · 7.5% · 30yr
- Down + closing
- —
- Monthly P&I
- —
- Monthly cashflow
- —
- DSCR
- —
- Eligible?
- —
Personal DTI + credit; lowest rate.
DSCR
20% down · 8.5% · 30yr
- Down + closing
- —
- Monthly P&I
- —
- Monthly cashflow
- —
- DSCR
- —
- Eligible?
- —
No personal income docs; deal must DSCR.
Hard money
10% down · 12.0% · 12mo
- Down + closing
- —
- Monthly P&I
- —
- Monthly cashflow
- —
- DSCR
- —
- Eligible?
- —
Short-term bridge; refi at stabilization.
Rent comps 1 comps
| Address | Beds | Baths | Sqft | Rent | $/sqft | DOM | Units | Dist |
|---|---|---|---|---|---|---|---|---|
| 2 Willow Dr Frederica, DE | 3.0–4.0 | 2.0 | 1312 | $1,699 | $1.29 | 45d | 1 | 0.42mi |
Listing history 18 events
-
2026-06-21days on market $99,999 Active 42 DOM
-
2026-06-19days on market $99,999 Active 40 DOM
-
2026-06-18days on market $99,999 Active 39 DOM
-
2026-06-17days on market $99,999 Active 38 DOM
-
2026-06-16days on market $99,999 Active 37 DOM
-
2026-06-15days on market $99,999 Active 36 DOM
-
2026-06-14days on market $99,999 Active 34 DOM
-
2026-06-13days on market $99,999 Active 33 DOM
-
2026-06-10days on market $99,999 Active 31 DOM
-
2026-06-09days on market $99,999 Active 30 DOM
-
2026-06-08days on market $99,999 Active 29 DOM
-
2026-06-07pricedays on market $99,999 Active 28 DOM
-
2026-06-02days on market $120,000 Active 23 DOM
-
2026-06-01days on market $120,000 Active 22 DOM
-
2026-05-31days on market $120,000 Active 21 DOM
-
2026-05-30days on market $120,000 Active 20 DOM
-
2026-05-11$120,000 Active 1136-char remark
-
2026-04-30historical $120,000 1136-char remark
ⓘ Source: listings_history table (triggers on properties + properties_extension) + one-shot
backfill from property_details.listing_events for pre-trigger history.
Tax reassessment forecast DE · Partial reset (capped growth)
- Current annual tax
- $360 · $30/mo
- Projected year-2 tax
- $470 · $39/mo
- Expected delta
- +$110/yr (+$9/mo · 30.6%)
ⓘ Screening estimate from a state-policy table — verify with the county assessor before closing.
Nearby sold comps map
Loading sold comps map…
Walkable amenities ~0.75 mi
Loading nearby amenities…
Taxation est. · year 1
- Rental income
- $20,388
- − Mortgage interest
- −$5,601
- − Property taxes
- −$360
- − Insurance
- −$500
- − Repairs & maintenance
- −$1,631
- − Management
- −$1,631
- − Depreciation
- −$2,909
- Taxable income
- $7,755
- Est. tax owed @ 24.0%
- −$1,861
- After-tax cash flow
- $7,092/yr
For passive investors: Depreciation is non-cash, so a rental often shows a tax loss while cash-flowing — sheltering income. Rental losses are passive: they offset passive income freely, and up to $25,000/yr can offset ordinary (W-2) income if you actively participate and your MAGI is under $100k (phasing out to $0 by $150k); unused losses carry forward. On sale, claimed depreciation is recaptured at up to 25%, and gains may owe capital-gains tax (a 1031 exchange can defer both). Figures are a year-1 estimate at your 24.0% rate — not tax advice; consult a CPA.
Schools (NCES district)
- District
- Caesar Rodney School District
- NCES district ID
- 1000180
- Math proficiency
- 26% ▼ -21.00%
- Reading proficiency
- 49% ▼ -14.00%
- Median HH income
- $61,187
- Composite
- 33.4/100
- National rank
- #5475
- State rank
- #9 of 26 in DE
Livability — Magnolia
- Score
- 64/100
- State rank
- #51
- US rank
- #13984
Category grades
Schools grade is shown separately in the Schools card above.
Census & demographics
- Population (ZIP)
- 12,618
Population outlook (Kent County) Hauer SSP2
- Today (2025)
- 194,477 people
- By 2030
- 204,351 · +5.1%
- By 2040
- 222,135 · +14.2%
- By 2050
- 236,483 · +21.6%
- By 2075
- 266,327 · +36.9%
- By 2100
- 275,335 · +41.6%
Race, ethnicity, and origin ACS 2023
- Neighborhood character
- Diverse neighborhood (Simpson 0.61)
- Race & ethnicity
- White 58% Black 23% Two or more races 10% Hispanic / Latino 6% Asian 4% Native American 2%
- Hispanic origin (detail)
- Mexican 1% Puerto Rican 3%
- Common ancestry
- Swiss 4% Italian 3% Iranian 2%
- Foreign-born
- 8% · Canada
- Languages at home
- 91% English-only · Spanish 4% Other Indo-European 2% Tagalog/Filipino 2%
Political lean MEDSL · Kent
- 2024 margin
- Toss-up / Even · D 50.2% · R 48.2% · Other 1.7%
- 2008→2024 swing
- -7.8pp toward R · 2008: 9.8pp · 2024: 2.0pp
- All cycles
- 2024: D+2.0 2020: D+4.1 2016: R+4.9 2012: D+4.9 2008: D+9.8
Not yet ingested
- Civics
- —
Market trends
- HPI YoY
- ▼ -77.63%
- Current HPI
- 186.7318
- Rent YoY
- —
- Metro
- —
- State GDP YoY
- —
- F500 in state
- 0
Price history
-16.7% since first listed3 events — show timeline
- 2026-06-05 Price Changed $99,999 BRIGHT MLS
- 2026-05-11 Listed $120,000 BRIGHT MLS
- 2026-04-30 Coming Soon $120,000 BRIGHT MLS
Property tax history
+2.6%/yrLatest (2025): $360 · -54.8% YoY. Source: county tax records.
Cash-flow waterfall
monthlySold comps — $/sqft
last 12 mo · ≤1 miLoading sold comps…