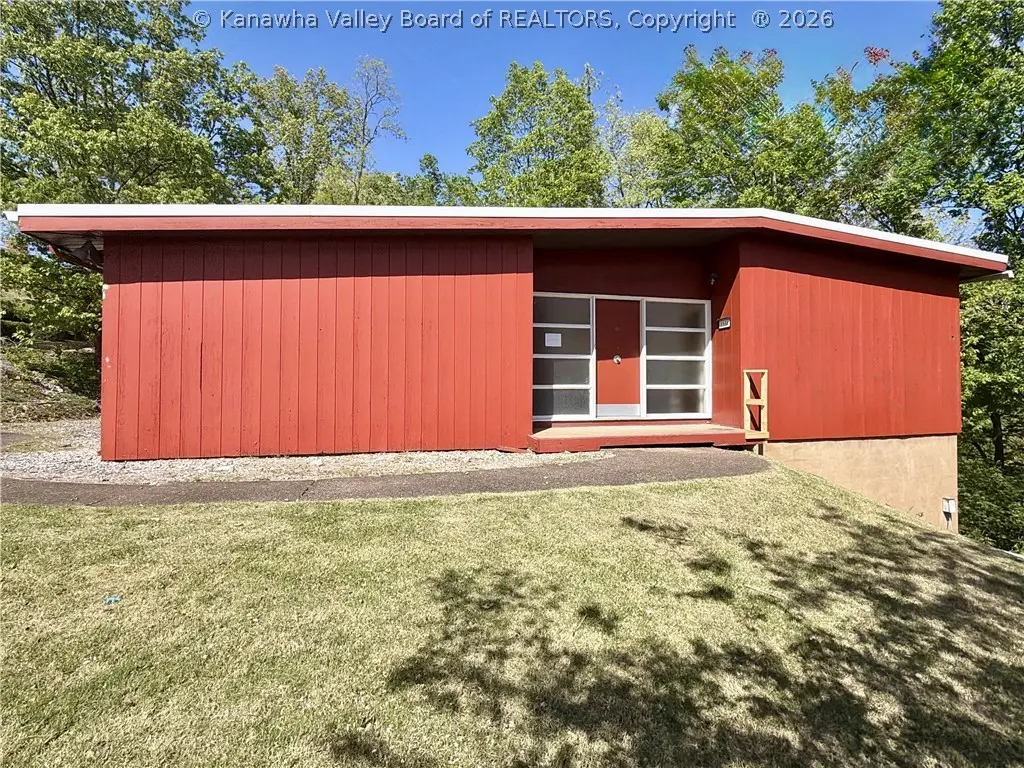
1534 Summit Dr · Charleston, WV
Flood risk 1/10 · Minimal
- FEMA flood zone
- X (unshaded)
- Chance of flooding over 30 yrs
- 0.0%
- Est. flood insurance / yr
- $473 – $860
Fire risk 5/10 · Moderate
- Est. fire insurance / yr
- $787 – $1,461
Heat risk 4/10 · Minor
- Hot days now (above 101°F)
- 6 days/yr
- Hot days in 30 yrs
- 15 days/yr
Wind risk 2/10 · Minimal
- Chance of severe wind over 30 yrs
- 1.0%
Air-quality risk 2/10 · Minimal
- Unhealthy air days now
- 0 days/yr
- Unhealthy air days in 30 yrs
- 1 days/yr
Risk factors via First Street. Map © Google.
Why this score? — see what drove the C- grade
The composite is a weighted blend of 9 inputs, each scored 0–100. Each bar is that input's sub-score; the figure is the points it added to the 100-point composite (weight × sub-score).
- Cash flow +15.1/30.0
- ARV discount +15.0/15.0
- DSCR +4.6/10.0
- Livability +4.2/5.0
- 1% rule +3.5/10.0
- Schools +2.9/10.0
- Rent growth +2.5/5.0
- Condition / age +2.5/5.0
- Appreciation +0.0/10.0
$160,000
🖨 Deal sheet (PDF) 📄 Offer letter ✓ Due diligence
Listing remarks MLS
MID-CENTURY MODERN MASTERPIECE ALMOST ENTIRELY INTACT. OPEN FLOOR PLAN WITH TONS OF GLASS OVERLOOKING THE WOODS. VAULTED WOOD CEILINGS 3 BEDROOMS 2 BATHS ON MAIN LEVEL WITH LARGE FAMILY ROOM WITH VINTAGE FIREPLACE IN BASEMENT WITH ADDITIONAL FULL BATH. ALL THE COOL DETAILS REALLY SET THIS HOUSE AND APART. A LITTLE RESTORATION MAKE THIS A SPECIAL PLACE TO CALL HOME.
Key facts
- 0.69 acre lot
- 2 garage spots
- Built 1956
Property features AI
Finance
- Financial info: Annual tax amount listed (details available in listing)
Exterior
- Parking: 2-car garage; Carport
- Utilities: Public water; Public sewer
- Home design: Single-family residence; Residential property; One story
- Construction: Brick, frame, and plaster construction
- Exterior features: Flat roof; Approximately 0.69-acre lot
Interior
- Kitchen: Eat-in kitchen
- Bedrooms: 6 total rooms (bedroom count not specified)
- Flooring: Carpet; Tile
- Bathrooms: 3 full bathrooms
- Heating & cooling: Forced air heating; Central electric air conditioning
- Interior features: Eat-in kitchen; Wood-framed windows; Full basement
Neighborhood map
What this means for you Summary
Snapshot
- This is a 3-bed/3.0-bath single-family listed at $160k.
Deal economics
- At list price, monthly cash flow is $52 ($620/yr) — positive.
- The deal already cash-flows at list — no discount required.
- To meet the 1% rule (rent ≥ 1% of price), the offer needs to be $135k (15.4% below list).
- Recommended offer: $135k (15.4% below list) — sets the bar for 1% rule.
- Cap rate 6.7% vs local median 3.8% in Charleston — top-decile yield for the area; either an underpriced asset or a hidden risk that comps aren't pricing in. Stress-test before assuming the spread holds.
Location & tenants
- Location reads 85/100 on livability (#3 in WV, #524 nationally) — a professional / high-income tenant draw. Strengths: amenities A+, commute A+, cost of living A+; Watch: crime F.
- Kanawha County Schools (suburban): math 29% / reading 40% proficiency, ranked #17 of 55 in WV (top 31%) — families likely to look elsewhere, expect single-tenant / working-renter base with shorter leases.
- Zoned schools: Edgewood Elementary (math 27% / reading 37%, grade F, #191 of 377 statewide, top 56%, 362 students, 0% FRL); West Side Middle School (math 7% / reading 18%, grade F, #109 of 109 statewide, top 100%, 377 students, 0% FRL); Capital High School (math 22% / reading 52%, grade F, #32 of 110 statewide, top 34%, 1,086 students, 0% FRL) — zoned schools average 0% FRL vs 46% district-wide (46 pts lower); this property's tenant base skews higher-income than the district average.
- Market conditions: 99 active listings in the ZIP; 103 units permitted in Kanawha County in 2024 (0 in 5+ unit buildings).
Forward outlook
- Local home prices are declining (-3.0%/yr); year-one equity from $1k of loan paydown is wiped out by about $5k of value loss. Plan a longer hold.
- Kanawha County population projected at -17% by 2050 — secular population decline; favor cash flow + early exit over multi-decade hold.
Negotiation context
- It's been on market 55 days — a 3% lower offer ($155k) is reasonable based on typical stale-listing flexibility.
- 2 sale attempts since 7y ago; this cycle's ask has dropped $12k (7%) from the opening price — seller is motivated, your offer sets the floor, not the list.
- Current owner paid $138k; 16% above their basis — modest negotiation headroom, anchor on the comps not their cost.
Risks & watch-outs
- Watch-outs: built in 1956 — expect roof / HVAC / electrical / plumbing capex.
- Climate carrying-cost: moderate wildfire risk — expect insurance premiums to compound above CPI over the hold.
Questions for the listing agent
- It's been on market 55 days. Have you received any prior offers? Is the seller open to a 15% concession, seller financing, or rate buy-down credit?
- Built in 1956 — when were the roof, HVAC, electrical panel, plumbing, and water heater last replaced?
- Is there a deadline driving the sale (1031 exchange, divorce, estate, relocation)? That informs how much negotiation room exists.
- Schools are A-rated — typically a magnet for longer-tenancy family renters. What's the average tenant stay here, and is there a school-zone premium baked into asking?
- Crime grade is F in this area — have there been break-ins, vandalism, or insurance claims at this property in the last 3 years? What carrier currently insures it and at what premium?
- What's the average days-on-market for RENTAL listings here right now (not sales)? A rising rental-DOM trend means longer vacancies and softer asking-rent achievability than the comps imply.
- What's the recent tenant-quality profile in this submarket — average credit score on applications, eviction rate, late-payment / NSF rate, and stable-employment percentage? A property-management company in the area should have these aggregated.
- How much new for-sale + rental construction is in the pipeline within 1–3 miles? Heavy new supply typically softens prices + rents 12–24 months out; constrained supply supports both.
Investment metrics
- 1% rule
- 0.85% ✗
- Cap rate
- 6.68%
- Cash-on-cash
- 1.38%
- DSCR
- 1.06
- GRM
- 9.9
CMA / ARV
- ARV (on-the-fly)
- $245,400
- Comps found
- 12
Show comp detail 12 sales within ~0.75 mi
| Address | Dist | Beds/Ba | Sqft | Sold | Price | $/sf | Match |
|---|---|---|---|---|---|---|---|
| 1555 Summit Dr | 0.17mi | 3/2.5 | 2,560 (+4%) | 0mo | $240,000 | $94 | 83 |
| 1529 Summit Dr | 0.03mi | 4/2.0 (+1) | 2,246 (-8%) | 0mo | $219,900 | $98 | 75 |
| 1235 Edgewood Dr | 0.39mi | 4/2.0 (+1) | 2,433 (-1%) | 15mo | $405,000 | $166 | 59 |
| 715 Bauer Ave | 0.54mi | 3/2.0 | 2,204 (-10%) | 1mo | $170,000 | $77 | 53 |
| 327 Hawthorne Dr | 0.59mi | 3/2.0 | 2,287 (-7%) | 6mo | $232,000 | $101 | 52 |
| 1229 Edgewood Dr | 0.42mi | 3/1.5 | 2,087 (-15%) | 1mo | $255,000 | $122 | 49 |
| 1724 Sugar Creek Dr | 0.64mi | 4/4.5 (+1) | 2,286 (-7%) | 2mo | $211,500 | $93 | 46 |
| 708 Amity Dr | 0.37mi | 3/2.5 | 2,793 (+14%) | 18mo | $232,000 | $83 | 43 |
| 736 Grace Ave | 0.64mi | 4/2.0 (+1) | 2,239 (-9%) | 13mo | $215,000 | $96 | 36 |
| 1001 Summit Dr | 0.73mi | 3/2.5 | 2,100 (-14%) | 8mo | $242,500 | $115 | 34 |
| 5 Forest Dr | 0.53mi | 3/3.0 | 2,780 (+13%) | 24mo | $277,000 | $100 | 34 |
| 1817 Davis Cir | 0.69mi | 4/2.0 (+1) | 2,800 (+14%) | 4mo | $355,000 | $127 | 32 |
Match score weights: distance 35% · size 25% · config 20% · recency 20%. Top-matched comps best support the ARV.
Projected returns pro-forma
-3.0% appreciation · 3.0% rent growth · sell at horizon
- IRR
- -14.1%
- Equity multiple
- 0.49×
- Total profit
- $-22,673
- Equity at exit
- $23,857
- IRR
- -5.4%
- Equity multiple
- 0.65×
- Total profit
- $-15,647
- Equity at exit
- $13,834
Cash invested: $44,800 (down + closing). Projections, not guarantees.
Landlord ↔ Tenant lean methodology
- Overall (STATE)
- 83 Strongly Landlord-Friendly
- State West Virginia
- 83 Strongly Landlord-Friendly · R+22
- County
- — inherits STATE
- City
- — inherits STATE
ZIP-level market 25302
- Home prices YoY
- -21.8%
- Active inventory
- 99
- Price-to-rent
- 9.9×
Monthly cashflow live
- Estimated rent
- $1,353 medium interval (Pro) →
- Mortgage (P&I)
- −$839
- Tax from tax record
- −$111 /mo · $1,337/yr
- Insurance
- −$67
- HOA
- −$0
- Vacancy / Maint / Mgmt
- −$284
- Net cashflow
- $52
Break-even live
Sensitivity live
| Price | -10% $142 | -5% $97 | +0% $52 | +5% $6 | +10% $-39 |
|---|---|---|---|---|---|
| Rent | -10% $-55 | -5% $-2 | +0% $52 | +5% $105 | +10% $159 |
| Rate | -1.0pp $132 | -0.5pp $92 | base $52 | +0.5pp $10 | +1.0pp $-32 |
UW: 25.0% down · 7.5% · 30yr · 1.5% tax · 5.0% vac · 8.0% maint · 8.0% mgmt
Financing live
Cash to close
- Down payment
- $40,000
- Closing costs
- $4,800
- Reserves months
- —
- Total cash needed
- —
Loan-product check · same deal, 3 products live
Conventional
25% down · 7.5% · 30yr
- Down + closing
- —
- Monthly P&I
- —
- Monthly cashflow
- —
- DSCR
- —
- Eligible?
- —
Personal DTI + credit; lowest rate.
DSCR
20% down · 8.5% · 30yr
- Down + closing
- —
- Monthly P&I
- —
- Monthly cashflow
- —
- DSCR
- —
- Eligible?
- —
No personal income docs; deal must DSCR.
Hard money
10% down · 12.0% · 12mo
- Down + closing
- —
- Monthly P&I
- —
- Monthly cashflow
- —
- DSCR
- —
- Eligible?
- —
Short-term bridge; refi at stabilization.
Listing history 22 events
-
2026-06-22days on market $160,000 Active 55 DOM
-
2026-06-21days on market $160,000 Active 54 DOM
-
2026-06-19days on market $160,000 Active 52 DOM
-
2026-06-18days on market $160,000 Active 51 DOM
-
2026-06-17pricedays on market $160,000 Active 50 DOM
-
2026-06-16days on market $172,000 Active 49 DOM
-
2026-06-15days on market $172,000 Active 48 DOM
-
2026-06-14days on market $172,000 Active 46 DOM
-
2026-06-12days on market $172,000 Active 45 DOM
-
2026-06-09days on market $172,000 Active 42 DOM
-
2026-06-08days on market $172,000 Active 41 DOM
-
2026-06-07days on market $172,000 Active 40 DOM
-
2026-06-05days on market $172,000 Active 37 DOM
-
2026-06-03days on market $172,000 Active 36 DOM
-
2026-06-02days on market $172,000 Active 35 DOM
-
2026-06-01days on market $172,000 Active 34 DOM
-
2026-05-31days on market $172,000 Active 33 DOM
-
2026-05-30days on market $172,000 Active 32 DOM
-
2026-04-28$172,000 Active
-
2019-07-25soldstatus $138,500
-
2019-07-19soldstatus $138,500 367-char remark
Show marketing remark (367 chars)
MID-CENTURY MODERN MASTERPIECE ALMOST ENTIRELY INTACT. OPEN FLOOR PLAN WITH TONS OF GLASS OVERLOOKING THE WOODS. VAULTED WOOD CEILINGS 3 BEDROOMS 2 BATHS ON MAIN LEVEL WITH LARGE FAMILY ROOM WITH VINTAGE FIREPLACE IN BASEMENT WITH ADDITIONAL FULL BATH. ALL THE COOL DETAILS REALLY SET THIS HOUSE AND APART. A LITTLE RESTORATION MAKE THIS A SPECIAL PLACE TO CALL HOME.
-
2019-04-17$128,500 367-char remark
Show marketing remark (367 chars)
MID-CENTURY MODERN MASTERPIECE ALMOST ENTIRELY INTACT. OPEN FLOOR PLAN WITH TONS OF GLASS OVERLOOKING THE WOODS. VAULTED WOOD CEILINGS 3 BEDROOMS 2 BATHS ON MAIN LEVEL WITH LARGE FAMILY ROOM WITH VINTAGE FIREPLACE IN BASEMENT WITH ADDITIONAL FULL BATH. ALL THE COOL DETAILS REALLY SET THIS HOUSE AND APART. A LITTLE RESTORATION MAKE THIS A SPECIAL PLACE TO CALL HOME.
ⓘ Source: listings_history table (triggers on properties + properties_extension) + one-shot
backfill from property_details.listing_events for pre-trigger history.
Tax reassessment forecast WV · Resets to sale price
- Current annual tax
- $1,337 · $111/mo
- Projected year-2 tax
- $1,337 · $111/mo
- Expected delta
- $0/yr ($0/mo · 0.0%)
ⓘ Screening estimate from a state-policy table — verify with the county assessor before closing.
Climate risk First Street
- Flood 1/10 Low FEMA zone X (unshaded) · 0% chance over 30 yrs
- Wildfire 5/10 Major
- Heat 4/10 Moderate 6 d/yr ≥101°F today · 15 d/yr by 30 yrs out
- Wind 2/10 Low 100% chance of damaging wind over 30 yrs
- Air quality 2/10 Low 0 unhealthy d/yr today · 1 by 30 yrs out
Nearby sold comps map
Loading sold comps map…
Walkable amenities ~0.75 mi
Loading nearby amenities…
Taxation est. · year 1
- Rental income
- $16,235
- − Mortgage interest
- −$8,962
- − Property taxes
- −$1,337
- − Insurance
- −$800
- − Repairs & maintenance
- −$1,299
- − Management
- −$1,299
- − Depreciation
- −$4,655
- Taxable loss
- −$2,117
- Est. tax savings @ 24.0%
- +$508
- After-tax cash flow
- $1,128/yr
For passive investors: Depreciation is non-cash, so a rental often shows a tax loss while cash-flowing — sheltering income. Rental losses are passive: they offset passive income freely, and up to $25,000/yr can offset ordinary (W-2) income if you actively participate and your MAGI is under $100k (phasing out to $0 by $150k); unused losses carry forward. On sale, claimed depreciation is recaptured at up to 25%, and gains may owe capital-gains tax (a 1031 exchange can defer both). Figures are a year-1 estimate at your 24.0% rate — not tax advice; consult a CPA.
Schools (NCES district)
- District
- Kanawha County Schools
- NCES district ID
- 5400600
- Math proficiency
- 29% ▼ -13.00%
- Reading proficiency
- 40% ▼ -7.00%
- Median HH income
- $44,329
- Composite
- 29.35/100
- National rank
- #6540
- State rank
- #17 of 55 in WV
Livability — Charleston
- Score
- 85/100
- State rank
- #3
- US rank
- #524
Category grades
Schools grade is shown separately in the Schools card above.
Census & demographics
- Census place
- Charleston, WV
- County
- Kanawha County · 33,502 people
- City population
- 33,502
- Metro
- Charleston, WV
- Population (ZIP)
- 13,204
- Household income
- $55,210
- Rent vs Own
- Severe rent burden
- 679.0
Population outlook (Kanawha County) Hauer SSP2
- Today (2025)
- 178,946 people
- By 2030
- 172,906 · -3.4%
- By 2040
- 159,874 · -10.7%
- By 2050
- 148,148 · -17.2%
- By 2075
- 123,257 · -31.1%
- By 2100
- 96,454 · -46.1%
Race, ethnicity, and origin ACS 2023
- Neighborhood character
- Predominantly White (75%)
- Race & ethnicity
- White 75% Black 14% Two or more races 8% Hispanic / Latino 3% Asian 1%
- Common ancestry
- Italian 2% Slovak 2% Iranian 1%
- Foreign-born
- 1% · South Korea
Political lean MEDSL · Kanawha
- 2024 margin
- R (+17.4) · D 40.2% · R 57.6% · Other 2.2%
- 2008→2024 swing
- -17.0pp toward R · 2008: -0.4pp · 2024: -17.4pp
- All cycles
- 2024: R+17.4 2020: R+14.7 2016: R+20.6 2012: R+11.9 2008: R+0.4
Not yet ingested
- Civics
- —
Market trends
- HPI YoY
- ▼ -44.83%
- Current HPI
- 160.7081
- Rent YoY
- —
- Metro
- Charleston, WV
- State GDP YoY
- —
- F500 in state
- 0
Price history
+33.9% since first listed4 events — show timeline
- 2026-04-28 Listed $172,000 KVBOR
- 2019-07-25 Sold (Public Records) $138,500 Public Records
- 2019-07-19 Sold (MLS) $138,500 KVBOR
- 2019-04-17 Listed $128,500 KVBOR
Property tax history
+7.7%/yrLatest (2025): $1,337 · +0.0% YoY. Source: county tax records.
Cash-flow waterfall
monthlySold comps — $/sqft
last 12 mo · ≤1 miLoading sold comps…