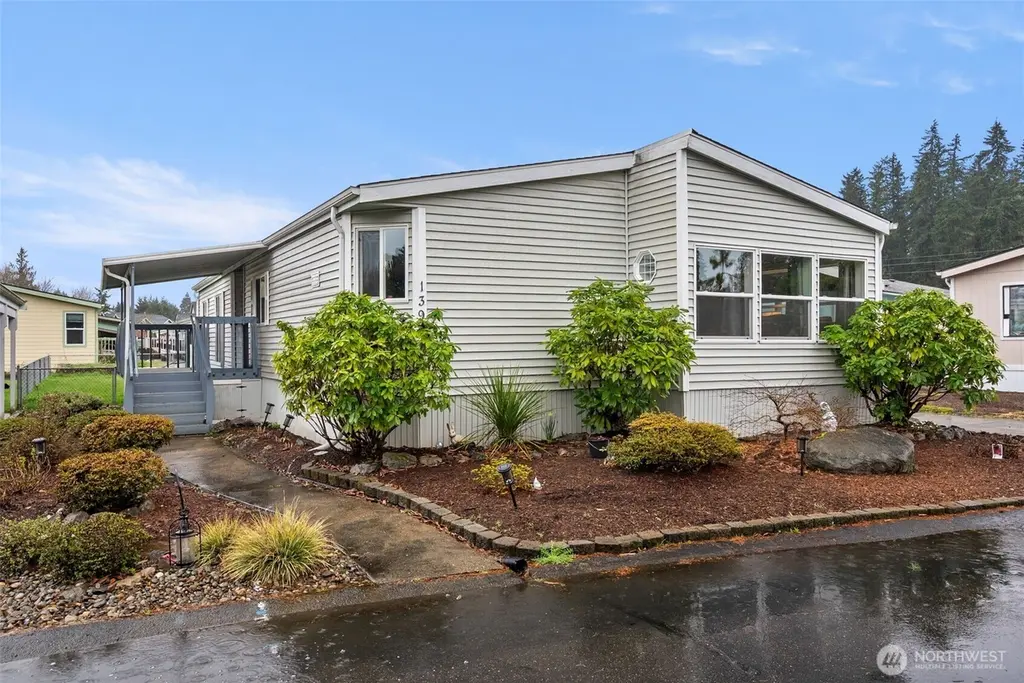
139 NE Saturn Ln · Tracyton, WA
Flood risk 1/10 · Minimal
- FEMA flood zone
- X (unshaded)
- Chance of flooding over 30 yrs
- 0.0%
- Est. flood insurance / yr
- $507 – $1,088
Fire risk 1/10 · Minimal
- Est. fire insurance / yr
- $604 – $1,122
Heat risk 3/10 · Minor
- Hot days now (above 86°F)
- 7 days/yr
- Hot days in 30 yrs
- 15 days/yr
Wind risk 1/10 · Minimal
- Chance of severe wind over 30 yrs
- —
Air-quality risk 7/10 · Major
- Unhealthy air days now
- 9 days/yr
- Unhealthy air days in 30 yrs
- 10 days/yr
Risk factors via First Street. Map © Google.
Why this score? — see what drove the B+ grade
The composite is a weighted blend of 9 inputs, each scored 0–100. Each bar is that input's sub-score; the figure is the points it added to the 100-point composite (weight × sub-score).
- Cash flow +30.0/30.0
- ARV discount +15.0/15.0
- 1% rule +10.0/10.0
- DSCR +10.0/10.0
- Schools +5.5/10.0
- Livability +3.7/5.0
- Condition / age +2.8/5.0
- Rent growth +2.6/5.0
- Appreciation +0.0/10.0
$129,950
🖨 Deal sheet 📄 Offer letter ✓ Due diligence
Listing remarks
Welcome to Silverdale Estates, a well-established 55+ gated community with the clubhouse just across from this 3 bed, 2 bath home. Thoughtful layout offers both a living room and separate family room, creating flexible space for everyday living or entertaining. Kitchen features an island, abundant cabinetry, and stainless steel appliances, with easy flow into the main living areas. Bedrooms offer comfortable proportions, including a primary suite with walk-in closet and private bath. Large deck extends your living space outdoors. Carport and spacious shed add convenience and storage. Community amenities include clubhouse, indoor pool, hot tub, sauna, and walking trails. Close to Silverdale
Key facts
- Gated community
- Large deck
- Clubhouse
Tags
Neighborhood map
What this means for you Summary
Snapshot
- This is a 3-bed/2.0-bath manufactured listed at $130k. Condition is rated average.
Deal economics
- At list price, monthly cash flow is $1k ($14k/yr) — positive.
- The deal already cash-flows at list — no discount required.
- Meets the 1% rule at list price ($3k rent vs $130k).
- Recommended offer: $122k (6.0% below list) — sets the bar for market timing.
- Cap rate 16.8% vs local median 3.7% in Tracyton — top-decile yield for the area; either an underpriced asset or a hidden risk that comps aren't pricing in. Stress-test before assuming the spread holds.
Location & tenants
- Location reads 73/100 on livability (#193 in WA) — a middle-class / working-renter tenant base. Strengths: employment A+, housing A+, health & safety A+; Watch: schools D+, cost of living D+, amenities F.
- Central Kitsap School District (urban): math 55% / reading 67% proficiency, ranked #49 of 291 in WA (top 17%) — acceptable for families but not a draw, mixed tenant base, ~2y average lease.
- Market conditions: Rents flat; 151 active listings in the ZIP; 11 comparable units currently listed for rent nearby; rentals leasing fast (median 14d on market — plan ~1-2 weeks tenant-placement turnaround); solid renter incomes; 1,294 units permitted in Kitsap County in 2024 (302 in 5+ unit buildings).
Forward outlook
- Local home prices are declining (-3.0%/yr); year-one equity from $898 of loan paydown is wiped out by about $4k of value loss. Plan a longer hold.
- Kitsap County population projected at +8% by 2050 — modest demand growth; plan on rents tracking national, not racing it.
- At projected returns (-3.0% appreciation + 0.3% rent growth), your $36k cash investment doubles in ~4 years — after that, you're playing with house money.
Negotiation context
- It's been on market 77 days — a 6% lower offer ($122k) is reasonable based on typical stale-listing flexibility.
Questions for the listing agent
- It's been on market 77 days. Have you received any prior offers? Is the seller open to a 6% concession, seller financing, or rate buy-down credit?
- Why hasn't it sold? Are there any deal-killer items the seller is aware of (foundation, flood, title, zoning, code violations)?
- Is there a deadline driving the sale (1031 exchange, divorce, estate, relocation)? That informs how much negotiation room exists.
- Schools are D-rated, which usually means shorter tenancies and higher turnover. Who's the typical renter profile here, and what's been the actual vacancy rate?
- What's the average days-on-market for RENTAL listings here right now (not sales)? A rising rental-DOM trend means longer vacancies and softer asking-rent achievability than the comps imply.
- What's the recent tenant-quality profile in this submarket — average credit score on applications, eviction rate, late-payment / NSF rate, and stable-employment percentage? A property-management company in the area should have these aggregated.
- How much new for-sale + rental construction is in the pipeline within 1–3 miles? Heavy new supply typically softens prices + rents 12–24 months out; constrained supply supports both.
Investment metrics
- 1% rule
- 1.98% ✓
- Cap rate
- 16.79%
- Cash-on-cash
- 37.47%
- DSCR
- 2.67
- GRM
- 4.2
CMA / ARV
- ARV (median comp)
- $198,500
- List price
- $129,950
- Delta
- -34.53%
- Verdict
- UNDERPRICED
- Comps
- 20 within 1.0 mi
Show comp detail 12 sales within ~0.75 mi
| Address | Dist | Beds/Ba | Sqft | Sold | Price | $/sf | Match |
|---|---|---|---|---|---|---|---|
| 6980 Taurus Ln NE | 0.26mi | 3/2.0 | 1,506 (-4%) | 1mo | $190,000 | $126 | 80 |
| 7075 Taurus Ln NE | 0.31mi | 3/2.0 | 1,596 (+1%) | 10mo | $185,000 | $116 | 75 |
| 621 NE Saturn Ln | 0.22mi | 3/2.0 | 1,456 (-8%) | 5mo | $167,500 | $115 | 73 |
| 111 NE Saturn Ln | 0.04mi | 3/2.0 | 1,372 (-13%) | 11mo | $165,000 | $120 | 68 |
| 970 NE Saturn Ln | 0.41mi | 3/2.0 | 1,680 (+7%) | 4mo | $180,000 | $107 | 66 |
| 6181 Holland Rd NW | 0.38mi | 2/2.0 (-1) | 1,620 (+3%) | 8mo | $360,000 | $222 | 66 |
| 404 NE Saturn Ln | 0.12mi | 3/2.0 | 1,344 (-15%) | 7mo | $65,000 | $48 | 64 |
| 900 NE Saturn Ln | 0.39mi | 3/2.0 | 1,402 (-11%) | 1mo | $142,500 | $102 | 63 |
| 535 NE Saturn Ln | 0.19mi | 3/2.0 | 1,782 (+13%) | 8mo | $213,000 | $120 | 63 |
| 6205 NE Central Valley Rd NE | 0.27mi | 3/2.0 | 1,377 (-13%) | 10mo | $430,000 | $312 | 58 |
| 940 Yoder Ln NE | 0.55mi | 2/2.0 (-1) | 1,344 (-15%) | 7mo | $309,000 | $230 | 39 |
| 5530 Central Valley Rd NE | 0.65mi | 3/2.0 | 1,792 (+14%) | 10mo | $435,000 | $243 | 38 |
Match score weights: distance 35% · size 25% · config 20% · recency 20%. Top-matched comps best support the ARV.
Projected returns pro-forma
-3.0% appreciation · 0.27% rent growth · sell at horizon
- IRR
- 30.3%
- Equity multiple
- 2.22×
- Total profit
- $44,463
- Equity at exit
- $19,376
- IRR
- 36.0%
- Equity multiple
- 3.89×
- Total profit
- $105,307
- Equity at exit
- $11,236
Cash invested: $36,386 (down + closing). Projections, not guarantees.
Landlord ↔ Tenant lean methodology
- Overall (STATE)
- 28 Tenant-Leaning
- State Washington
- 28 Tenant-Leaning · D+8
- County
- — inherits STATE
- City
- — inherits STATE
ZIP-level market 98311
- Rents YoY
- 0.3%
- Active inventory
- 151
- Price-to-rent
- 4.2×
Monthly cashflow live
- Estimated rent
- $2,575 high interval (Pro) →
- Mortgage (P&I)
- −$681
- Tax est. 1.5%
- −$162 /mo · $1,949/yr
- Insurance
- −$54
- HOA
- −$0
- Vacancy / Maint / Mgmt
- −$541
- Net cashflow
- $1,136
Break-even live
UW: 25.0% down · 7.5% · 30yr · 1.5% tax · 5.0% vac · 8.0% maint · 8.0% mgmt
Financing live
Cash to close
- Down payment
- $32,488
- Closing costs
- $3,898
- Reserves months
- —
- Total cash needed
- —
Loan-product check · same deal, 3 products live
Conventional
25% down · 7.5% · 30yr
- Down + closing
- —
- Monthly P&I
- —
- Monthly cashflow
- —
- DSCR
- —
- Eligible?
- —
Personal DTI + credit; lowest rate.
DSCR
20% down · 8.5% · 30yr
- Down + closing
- —
- Monthly P&I
- —
- Monthly cashflow
- —
- DSCR
- —
- Eligible?
- —
No personal income docs; deal must DSCR.
Hard money
10% down · 12.0% · 12mo
- Down + closing
- —
- Monthly P&I
- —
- Monthly cashflow
- —
- DSCR
- —
- Eligible?
- —
Short-term bridge; refi at stabilization.
Rent comps 11 comps
| Address | Beds | Baths | Sqft | Rent | $/sqft | DOM | Units | Dist |
|---|---|---|---|---|---|---|---|---|
| 100 NE Miramar Cir Bremerton, WA | 3.0 | 2.5 | 1446 | $2,500 | $1.73 | 21d | 1 | 0.35mi |
| 263 Weatherstone Ln NE Bremerton, WA | 1.0–3.0 | 1.0–2.0 | 884 | $2,199 | $2.49 | 13d | 4 | 0.76mi |
| 1231 NE McWilliams Rd Bremerton, WA | 1.0–3.0 | 1.0–2.0 | 961 | $2,600 | $2.71 | 13d | 26 | 0.78mi |
| 7720 Vineyards Ln NE Bremerton, WA | 1.0–3.0 | 1.0–2.0 | 840 | $2,325 | $2.77 | 13d | 11 | 0.80mi |
| 6101 Washington 303 Bremerton, WA | 1.0–3.0 | 1.0–2.0 | 1010 | $2,880 | $2.85 | 13d | 70 | 0.86mi |
| 1381 NE Fairgrounds Rd Bremerton, WA | 1.0–3.0 | 1.0–2.0 | 949 | $2,315 | $2.44 | 13d | 14 | 0.87mi |
| 1303 NE Jasmine Ln Bremerton, WA | 2.0 | 1.5 | 1152 | $2,600 | $2.26 | 43d | 1 | 0.94mi |
| 8078 Old Military Rd NE Bremerton, WA | 2.0 | 2.5 | 2064 | $3,000 | $1.45 | 43d | 1 | 1.06mi |
| 778 NE Mesa Ln Bremerton, WA | 1.0–3.0 | 1.0–2.0 | 877 | $2,150 | $2.45 | 13d | 3 | 1.26mi |
| 4257 Pronghorn Pl Bremerton, WA | 3.0 | 2.5 | 1680 | $2,950 | $1.76 | 13d | 1 | 1.44mi |
| 4245 Pronghorn Pl Bremerton, WA | 3.0 | 2.5 | 1680 | $2,850 | $1.70 | 43d | 1 | 1.46mi |
Listing history 17 events
-
2026-06-18days on market $129,950 Active 77 DOM
-
2026-06-17days on market $129,950 Active 76 DOM
-
2026-06-16days on market $129,950 Active 75 DOM
-
2026-06-15days on market $129,950 Active 74 DOM
-
2026-06-14days on market $129,950 Active 72 DOM
-
2026-06-13days on market $129,950 Active 71 DOM
-
2026-06-10days on market $129,950 Active 69 DOM
-
2026-06-09days on market $129,950 Active 68 DOM
-
2026-06-08days on market $129,950 Active 67 DOM
-
2026-06-07days on market $129,950 Active 66 DOM
-
2026-06-05days on market $129,950 Active 63 DOM
-
2026-06-02days on market $129,950 Active 61 DOM
-
2026-06-01days on market $129,950 Active 60 DOM
-
2026-05-31days on market $129,950 Active 59 DOM
-
2026-05-30days on market $129,950 Active 58 DOM
-
2026-05-18price $129,950
-
2026-04-02$140,000 Active
ⓘ Source: listings_history table (triggers on properties + properties_extension) + one-shot
backfill from property_details.listing_events for pre-trigger history.
Climate risk First Street
- Flood 1/10 Low FEMA zone X (unshaded) · 0% chance over 30 yrs
- Wildfire 1/10 Low
- Heat 3/10 Moderate 7 d/yr ≥86°F today · 15 d/yr by 30 yrs out
- Wind 1/10 Low
- Air quality 7/10 Severe 9 unhealthy d/yr today · 10 by 30 yrs out
Nearby sold comps map
Loading sold comps map…
Walkable amenities ~0.75 mi
Loading nearby amenities…
Taxation est. · year 1
- Rental income
- $30,900
- − Mortgage interest
- −$7,279
- − Property taxes
- −$1,949
- − Insurance
- −$650
- − Repairs & maintenance
- −$2,472
- − Management
- −$2,472
- − Depreciation
- −$3,780
- Taxable income
- $12,298
- Est. tax owed @ 24.0%
- −$2,951
- After-tax cash flow
- $10,683/yr
For passive investors: Depreciation is non-cash, so a rental often shows a tax loss while cash-flowing — sheltering income. Rental losses are passive: they offset passive income freely, and up to $25,000/yr can offset ordinary (W-2) income if you actively participate and your MAGI is under $100k (phasing out to $0 by $150k); unused losses carry forward. On sale, claimed depreciation is recaptured at up to 25%, and gains may owe capital-gains tax (a 1031 exchange can defer both). Figures are a year-1 estimate at your 24.0% rate — not tax advice; consult a CPA.
Condition & rehab AI · 12 photos
This manufactured home requires moderate renovations to update the kitchen and paint the interior walls, which would significantly increase its resale value.
Repairs flagged
- Moderate kitchen cabinets — dated and in need of replacement
- Moderate kitchen countertops — dated and in need of replacement
- Moderate kitchen appliances — dated and in need of replacement
- Minor bathroom fixtures — standard fixtures
Value-add opportunities
- Resale update kitchen cabinets, countertops, and appliances — modernizing the kitchen would significantly increase the home's appeal
- Resale paint interior walls — fresh paint would improve the home's curb appeal
- Resale replace carpeting — new flooring would enhance the home's overall appearance
Renovation cost estimate screening
| Repair item | Severity | Est. cost |
|---|---|---|
| kitchen cabinets · dated and in need of replacement | Moderate | $3,000–15,000 |
| kitchen countertops · dated and in need of replacement | Moderate | $3,000–15,000 |
| kitchen appliances · dated and in need of replacement | Moderate | $3,000–15,000 |
| bathroom fixtures · standard fixtures | Minor | $500–3,000 |
| Total estimated repair cost · 4 items | $9,500–48,000 |
Value-add ROI direction
- Resale update kitchen cabinets, countertops, and appliances — modernizing the kitchen would significantly increase the home's appeal ↑
- Resale paint interior walls — fresh paint would improve the home's curb appeal ↑
- Resale replace carpeting — new flooring would enhance the home's overall appearance ↑
ⓘ Cost ranges are severity-bucket heuristics (US national rule-of-thumb). Get contractor quotes + a written scope before underwriting a rehab budget.
Schools (NCES district)
- District
- Central Kitsap School District
- NCES district ID
- 5301080
- Math proficiency
- 55% ▲ 1.00%
- Reading proficiency
- 67% ▬ 0.00%
- Median HH income
- $64,825
- Composite
- 54.87/100
- National rank
- #2813
- State rank
- #49 of 291 in WA
Livability — Tracyton
- Score
- 73/100
- State rank
- #193
- US rank
- #5240
Category grades
Schools grade is shown separately in the Schools card above.
Census & demographics
- County
- Kitsap County · 243,099 people
- Metro
- Bremerton-Silverdale-Port Orchard, WA
- Population (ZIP)
- 28,168
- Household income
- $108,757
- Rent vs Own
- Severe rent burden
- 502.0
Population outlook (Kitsap County) Hauer SSP2
- Today (2025)
- 277,525 people
- By 2030
- 285,040 · +2.7%
- By 2040
- 294,957 · +6.3%
- By 2050
- 300,622 · +8.3%
- By 2075
- 315,580 · +13.7%
- By 2100
- 304,340 · +9.7%
Race, ethnicity, and origin ACS 2023
- Neighborhood character
- Predominantly White (67%)
- Race & ethnicity
- White 67% Two or more races 14% Hispanic / Latino 9% Asian 9% Black 3% Pacific Islander 2%
- Hispanic origin (detail)
- Mexican 6%
- Common ancestry
- Portuguese 4% Italian 4% Slovak 3%
- Foreign-born
- 9% · Canada, Vietnam, China
- Languages at home
- 89% English-only · Tagalog/Filipino 4% Spanish 3% Vietnamese 2%
Political lean MEDSL · Kitsap
- 2024 margin
- Strong D (+20.9) · D 58.8% · R 37.9% · Other 3.3%
- 2008→2024 swing
- +8.6pp toward D · 2008: 12.3pp · 2024: 20.9pp
- All cycles
- 2024: D+20.9 2020: D+18.1 2016: D+11.6 2012: D+11.1 2008: D+12.3
Not yet ingested
- Civics
- —
Market trends
- HPI YoY
- ▼ -378.18%
- Current HPI
- 356.6272
- Rent YoY
- ▲ 0.27%
- Metro
- Bremerton-Silverdale-Port Orchard, WA
- State GDP YoY
- ▲ 4.65%
- F500 in state
- 22
Industry mix (Fortune 500 HQ in WA)
| Industry | F500 HQs | Revenue |
|---|---|---|
| Retail | 2 | $269B |
|
||
| Technology / Retail | 1 | $638B |
|
||
| Technology | 1 | $245B |
|
||
| Telecommunications | 1 | $38B |
|
||
| Food / Beverage | 1 | $36B |
|
||
| Automotive / Trucks | 1 | $34B |
|
||
Price history
-7.2% since first listed2 events — show timeline
- 2026-05-18 Price Changed $129,950 NWMLS as Distributed by MLS Grid
- 2026-04-02 Listed $140,000 NWMLS as Distributed by MLS Grid
Cash-flow waterfall
monthlySold comps — $/sqft
last 12 mo · ≤1 miLoading sold comps…