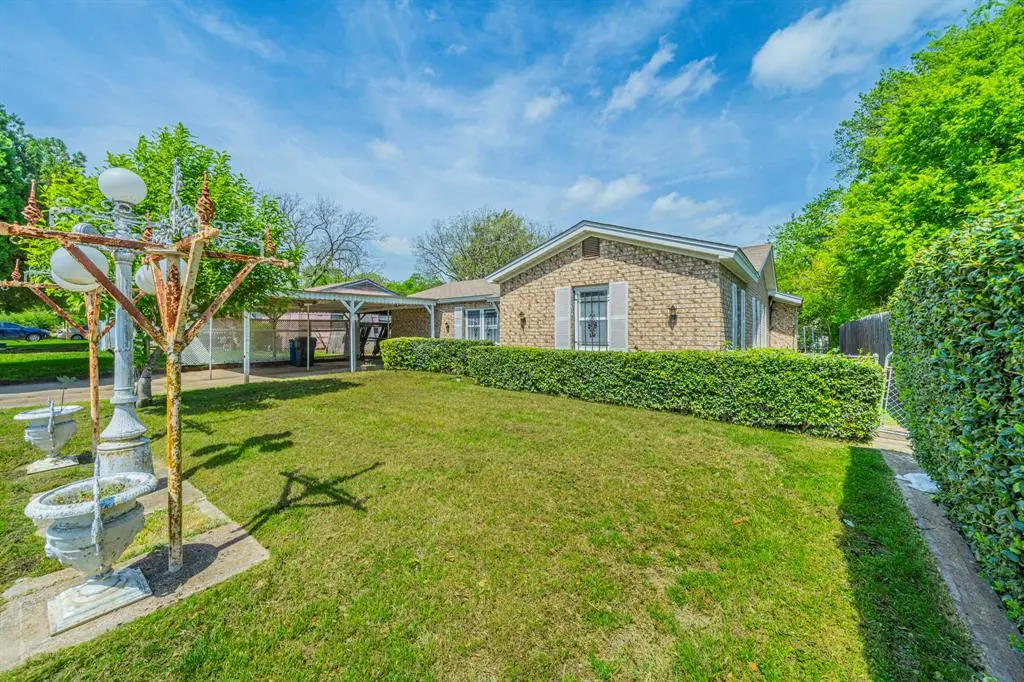
3903 Lovingood Dr · Dallas, TX
Flood risk 1/10 · Minimal
- FEMA flood zone
- X (unshaded)
- Chance of flooding over 30 yrs
- 0.0%
- Est. flood insurance / yr
- $507 – $1,088
Fire risk 3/10 · Minor
- Est. fire insurance / yr
- $1,222 – $2,270
Heat risk 7/10 · Major
- Hot days now (above 110°F)
- 7 days/yr
- Hot days in 30 yrs
- 24 days/yr
Wind risk 6/10 · Moderate
- Chance of severe wind over 30 yrs
- 27.0%
Air-quality risk 2/10 · Minimal
- Unhealthy air days now
- 1 days/yr
- Unhealthy air days in 30 yrs
- 2 days/yr
Risk factors via First Street. Map © Google.
Why this score? — see what drove the B+ grade
The composite is a weighted blend of 9 inputs, each scored 0–100. Each bar is that input's sub-score; the figure is the points it added to the 100-point composite (weight × sub-score).
- Cash flow +30.0/30.0
- ARV discount +15.0/15.0
- 1% rule +10.0/10.0
- DSCR +10.0/10.0
- Livability +4.0/5.0
- Schools +2.8/10.0
- Condition / age +2.5/5.0
- Rent growth +1.8/5.0
- Appreciation +0.0/10.0
$155,000
🖨 Deal sheet 📄 Offer letter ✓ Due diligence
Listing remarks MLS
Great investment property, sizeable home with a lot of space and potential. 4 bed 2 bathroom, Cash or hard money only, no assignments will be allowed, no wholesalers please, no option period offers will take priority
Key facts
- 7,536 sq ft lot
- 2 parking spots
- Built 1958
Neighborhood map
What this means for you Summary
Snapshot
- This is a 4-bed/2.0-bath single-family listed at $155k.
Deal economics
- At list price, monthly cash flow is $580 ($7k/yr) — positive.
- The deal already cash-flows at list — no discount required.
- Meets the 1% rule at list price ($2k rent vs $155k).
- Recommended offer: $150k (3.0% below list) — sets the bar for market timing.
- Cap rate 10.8% vs local median 2.3% in Dallas — top-decile yield for the area; either an underpriced asset or a hidden risk that comps aren't pricing in. Stress-test before assuming the spread holds.
Location & tenants
- Location reads 81/100 on livability (#24 in TX, #1,380 nationally) — a professional / high-income tenant draw. Strengths: amenities A+, commute A+, housing A+; Watch: schools C-, crime F.
- Dallas ISD (urban): math 31% / reading 36% proficiency, ranked #559 of 826 in TX (top 68%) — families likely to look elsewhere, expect single-tenant / working-renter base with shorter leases; 83% free/reduced lunch — lower-income household profile, screen leases tightly.
- Market conditions: Rents soft (-2.8%/yr); 207 active listings in the ZIP; 8 comparable units currently listed for rent nearby; rentals at typical pace (median 22d on market — plan ~3-4 weeks tenant-placement turnaround); 12,577 units permitted in Dallas County in 2024 (6,829 in 5+ unit buildings).
- At $2,497/mo this rent would consume 55% of the median local household income ($54k/yr) (locally 1076% of renters already pay >50% of income on rent) — very limited rent-growth headroom before tenants either downsize or default.
Forward outlook
- Local home prices are declining (-3.0%/yr); year-one equity from $1k of loan paydown is wiped out by about $5k of value loss. Plan a longer hold.
- Dallas County population projected at +35% by 2050 — long-run rental-demand tailwind backs the buy-and-hold thesis.
Negotiation context
- It's been on market 41 days — a 3% lower offer ($150k) is reasonable based on typical stale-listing flexibility.
- 2 sale attempts; this cycle's ask has dropped $24k (13%) from the opening price — seller is motivated, your offer sets the floor, not the list.
Risks & watch-outs
- Watch-outs: property tax is 4.0% of price; built in 1958 — expect roof / HVAC / electrical / plumbing capex.
- Climate carrying-cost: major wind risk, 27% chance of damaging wind over 30y; extreme-heat days projected 7→24/yr by 2055 (HVAC capex compounding) — expect insurance premiums to compound above CPI over the hold.
Questions for the listing agent
- It's been on market 41 days. Have you received any prior offers? Is the seller open to a 3% concession, seller financing, or rate buy-down credit?
- Built in 1958 — when were the roof, HVAC, electrical panel, plumbing, and water heater last replaced?
- Property tax is high relative to price — has the assessment been appealed recently, and will the sale trigger a re-assessment?
- Is there a deadline driving the sale (1031 exchange, divorce, estate, relocation)? That informs how much negotiation room exists.
- Crime grade is F in this area — have there been break-ins, vandalism, or insurance claims at this property in the last 3 years? What carrier currently insures it and at what premium?
- What's the average days-on-market for RENTAL listings here right now (not sales)? A rising rental-DOM trend means longer vacancies and softer asking-rent achievability than the comps imply.
- What's the recent tenant-quality profile in this submarket — average credit score on applications, eviction rate, late-payment / NSF rate, and stable-employment percentage? A property-management company in the area should have these aggregated.
- How much new for-sale + rental construction is in the pipeline within 1–3 miles? Heavy new supply typically softens prices + rents 12–24 months out; constrained supply supports both.
Investment metrics
- 1% rule
- 1.61% ✓
- Cap rate
- 10.79%
- Cash-on-cash
- 16.05%
- DSCR
- 1.71
- GRM
- 5.2
CMA / ARV
- ARV (median comp)
- $304,943
- List price
- $155,000
- Delta
- -49.17%
- Verdict
- UNDERPRICED
- Comps
- 20 within 1.0 mi
Show comp detail 12 sales within ~0.75 mi
| Address | Dist | Beds/Ba | Sqft | Sold | Price | $/sf | Match |
|---|---|---|---|---|---|---|---|
| 3903 Lovingood Dr | 0.00mi | 4/2.0 | 2,390 (0%) | 1mo | $155,000 | $65 | 100 |
| 3924 Ambrose Dr | 0.41mi | 5/3.0 (+1) | 2,294 (-4%) | 4mo | $305,000 | $133 | 62 |
| 6320 Emerald Tree Ln | 0.72mi | 5/2.5 (+1) | 2,505 (+5%) | 4mo | $374,900 | $150 | 48 |
| 4214 Lava Forest Dr | 0.68mi | 5/2.5 (+1) | 2,505 (+5%) | 8mo | $368,900 | $147 | 46 |
| 6343 Crosswood Ln | 0.72mi | 5/2.5 (+1) | 2,505 (+5%) | 9mo | $379,900 | $152 | 44 |
| 6302 Emerald Tree Ln | 0.74mi | 5/2.5 (+1) | 2,505 (+5%) | 10mo | $363,900 | $145 | 42 |
| 4245 Lava Forest Dr | 0.68mi | 4/2.5 | 2,054 (-14%) | 2mo | $355,900 | $173 | 42 |
| 6313 Crosswood Ln | 0.67mi | 4/2.5 | 2,054 (-14%) | 6mo | $351,900 | $171 | 38 |
| 6330 Crosswood Ln | 0.71mi | 4/2.5 | 2,054 (-14%) | 5mo | $359,900 | $175 | 38 |
| 4111 Lava Forest Dr | 0.68mi | 4/2.5 | 2,054 (-14%) | 6mo | $349,900 | $170 | 38 |
| 6305 Racer Summit Dr | 0.64mi | 4/2.5 | 2,054 (-14%) | 8mo | $354,900 | $173 | 38 |
| 6328 Racer Summit Dr | 0.70mi | 4/2.5 | 2,054 (-14%) | 10mo | $349,900 | $170 | 34 |
Match score weights: distance 35% · size 25% · config 20% · recency 20%. Top-matched comps best support the ARV.
Projected returns pro-forma
-3.0% appreciation · 0.0% rent growth · sell at horizon
- IRR
- 3.0%
- Equity multiple
- 1.11×
- Total profit
- $4,762
- Equity at exit
- $23,111
- IRR
- 8.8%
- Equity multiple
- 1.56×
- Total profit
- $24,415
- Equity at exit
- $13,402
Cash invested: $43,400 (down + closing). Projections, not guarantees.
Landlord ↔ Tenant lean methodology
- Overall (STATE)
- 87 Strongly Landlord-Friendly
- State Texas
- 87 Strongly Landlord-Friendly · R+5
- County
- — inherits STATE
- City
- — inherits STATE
ZIP-level market 75241
- Home prices YoY
- -16.9%
- Rents YoY
- -2.8%
- Active inventory
- 207
- Price-to-rent
- 5.2×
Monthly cashflow live
- Estimated rent
- $2,497 high interval (Pro) →
- Mortgage (P&I)
- −$813
- Tax from tax record
- −$515 /mo · $6,179/yr
- Insurance
- −$65
- HOA
- −$0
- Vacancy / Maint / Mgmt
- −$524
- Net cashflow
- $580
Break-even live
UW: 25.0% down · 7.5% · 30yr · 1.5% tax · 5.0% vac · 8.0% maint · 8.0% mgmt
Financing live
Cash to close
- Down payment
- $38,750
- Closing costs
- $4,650
- Reserves months
- —
- Total cash needed
- —
Loan-product check · same deal, 3 products live
Conventional
25% down · 7.5% · 30yr
- Down + closing
- —
- Monthly P&I
- —
- Monthly cashflow
- —
- DSCR
- —
- Eligible?
- —
Personal DTI + credit; lowest rate.
DSCR
20% down · 8.5% · 30yr
- Down + closing
- —
- Monthly P&I
- —
- Monthly cashflow
- —
- DSCR
- —
- Eligible?
- —
No personal income docs; deal must DSCR.
Hard money
10% down · 12.0% · 12mo
- Down + closing
- —
- Monthly P&I
- —
- Monthly cashflow
- —
- DSCR
- —
- Eligible?
- —
Short-term bridge; refi at stabilization.
Rent comps 8 comps
| Address | Beds | Baths | Sqft | Rent | $/sqft | DOM | Units | Dist |
|---|---|---|---|---|---|---|---|---|
| 4281 Lava Forest Dr Dallas, TX | 3.0–5.0 | 2.0–2.5 | 1840 | $2,300 | $1.25 | 1d | 1 | 0.71mi |
| 4136 Sweet Fennel Dr Dallas, TX | 5.0 | 2.5 | 2505 | $2,670 | $1.07 | 7d | 1 | 0.72mi |
| 2842 Pall Mall Ave Dallas, TX | 4.0 | 2.0 | 1584 | $2,095 | $1.32 | 24d | 1 | 0.95mi |
| 6152 Balcony Ln Dallas, TX | 4.0 | 2.5 | 1670 | $1,800 | $1.08 | 17d | 1 | 1.01mi |
| 2809 Gooch St Dallas, TX | 4.0 | 2.0 | 1816 | $2,650 | $1.46 | 7d | 1 | 1.02mi |
| 6213 Balcony Ln Dallas, TX | 5.0 | 3.0 | 2100 | $2,675 | $1.27 | 24d | 1 | 1.09mi |
| 6233 Balcony Ln Dallas, TX | 5.0 | 3.0 | 2080 | $2,695 | $1.30 | 22d | 1 | 1.12mi |
| 6233 Balcony Ln Dallas, TX | 3.0 | 2.0 | 2080 | $2,395 | $1.15 | 43d | 1 | 1.12mi |
Listing history 10 events
-
2026-05-14status Pending 216-char remark
Show marketing remark (216 chars)
Great investment property, sizeable home with a lot of space and potential. 4 bed 2 bathroom, Cash or hard money only, no assignments will be allowed, no wholesalers please, no option period offers will take priority
-
2026-04-24price $155,000 216-char remark
Show marketing remark (216 chars)
Great investment property, sizeable home with a lot of space and potential. 4 bed 2 bathroom, Cash or hard money only, no assignments will be allowed, no wholesalers please, no option period offers will take priority
-
2026-04-20price $159,000 216-char remark
Show marketing remark (216 chars)
Great investment property, sizeable home with a lot of space and potential. 4 bed 2 bathroom, Cash or hard money only, no assignments will be allowed, no wholesalers please, no option period offers will take priority
-
2026-04-14price $165,000 216-char remark
Show marketing remark (216 chars)
Great investment property, sizeable home with a lot of space and potential. 4 bed 2 bathroom, Cash or hard money only, no assignments will be allowed, no wholesalers please, no option period offers will take priority
-
2026-04-09price $175,000 216-char remark
Show marketing remark (216 chars)
Great investment property, sizeable home with a lot of space and potential. 4 bed 2 bathroom, Cash or hard money only, no assignments will be allowed, no wholesalers please, no option period offers will take priority
-
2026-04-03$179,000 Active 216-char remark
Show marketing remark (216 chars)
Great investment property, sizeable home with a lot of space and potential. 4 bed 2 bathroom, Cash or hard money only, no assignments will be allowed, no wholesalers please, no option period offers will take priority
-
2026-03-30price $179,000
-
2026-03-25price $189,000
-
2026-03-21$190,000 Active
-
2026-02-18soldstatus
ⓘ Source: listings_history table (triggers on properties + properties_extension) + one-shot
backfill from property_details.listing_events for pre-trigger history.
Tax reassessment forecast TX · Resets to sale price
- Current annual tax
- $6,179 · $515/mo
- Projected year-2 tax
- $6,179 · $515/mo
- Expected delta
- $0/yr ($0/mo · 0.0%)
ⓘ Screening estimate from a state-policy table — verify with the county assessor before closing.
Climate risk First Street
- Flood 1/10 Low FEMA zone X (unshaded) · 0% chance over 30 yrs
- Wildfire 3/10 Moderate
- Heat 7/10 Severe 7 d/yr ≥110°F today · 24 d/yr by 30 yrs out
- Wind 6/10 Major 27% chance of damaging wind over 30 yrs
- Air quality 2/10 Low 1 unhealthy d/yr today · 2 by 30 yrs out
Nearby sold comps map
Loading sold comps map…
Walkable amenities ~0.75 mi
Loading nearby amenities…
Taxation est. · year 1
- Rental income
- $29,965
- − Mortgage interest
- −$8,682
- − Property taxes
- −$6,179
- − Insurance
- −$775
- − Repairs & maintenance
- −$2,397
- − Management
- −$2,397
- − Depreciation
- −$4,509
- Taxable income
- $5,025
- Est. tax owed @ 24.0%
- −$1,206
- After-tax cash flow
- $5,758/yr
For passive investors: Depreciation is non-cash, so a rental often shows a tax loss while cash-flowing — sheltering income. Rental losses are passive: they offset passive income freely, and up to $25,000/yr can offset ordinary (W-2) income if you actively participate and your MAGI is under $100k (phasing out to $0 by $150k); unused losses carry forward. On sale, claimed depreciation is recaptured at up to 25%, and gains may owe capital-gains tax (a 1031 exchange can defer both). Figures are a year-1 estimate at your 24.0% rate — not tax advice; consult a CPA.
Schools (NCES district)
- District
- Dallas ISD
- NCES district ID
- 4816230
- Math proficiency
- 31% ▼ -16.00%
- Reading proficiency
- 36% ▼ -4.00%
- Median HH income
- $42,881
- Composite
- 28.41/100
- National rank
- #6763
- State rank
- #559 of 826 in TX
Livability — Dallas
- Score
- 81/100
- State rank
- #24
- US rank
- #1380
Category grades
Schools grade is shown separately in the Schools card above.
Census & demographics
- Census place
- Dallas, TX
- County
- Dallas County · 2,612,404 people
- City population
- 1,168,437
- Metro
- Dallas-Fort Worth-Arlington, TX
- Population (ZIP)
- 33,840
- Household income
- $53,998
- Rent vs Own
- Severe rent burden
- 1076.0
Population outlook (Dallas County) Hauer SSP2
- Today (2025)
- 2,979,839 people
- By 2030
- 3,191,823 · +7.1%
- By 2040
- 3,619,611 · +21.5%
- By 2050
- 4,026,915 · +35.1%
- By 2075
- 4,957,073 · +66.4%
- By 2100
- 5,508,725 · +84.9%
Race, ethnicity, and origin ACS 2023
- Neighborhood character
- Majority Black (62%)
- Race & ethnicity
- Black 62% Hispanic / Latino 30% Two or more races 8% White 5% Native American 2%
- Hispanic origin (detail)
- Mexican 24%
- Foreign-born
- 13% · Canada
- Languages at home
- 73% English-only · Spanish 25%
Political lean MEDSL · Dallas
- 2024 margin
- Strong D (+22.2) · D 60.2% · R 38.0% · Other 1.8%
- 2008→2024 swing
- +6.9pp toward D · 2008: 15.3pp · 2024: 22.2pp
- All cycles
- 2024: D+22.2 2020: D+31.6 2016: D+26.2 2012: D+15.4 2008: D+15.3
Not yet ingested
- Civics
- —
Market trends
- HPI YoY
- ▼ -72.36%
- Current HPI
- 356.2348
- Rent YoY
- ▼ -2.75%
- Metro
- Dallas-Fort Worth-Arlington, TX
- State GDP YoY
- ▲ 3.95%
- F500 in state
- 110
Industry mix (Fortune 500 HQ in TX)
| Industry | F500 HQs | Revenue |
|---|---|---|
| Energy | 16 | $1,198B |
|
||
| Technology | 5 | $198B |
|
||
| Engineering / Construction | 4 | $72B |
|
||
| Energy Services | 3 | $60B |
|
||
| Utilities | 3 | $41B |
|
||
| Healthcare | 2 | $330B |
|
||
Price history
-18.4% since first listed10 events — show timeline
- 2026-05-14 Pending — NTREIS
- 2026-04-24 Price Changed $155,000 NTREIS
- 2026-04-20 Price Changed $159,000 NTREIS
- 2026-04-14 Price Changed $165,000 NTREIS
- 2026-04-09 Price Changed $175,000 NTREIS
- 2026-04-03 Listed $179,000 NTREIS
- 2026-03-30 Price Changed $179,000 NTREIS
- 2026-03-25 Price Changed $189,000 NTREIS
- 2026-03-21 Listed $190,000 NTREIS
- 2026-02-18 Sold (Public Records) — Public Records
Property tax history
+10.9%/yrLatest (2025): $6,179 · -0.4% YoY. Source: county tax records.
Cash-flow waterfall
monthlySold comps — $/sqft
last 12 mo · ≤1 miLoading sold comps…