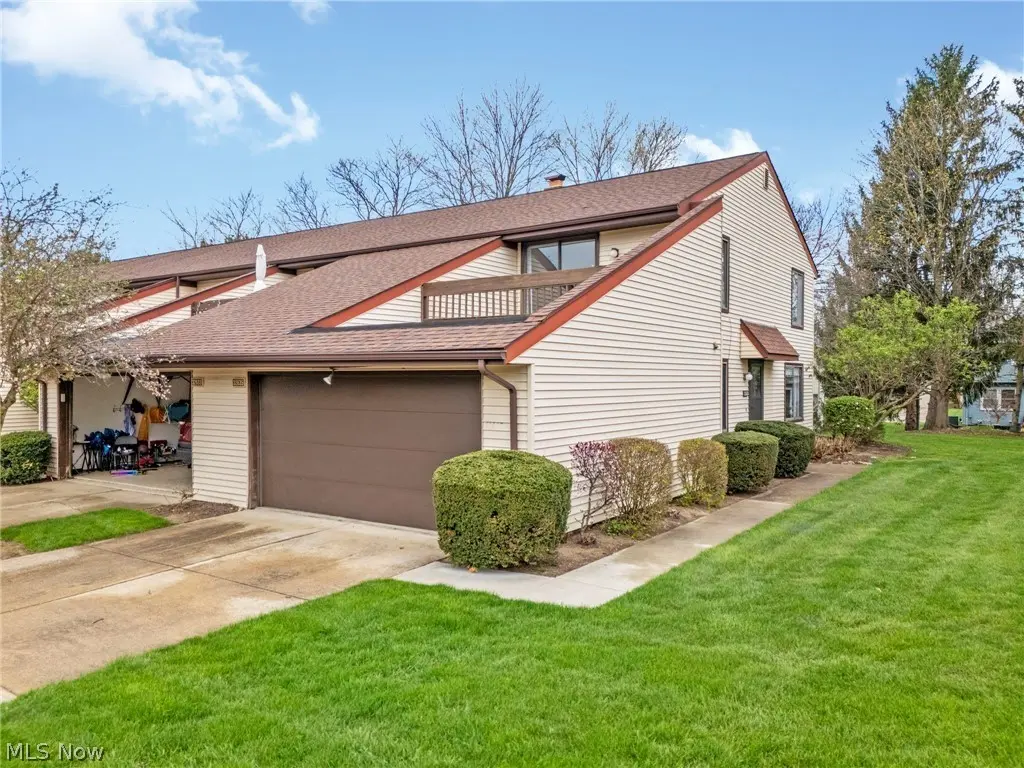
32635 Jefferson Dr #35 · Solon, OH
Flood risk No data
- FEMA flood zone
- —
- Chance of flooding over 30 yrs
- —
- Est. flood insurance / yr
- —
Fire risk No data
- Est. fire insurance / yr
- —
Heat risk No data
- Hot days now (above threshold)
- —
- Hot days in 30 yrs
- —
Wind risk No data
- Chance of severe wind over 30 yrs
- —
Air-quality risk No data
- Unhealthy air days now
- —
- Unhealthy air days in 30 yrs
- —
Risk factors via First Street. Map © Google.
Why this score? — see what drove the D grade
The composite is a weighted blend of 9 inputs, each scored 0–100. Each bar is that input's sub-score; the figure is the points it added to the 100-point composite (weight × sub-score).
- Cash flow +8.7/30.0
- Schools +8.1/10.0
- ARV discount +7.5/15.0
- Livability +4.5/5.0
- 1% rule +4.2/10.0
- Rent growth +2.5/5.0
- Condition / age +2.5/5.0
- DSCR +2.4/10.0
- Appreciation +0.0/10.0
$260,000
🖨 Deal sheet 📄 Offer letter ✓ Due diligence
Listing remarks
Welcome to this spacious, and well maintained condo in the Solon Liberty Hill community. With multiple living areas, a finished basement, and low maintenance living, this home provides the perfect blend of both comfort and flexibility! Step inside to a welcoming foyer that seamlessly connects the living and dining areas, creating a natural flow for everyday living. The dining space opens into the kitchen, making the layout both functional and inviting. The cozy living room features a fireplace and sliding glass doors that lead to the patio, ideal for relaxing or casual entertaining. A convenient half bath completes the main level. Upstairs, you’ll find three bedrooms, including a g
Key facts
- Second fireplace
- Own balcony
- Large rec room
Tags
Neighborhood map
What this means for you Summary
Snapshot
- This is a 3-bed/2.0-bath condo listed at $260k.
Deal economics
- At list price, monthly cash flow is $-220 ($-3k/yr) — negative.
- To cash-flow at today's rent, offer at most $221k (14.9% below list).
- To meet the 1% rule (rent ≥ 1% of price), the offer needs to be $238k (8.4% below list).
- Recommended offer: $221k (14.9% below list) — sets the bar for cash-flow.
- Cap rate 5.3% vs local median 2.3% in Solon — top-decile yield for the area; either an underpriced asset or a hidden risk that comps aren't pricing in. Stress-test before assuming the spread holds.
Location & tenants
- Location reads 91/100 on livability (#5 in OH, #42 nationally) — a professional / high-income tenant draw. Strengths: schools A+, crime A+, amenities A+.
- Solon City (suburban): math 89% / reading 93% proficiency, ranked #1 of 656 in OH (top 0%) — strong family-tenant draw, lease renewals of 3-5y typical; only 9% free/reduced lunch — higher-income household profile.
- Market conditions: 101 active listings in the ZIP; 5 comparable units currently listed for rent nearby; rentals leasing fast (median 3d on market — plan ~1-2 weeks tenant-placement turnaround); high-income renter base; 1,441 units permitted in Cuyahoga County in 2024 (700 in 5+ unit buildings).
Forward outlook
- Local home prices are declining (-3.0%/yr); year-one equity from $2k of loan paydown is wiped out by about $8k of value loss. Plan a longer hold.
- Cuyahoga County population projected to shrink 8% by 2050 — rents likely to lag national; underwrite the cash flow, not the appreciation.
Negotiation context
- Only 3 days on market — expect competitive offers; lowballing is unlikely to land.
- 3 sale attempts since 20y ago with the ask held roughly flat each time — persistent listings suggest the price (not the market) is what's stuck; bring a comps-based counter.
- Current owner paid $110k; list at $260k implies a 136% gain — meaningful room to come down on a strong offer.
Questions for the listing agent
- What do current leases actually rent for vs. the listed asking? Can we see a recent rent roll and the last 12 months of T-12 income?
- Built in 1978 — when were the roof, HVAC, electrical panel, plumbing, and water heater last replaced?
- What does the HOA fee cover, when was the last increase, and are there any pending special assessments or reserve-fund shortfalls?
- Any open or pending special assessments — roof, HVAC, plumbing, elevator, façade? What's the per-unit balance and payoff schedule, and is the seller paying it off at close or rolling it to the buyer?
- Is there a deadline driving the sale (1031 exchange, divorce, estate, relocation)? That informs how much negotiation room exists.
- Schools are A-rated — typically a magnet for longer-tenancy family renters. What's the average tenant stay here, and is there a school-zone premium baked into asking?
- The area grade is low — what's the realistic commute time and amenity access for the typical tenant pool here? Any planned neighborhood developments (good or bad) we should know about?
- What's the average days-on-market for RENTAL listings here right now (not sales)? A rising rental-DOM trend means longer vacancies and softer asking-rent achievability than the comps imply.
- What's the recent tenant-quality profile in this submarket — average credit score on applications, eviction rate, late-payment / NSF rate, and stable-employment percentage? A property-management company in the area should have these aggregated.
- How much new apartment / multifamily construction is in the pipeline within 1–3 miles? Heavy new supply (>2% of stock underway) typically softens rents 12–24 months out; light construction supports rent growth.
Investment metrics
- 1% rule
- 0.92% ✗
- Cap rate
- 5.28%
- Cash-on-cash
- -3.62%
- DSCR
- 0.84
- GRM
- 9.1
CMA / ARV
No comps found within radius.
Projected returns pro-forma
-3.0% appreciation · 3.0% rent growth · sell at horizon
- IRR
- -22.3%
- Equity multiple
- 0.23×
- Total profit
- $-55,903
- Equity at exit
- $38,767
- IRR
- -16.1%
- Equity multiple
- 0.10×
- Total profit
- $-65,795
- Equity at exit
- $22,480
Cash invested: $72,800 (down + closing). Projections, not guarantees.
Landlord ↔ Tenant lean methodology
- Overall (STATE)
- 73 Landlord-Friendly
- State Ohio
- 73 Landlord-Friendly · R+6
- County
- — inherits STATE
- City
- — inherits STATE
ZIP-level market 44139
- Active inventory
- 101
- Price-to-rent
- 9.1×
Monthly cashflow live
- Estimated rent
- $2,381 high interval (Pro) →
- Mortgage (P&I)
- −$1,363
- Tax from tax record
- −$305 /mo · $3,655/yr
- Insurance
- −$108
- HOA
- −$324
- Vacancy / Maint / Mgmt
- −$500
- Net cashflow
- $-220
Break-even live
UW: 25.0% down · 7.5% · 30yr · 1.5% tax · 5.0% vac · 8.0% maint · 8.0% mgmt
Financing live
Cash to close
- Down payment
- $65,000
- Closing costs
- $7,800
- Reserves months
- —
- Total cash needed
- —
Loan-product check · same deal, 3 products live
Conventional
25% down · 7.5% · 30yr
- Down + closing
- —
- Monthly P&I
- —
- Monthly cashflow
- —
- DSCR
- —
- Eligible?
- —
Personal DTI + credit; lowest rate.
DSCR
20% down · 8.5% · 30yr
- Down + closing
- —
- Monthly P&I
- —
- Monthly cashflow
- —
- DSCR
- —
- Eligible?
- —
No personal income docs; deal must DSCR.
Hard money
10% down · 12.0% · 12mo
- Down + closing
- —
- Monthly P&I
- —
- Monthly cashflow
- —
- DSCR
- —
- Eligible?
- —
Short-term bridge; refi at stabilization.
Rent comps 5 comps
| Address | Beds | Baths | Sqft | Rent | $/sqft | DOM | Units | Dist |
|---|---|---|---|---|---|---|---|---|
| 32450 Cromwell Dr Solon, OH | 1.0–2.0 | 1.0–2.0 | 970 | $1,675 | $1.73 | 1d | 23 | 0.12mi |
| 6569 Brookland Ave Solon, OH | 3.0 | 2.0 | 1832 | $2,450 | $1.34 | 3d | 1 | 1.25mi |
| 32740 Parkway Dr Solon, OH | 3.0 | 1.0 | 1064 | $2,280 | $2.14 | 23d | 1 | 1.39mi |
| 7101 Liberty Rd Solon, OH | 4.0 | 2.0 | 1344 | $2,200 | $1.64 | 12d | 1 | 1.40mi |
| 34500 Brookmeade Pl Solon, OH | 1.0–3.0 | 1.0–2.5 | 1378 | $3,640 | $2.64 | 1d | 13 | 1.45mi |
HOA detail condo
- Monthly dues
- $324 · $3,888/yr
- Assessments
- None detected in remarks — confirm with the listing agent.
Listing history 7 events
-
2026-04-19status Pending
-
2026-04-16$260,000 Active
-
2006-08-05historical
-
2006-08-03historical
-
2006-03-31$168,900
-
2006-02-03$178,900
-
1990-11-14soldstatus $110,000
ⓘ Source: listings_history table (triggers on properties + properties_extension) + one-shot
backfill from property_details.listing_events for pre-trigger history.
Tax reassessment forecast OH · Partial reset (capped growth)
- Current annual tax
- $3,655 · $305/mo
- Projected year-2 tax
- $3,856 · $321/mo
- Expected delta
- +$200/yr (+$17/mo · 5.5%)
ⓘ Screening estimate from a state-policy table — verify with the county assessor before closing.
Nearby sold comps map
Loading sold comps map…
Walkable amenities ~0.75 mi
Loading nearby amenities…
Taxation est. · year 1
- Rental income
- $28,567
- − Mortgage interest
- −$14,564
- − Property taxes
- −$3,655
- − Insurance
- −$1,300
- − Repairs & maintenance
- −$2,285
- − Management
- −$2,285
- − HOA
- −$3,888
- − Depreciation
- −$7,564
- Taxable loss
- −$6,974
- Est. tax savings @ 24.0%
- +$1,674
- After-tax cash flow
- $-963/yr
For passive investors: Depreciation is non-cash, so a rental often shows a tax loss while cash-flowing — sheltering income. Rental losses are passive: they offset passive income freely, and up to $25,000/yr can offset ordinary (W-2) income if you actively participate and your MAGI is under $100k (phasing out to $0 by $150k); unused losses carry forward. On sale, claimed depreciation is recaptured at up to 25%, and gains may owe capital-gains tax (a 1031 exchange can defer both). Figures are a year-1 estimate at your 24.0% rate — not tax advice; consult a CPA.
Schools (NCES district)
- District
- Solon City
- NCES district ID
- 3904660
- Math proficiency
- 89% ▼ -7.00%
- Reading proficiency
- 93% ▼ -1.00%
- Median HH income
- $95,909
- Composite
- 81.16/100
- National rank
- #42
- State rank
- #1 of 656 in OH
Livability — Solon
- Score
- 91/100
- State rank
- #5
- US rank
- #42
Category grades
Schools grade is shown separately in the Schools card above.
Census & demographics
- Census place
- Solon, OH
- County
- Cuyahoga County · 1,090,369 people
- City population
- 24,706
- Metro
- Cleveland-Elyria, OH
- Population (ZIP)
- 24,706
- Household income
- $138,425
- Rent vs Own
- Severe rent burden
- 368.0
Population outlook (Cuyahoga County) Hauer SSP2
- Today (2025)
- 1,244,621 people
- By 2030
- 1,230,093 · -1.2%
- By 2040
- 1,189,108 · -4.5%
- By 2050
- 1,145,706 · -7.9%
- By 2075
- 1,076,557 · -13.5%
- By 2100
- 978,987 · -21.3%
Race, ethnicity, and origin ACS 2023
- Neighborhood character
- Majority White (65%)
- Race & ethnicity
- White 65% Asian 14% Black 12% Two or more races 7% Hispanic / Latino 3%
- Common ancestry
- Romanian 6% Scotch-Irish 3% Italian 2%
- Foreign-born
- 18% · China, Canada, Vietnam
- Languages at home
- 77% English-only · Chinese 6% Russian/Polish/Slavic 5% Other Indo-European 4%
Political lean MEDSL · Cuyahoga
- 2024 margin
- Solid D (+31.5) · D 65.4% · R 33.9%
- 2008→2024 swing
- -7.4pp toward R · 2008: 38.9pp · 2024: 31.5pp
- All cycles
- 2024: D+31.5 2020: D+34.1 2016: D+35.0 2012: D+38.7 2008: D+38.9
Not yet ingested
- Civics
- —
Market trends
- HPI YoY
- ▼ -196.10%
- Current HPI
- 191.8418
- Rent YoY
- —
- Metro
- Cleveland-Elyria, OH
- State GDP YoY
- ▲ 1.98%
- F500 in state
- 48
Industry mix (Fortune 500 HQ in OH)
| Industry | F500 HQs | Revenue |
|---|---|---|
| Insurance | 3 | $145B |
|
||
| Industrial Machinery | 3 | $49B |
|
||
| Financial Services | 3 | $24B |
|
||
| Consumer Goods | 2 | $93B |
|
||
| Aerospace / Defense | 2 | $47B |
|
||
| Utilities | 2 | $33B |
|
||
Price history
+136.4% since first listed7 events — show timeline
- 2026-04-19 Pending — MLSNOW
- 2026-04-16 Listed $260,000 MLSNOW
- 2006-08-05 Listing Removed — MLSNOW
- 2006-08-03 Listing Removed — MLSNOW
- 2006-03-31 Listed $168,900 MLSNOW
- 2006-02-03 Listed $178,900 MLSNOW
- 1990-11-14 Sold (Public Records) $110,000 Public Records
Property tax history
+5.4%/yrLatest (2025): $3,655 · +0.0% YoY. Source: county tax records.
Cash-flow waterfall
monthlySold comps — $/sqft
last 12 mo · ≤1 miLoading sold comps…