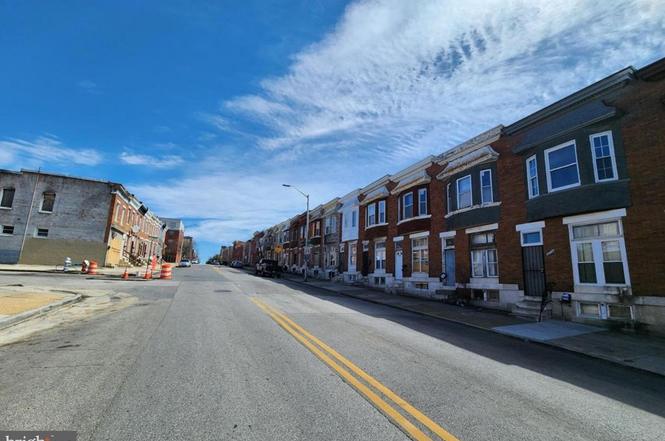
2517 W Baltimore St · Baltimore, MD
Flood risk 1/10 · Minimal
- FEMA flood zone
- X (unshaded)
- Chance of flooding over 30 yrs
- 0.0%
- Est. flood insurance / yr
- $473 – $860
Fire risk 1/10 · Minimal
- Est. fire insurance / yr
- $755 – $1,403
Heat risk 8/10 · Major
- Hot days now (above 103°F)
- 7 days/yr
- Hot days in 30 yrs
- 15 days/yr
Wind risk 6/10 · Moderate
- Chance of severe wind over 30 yrs
- 27.0%
Air-quality risk 3/10 · Minor
- Unhealthy air days now
- 3 days/yr
- Unhealthy air days in 30 yrs
- 4 days/yr
Risk factors via First Street. Map © Google.
Why this score? — see what drove the D grade
The composite is a weighted blend of 9 inputs, each scored 0–100. Each bar is that input's sub-score; the figure is the points it added to the 100-point composite (weight × sub-score).
- Cash flow +15.0/30.0
- ARV discount +7.5/15.0
- 1% rule +5.0/10.0
- DSCR +5.0/10.0
- Rent growth +4.4/5.0
- Livability +3.8/5.0
- Condition / age +2.5/5.0
- Schools +1.0/10.0
- Appreciation +0.0/10.0
$29,000
🖨 Deal sheet 📄 Offer letter ✓ Due diligence
Listing remarks
Big price improvement!!! Don't miss out on being a part of revitalizing Baltimore City! Come with vision and a good contractor, and get 2517 W Baltimore Street restored and beautiful again. Buyer responsible for all due diligence. Property being sold strictly AS IS. New homeowners can enjoy the nearby attractions such as Grace Medical Center, West Baltimore MARC Station, Westside Shopping Center, Carroll Park, & Carroll Park Golf Course. Easy Access to Major Traffic Artery Wilkens Ave. Message or call to obtain this brilliant real estate investment opportunity!
Key facts
- Carroll park
- Built 1900
- Listed 96 days
Tags
Neighborhood map
What this means for you Summary
Snapshot
- This is a 3-bed/1.0-bath townhouse listed at $29k.
Deal economics
- At list price, monthly cash flow is $1k ($14k/yr) — positive.
- The deal already cash-flows at list — no discount required.
- Meets the 1% rule at list price ($2k rent vs $29k).
- Recommended offer: $26k (9.0% below list) — sets the bar for market timing.
- Cap rate 53.1% vs local median 6.0% in Baltimore — top-decile yield for the area; either an underpriced asset or a hidden risk that comps aren't pricing in. Stress-test before assuming the spread holds.
Location & tenants
- Location reads 76/100 on livability (#90 in MD, #3,396 nationally) — a middle-class / working-renter tenant base. Strengths: amenities A+, commute A+, housing A+; Watch: schools D, crime F.
- Baltimore City Public Schools (urban): math 7% / reading 16% proficiency, ranked #24 of 24 in MD (top 100%) — low school quality limits family demand, transient renter base, plan for 1-2y turnover; 79% free/reduced lunch — lower-income household profile, screen leases tightly.
- Market conditions: Rents rising fast (+7.5%/yr); 422 active listings in the ZIP; 40 comparable units currently listed for rent nearby; rentals at typical pace (median 24d on market — plan ~3-4 weeks tenant-placement turnaround); 42% of comp listings sitting > 30 days — soft ceiling on asking rent; 1,273 units permitted in Baltimore city in 2024 (1,104 in 5+ unit buildings).
- This rent runs 45% of the median local income ($46k/yr) — at the standard rent-burdened threshold; future hikes will face affordability resistance.
Forward outlook
- Local home prices are declining (-3.0%/yr); year-one equity from $200 of loan paydown is wiped out by about $870 of value loss. Plan a longer hold.
- Baltimore County population projected to shrink 4% by 2050 — rents likely to lag national; underwrite the cash flow, not the appreciation.
- At projected returns (-3.0% appreciation + 7.5% rent growth), your $8k cash investment doubles in ~1 year — after that, you're playing with house money.
Negotiation context
- It's been on market 96 days — a 9% lower offer ($26k) is reasonable based on typical stale-listing flexibility.
Risks & watch-outs
- Watch-outs: built in 1900 — expect roof / HVAC / electrical / plumbing capex.
- Climate carrying-cost: major wind risk, 27% chance of damaging wind over 30y; extreme-heat days projected 7→15/yr by 2055 (HVAC capex compounding) — expect insurance premiums to compound above CPI over the hold.
Questions for the listing agent
- It's been on market 96 days. Have you received any prior offers? Is the seller open to a 9% concession, seller financing, or rate buy-down credit?
- Built in 1900 — when were the roof, HVAC, electrical panel, plumbing, and water heater last replaced?
- Why hasn't it sold? Are there any deal-killer items the seller is aware of (foundation, flood, title, zoning, code violations)?
- Is there a deadline driving the sale (1031 exchange, divorce, estate, relocation)? That informs how much negotiation room exists.
- Schools are D-rated, which usually means shorter tenancies and higher turnover. Who's the typical renter profile here, and what's been the actual vacancy rate?
- Crime grade is F in this area — have there been break-ins, vandalism, or insurance claims at this property in the last 3 years? What carrier currently insures it and at what premium?
- The area grade is low — what's the realistic commute time and amenity access for the typical tenant pool here? Any planned neighborhood developments (good or bad) we should know about?
- What's the average days-on-market for RENTAL listings here right now (not sales)? A rising rental-DOM trend means longer vacancies and softer asking-rent achievability than the comps imply.
- What's the recent tenant-quality profile in this submarket — average credit score on applications, eviction rate, late-payment / NSF rate, and stable-employment percentage? A property-management company in the area should have these aggregated.
- How much new for-sale + rental construction is in the pipeline within 1–3 miles? Heavy new supply typically softens prices + rents 12–24 months out; constrained supply supports both.
Investment metrics
- 1% rule
- 5.89% ✓
- Cap rate
- 53.08%
- Cash-on-cash
- 167.09%
- DSCR
- 8.43
- GRM
- 1.4
CMA / ARV
- ARV (on-the-fly)
- $83,460
- Comps found
- 12
Show comp detail 12 sales within ~0.75 mi
| Address | Dist | Beds/Ba | Sqft | Sold | Price | $/sf | Match |
|---|---|---|---|---|---|---|---|
| 43 Wheeler Ave N | 0.16mi | 3/1.0 | 1,144 (+7%) | 3mo | $34,000 | $30 | 78 |
| 2576 W Baltimore St W | 0.11mi | 3/2.0 | 1,200 (+12%) | 2mo | $152,000 | $127 | 69 |
| 2544 W Fairmount Ave | 0.09mi | 2/1.5 (-1) | 1,204 (+12%) | 2mo | $55,000 | $46 | 66 |
| 2402 Wilkens Ave | 0.55mi | 2/1.0 (-1) | 1,092 (+2%) | 0mo | $45,000 | $41 | 65 |
| 2408 Wilkens Ave | 0.55mi | 3/2.0 | 1,092 (+2%) | 2mo | $99,900 | $91 | 65 |
| 2141 Vine St | 0.33mi | 2/1.0 (-1) | 1,200 (+12%) | 3mo | $20,000 | $17 | 57 |
| 2008 Wilkens Ave | 0.61mi | 2/1.5 (-1) | 1,100 (+3%) | 4mo | $145,000 | $132 | 57 |
| 528 S Bentalou St | 0.52mi | 4/3.0 (+1) | 1,032 (-4%) | 0mo | $190,000 | $184 | 57 |
| 2130 Eagle St | 0.62mi | 4/2.0 (+1) | 1,000 (-6%) | 2mo | $78,110 | $78 | 49 |
| 1834 Wilkens Ave | 0.67mi | 3/1.0 | 1,200 (+12%) | 3mo | $36,000 | $30 | 46 |
| 537 Longwood St | 0.64mi | 4/2.0 (+1) | 1,176 (+10%) | 0mo | $60,000 | $51 | 44 |
| 1906 W Fairmount Ave | 0.50mi | 2/3.5 (-1) | 1,200 (+12%) | 3mo | $134,900 | $112 | 40 |
Match score weights: distance 35% · size 25% · config 20% · recency 20%. Top-matched comps best support the ARV.
Projected returns pro-forma
-3.0% appreciation · 7.51% rent growth · sell at horizon
- IRR
- —
- Equity multiple
- 10.29×
- Total profit
- $75,447
- Equity at exit
- $4,324
- IRR
- —
- Equity multiple
- 25.02×
- Total profit
- $195,046
- Equity at exit
- $2,507
Cash invested: $8,120 (down + closing). Projections, not guarantees.
Landlord ↔ Tenant lean methodology
- Overall (CITY)
- 12 Strongly Tenant-Friendly
- State Maryland
- 27 Tenant-Leaning · D+14
- County
- — inherits STATE
- City Baltimore
- 12 Strongly Tenant-Friendly · D+58
ZIP-level market 21223
- Rents YoY
- 7.5%
- Active inventory
- 422
- Price-to-rent
- 1.4×
Monthly cashflow live
- Estimated rent
- $1,707 high interval (Pro) →
- Mortgage (P&I)
- −$152
- Tax from tax record
- −$54 /mo · $642/yr
- Insurance
- −$12
- HOA
- −$0
- Vacancy / Maint / Mgmt
- −$358
- Net cashflow
- $1,131
Break-even live
UW: 25.0% down · 7.5% · 30yr · 1.5% tax · 5.0% vac · 8.0% maint · 8.0% mgmt
Financing live
Cash to close
- Down payment
- $7,250
- Closing costs
- $870
- Reserves months
- —
- Total cash needed
- —
Loan-product check · same deal, 3 products live
Conventional
25% down · 7.5% · 30yr
- Down + closing
- —
- Monthly P&I
- —
- Monthly cashflow
- —
- DSCR
- —
- Eligible?
- —
Personal DTI + credit; lowest rate.
DSCR
20% down · 8.5% · 30yr
- Down + closing
- —
- Monthly P&I
- —
- Monthly cashflow
- —
- DSCR
- —
- Eligible?
- —
No personal income docs; deal must DSCR.
Hard money
10% down · 12.0% · 12mo
- Down + closing
- —
- Monthly P&I
- —
- Monthly cashflow
- —
- DSCR
- —
- Eligible?
- —
Short-term bridge; refi at stabilization.
Rent comps 40 comps
| Address | Beds | Baths | Sqft | Rent | $/sqft | DOM | Units | Dist |
|---|---|---|---|---|---|---|---|---|
| 2516 Hollins St Baltimore, MD | 3.0 | 2.0 | 1100 | $1,700 | $1.55 | 44d | 1 | 0.08mi |
| 2537 Hollins St Baltimore, MD | 3.0 | 2.0 | 1200 | $1,450 | $1.21 | 24d | 1 | 0.10mi |
| 62 N Gorman Ave Baltimore, MD | 3.0 | 2.0 | 1100 | $2,500 | $2.27 | 18d | 1 | 0.18mi |
| 110 S Catherine St Unit 1 Baltimore, MD | 2.0 | 1.0 | 1330 | $1,500 | $1.13 | 44d | 1 | 0.20mi |
| 2232 W Baltimore St Baltimore, MD | 3.0 | 1.0 | 1250 | $1,875 | $1.50 | 24d | 1 | 0.25mi |
| 2225 W Baltimore St Baltimore, MD | 3.0 | 2.5 | 1200 | $1,600 | $1.33 | 24d | 1 | 0.26mi |
| 2540 Frederick Ave Baltimore, MD | 3.0 | 1.0 | 1075 | $1,400 | $1.30 | 24d | 1 | 0.35mi |
| 332 S Franklintown Rd Unit 2 Baltimore, MD | 2.0 | 1.0 | 776 | $795 | $1.02 | 24d | 1 | 0.35mi |
| 2609 Lauretta Ave Baltimore, MD | 3.0 | 1.0 | 1286 | $1,675 | $1.30 | 24d | 1 | 0.42mi |
| 307 S Smallwood St Baltimore, MD | 2.0 | 2.5 | 1400 | $1,350 | $0.96 | 44d | 1 | 0.43mi |
| 2815 W Mulberry St Baltimore, MD | 4.0 | 2.0 | 1040 | $2,050 | $1.97 | 44d | 1 | 0.44mi |
| 2636 Lauretta Ave Baltimore, MD | 3.0 | 2.5 | 1232 | $1,900 | $1.54 | 44d | 1 | 0.45mi |
| 2012 W Saratoga St Baltimore, MD | 3.0 | 1.0 | 1300 | $1,700 | $1.31 | 24d | 1 | 0.50mi |
| 1918 W Baltimore St Baltimore, MD | 2.0–3.0 | 1.0–2.0 | 857 | $1,434 | $1.67 | 44d | 1 | 0.51mi |
| 1912 W Baltimore St Unit 2 Baltimore, MD | 2.0 | 1.5 | 1200 | $2,100 | $1.75 | 24d | 1 | 0.51mi |
| 2657 Lehman St Unit 1 Baltimore, MD | 2.0 | 1.0 | 1056 | $1,000 | $0.95 | 44d | 1 | 0.55mi |
| 1839 W Fayette St Baltimore, MD | 3.0 | 1.5 | 1426 | $1,675 | $1.17 | 24d | 1 | 0.57mi |
| 2509 Christian St Baltimore, MD | 4.0 | 2.0 | 1248 | $1,699 | $1.36 | 3d | 1 | 0.57mi |
| 2514 Wilkens Ave Baltimore, MD | 4.0 | 1.0 | 1344 | $1,800 | $1.34 | 44d | 1 | 0.59mi |
| 2514 Wilkens Ave Baltimore, MD | 4.0 | 1.0 | 1344 | $1,800 | $1.34 | 11d | 1 | 0.59mi |
| 1846 W Saratoga St Unit 1 Baltimore, MD | 2.0 | 1.0 | 1250 | $1,300 | $1.04 | 44d | 1 | 0.62mi |
| 2671 Saint Benedict St Baltimore, MD | 2.0 | 1.0 | 1144 | $1,325 | $1.16 | 44d | 1 | 0.64mi |
| 2303 Calverton Heights Ave Baltimore, MD | 4.0 | 2.0 | 1314 | $2,250 | $1.71 | 24d | 1 | 0.68mi |
| 514 S Payson St Unit 2 Baltimore, MD | 3.0 | 2.0 | 1264 | $1,750 | $1.38 | 44d | 1 | 0.69mi |
| 2738 Wilkens Ave Baltimore, MD | 3.0 | 1.0 | 1183 | $1,500 | $1.27 | 44d | 1 | 0.71mi |
| 1635 Frederick Ave Baltimore, MD | 3.0 | 2.0 | 1224 | $1,850 | $1.51 | 44d | 1 | 0.72mi |
| 2737 Wilkens Ave Baltimore, MD | 3.0 | 1.5 | 1232 | $1,650 | $1.34 | 4d | 1 | 0.74mi |
| 1601 Frederick Ave Unit 3 Baltimore, MD | 2.0 | 1.0 | 1050 | $1,050 | $1.00 | 4d | 1 | 0.77mi |
| 918 N Bentalou St Baltimore, MD | 3.0 | 1.5 | 1485 | $1,750 | $1.18 | 44d | 1 | 0.78mi |
| 3015 Rayner Ave Baltimore, MD | 3.0 | 1.0 | 1152 | $1,350 | $1.17 | 44d | 1 | 0.80mi |
| 1519 Penrose Ave Baltimore, MD | 3.0 | 2.0 | 1200 | $1,875 | $1.56 | 44d | 1 | 0.85mi |
| 2744 W Mosher St Baltimore, MD | 4.0 | 2.0 | 1412 | $2,100 | $1.49 | 24d | 1 | 0.86mi |
| 3310 Elbert St Baltimore, MD | 2.0 | 1.0 | 920 | $1,550 | $1.68 | 24d | 1 | 0.87mi |
| 1625 Edmondson Ave Unit 2 Baltimore, MD | 4.0 | 3.0 | 1500 | $1,895 | $1.26 | 12d | 1 | 0.87mi |
| 1625 Edmondson Ave Unit 1 Baltimore, MD | 4.0 | 3.0 | 1500 | $2,175 | $1.45 | 4d | 1 | 0.87mi |
| 3130 Stafford St Baltimore, MD | 3.0 | 1.0 | 1200 | $1,500 | $1.25 | 20d | 1 | 0.87mi |
| 3336 W Caton Ave Baltimore, MD | 3.0 | 2.0 | 1236 | $1,625 | $1.31 | 24d | 1 | 0.88mi |
| 2301 Riggs Ave Baltimore, MD | 3.0 | 2.0 | 1072 | $1,600 | $1.49 | 24d | 1 | 0.88mi |
| 41 N Kossuth St Baltimore, MD | 3.0 | 2.0 | 1216 | $1,800 | $1.48 | 24d | 1 | 0.89mi |
| 813 N Fulton Ave Unit 1 Baltimore, MD | 2.0 | 1.0 | 1200 | $1,350 | $1.12 | 44d | 1 | 0.93mi |
Listing history 4 events
-
2025-12-31status Pending
-
2025-11-18price $29,000
-
2025-10-13price $31,500
-
2025-09-26$38,500 Active
ⓘ Source: listings_history table (triggers on properties + properties_extension) + one-shot
backfill from property_details.listing_events for pre-trigger history.
Tax reassessment forecast MD · Partial reset (capped growth)
- Current annual tax
- $642 · $54/mo
- Projected year-2 tax
- $642 · $54/mo
- Expected delta
- $0/yr ($0/mo · 0.0%)
ⓘ Screening estimate from a state-policy table — verify with the county assessor before closing.
Climate risk First Street
- Flood 1/10 Low FEMA zone X (unshaded) · 0% chance over 30 yrs
- Wildfire 1/10 Low
- Heat 8/10 Severe 7 d/yr ≥103°F today · 15 d/yr by 30 yrs out
- Wind 6/10 Major 27% chance of damaging wind over 30 yrs
- Air quality 3/10 Moderate 3 unhealthy d/yr today · 4 by 30 yrs out
Nearby sold comps map
Loading sold comps map…
Walkable amenities ~0.75 mi
Loading nearby amenities…
Taxation est. · year 1
- Rental income
- $20,481
- − Mortgage interest
- −$1,624
- − Property taxes
- −$642
- − Insurance
- −$145
- − Repairs & maintenance
- −$1,638
- − Management
- −$1,638
- − Depreciation
- −$844
- Taxable income
- $13,949
- Est. tax owed @ 24.0%
- −$3,348
- After-tax cash flow
- $10,220/yr
For passive investors: Depreciation is non-cash, so a rental often shows a tax loss while cash-flowing — sheltering income. Rental losses are passive: they offset passive income freely, and up to $25,000/yr can offset ordinary (W-2) income if you actively participate and your MAGI is under $100k (phasing out to $0 by $150k); unused losses carry forward. On sale, claimed depreciation is recaptured at up to 25%, and gains may owe capital-gains tax (a 1031 exchange can defer both). Figures are a year-1 estimate at your 24.0% rate — not tax advice; consult a CPA.
Schools (NCES district)
- District
- Baltimore City Public Schools
- NCES district ID
- 2400090
- Math proficiency
- 7% ▼ -9.00%
- Reading proficiency
- 16% ▼ -5.00%
- Median HH income
- $42,108
- Composite
- 10.08/100
- National rank
- #9805
- State rank
- #24 of 24 in MD
Livability — Baltimore
- Score
- 76/100
- State rank
- #90
- US rank
- #3396
Category grades
Schools grade is shown separately in the Schools card above.
Census & demographics
- Census place
- Baltimore, MD
- County
- Baltimore City · 558,601 people
- City population
- 588,727
- Metro
- Baltimore-Columbia-Towson, MD
- Population (ZIP)
- 19,572
- Household income
- $45,840
- Rent vs Own
- Severe rent burden
- 1755.0
Population outlook (Baltimore County) Hauer SSP2
- Today (2025)
- 624,249 people
- By 2030
- 621,541 · -0.4%
- By 2040
- 609,756 · -2.3%
- By 2050
- 597,249 · -4.3%
- By 2075
- 552,236 · -11.5%
- By 2100
- 513,934 · -17.7%
Race, ethnicity, and origin ACS 2023
- Neighborhood character
- Predominantly Black (72%)
- Race & ethnicity
- Black 72% White 16% Hispanic / Latino 7% Two or more races 6% Asian 1%
- Hispanic origin (detail)
- Mexican 3% Puerto Rican 1%
- Common ancestry
- Romanian 1%
- Foreign-born
- 8% · Canada
- Languages at home
- 90% English-only · Spanish 6% French/Haitian/Cajun 2% Other Indo-European 1%
Political lean MEDSL · Baltimore
- 2024 margin
- Solid D (+73.0) · D 85.2% · R 12.2% · Other 2.6%
- 2008→2024 swing
- -2.5pp toward R · 2008: 75.5pp · 2024: 73.0pp
- All cycles
- 2024: D+73.0 2020: D+76.6 2016: D+74.6 2012: D+76.4 2008: D+75.5
Not yet ingested
- Civics
- —
Market trends
- HPI YoY
- ▼ -97.99%
- Current HPI
- 140.5836
- Rent YoY
- ▲ 7.51%
- Metro
- Baltimore-Columbia-Towson, MD
- State GDP YoY
- ▲ 2.97%
- F500 in state
- 12
Industry mix (Fortune 500 HQ in MD)
| Industry | F500 HQs | Revenue |
|---|---|---|
| Aerospace / Defense | 1 | $71B |
|
||
| Utilities | 1 | $25B |
|
||
| Hotels | 1 | $24B |
|
||
| Consumer Goods | 1 | $7B |
|
||
| Real Estate | 1 | $6B |
|
||
| Chemicals | 1 | $2B |
|
||
Price history
-24.7% since first listed4 events — show timeline
- 2025-12-31 Pending — BRIGHT MLS
- 2025-11-18 Price Changed $29,000 BRIGHT MLS
- 2025-10-13 Price Changed $31,500 BRIGHT MLS
- 2025-09-26 Listed $38,500 BRIGHT MLS
Property tax history
+4.0%/yrLatest (2025): $642 · +6.5% YoY. Source: county tax records.
Cash-flow waterfall
monthlySold comps — $/sqft
last 12 mo · ≤1 miLoading sold comps…