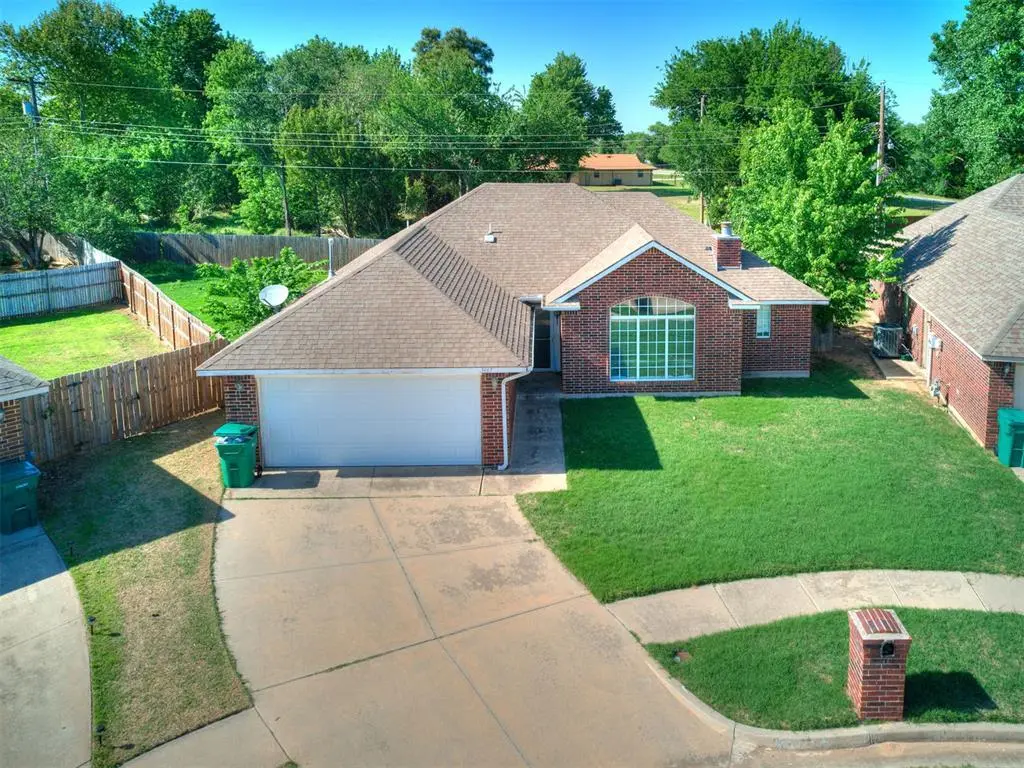
3447 Cobblestone Ct · Spencer, OK
Flood risk 1/10 · Minimal
- FEMA flood zone
- X (unshaded)
- Chance of flooding over 30 yrs
- 0.0%
- Est. flood insurance / yr
- $507 – $1,088
Fire risk 4/10 · Minor
- Est. fire insurance / yr
- $2,463 – $4,575
Heat risk 6/10 · Moderate
- Hot days now (above 107°F)
- 7 days/yr
- Hot days in 30 yrs
- 19 days/yr
Wind risk 3/10 · Minor
- Chance of severe wind over 30 yrs
- 4.0%
Air-quality risk 2/10 · Minimal
- Unhealthy air days now
- 1 days/yr
- Unhealthy air days in 30 yrs
- 2 days/yr
Risk factors via First Street. Map © Google.
Why this score? — see what drove the C grade
The composite is a weighted blend of 9 inputs, each scored 0–100. Each bar is that input's sub-score; the figure is the points it added to the 100-point composite (weight × sub-score).
- Cash flow +18.7/30.0
- Appreciation +10.0/10.0
- ARV discount +9.6/15.0
- DSCR +5.9/10.0
- 1% rule +4.3/10.0
- Livability +2.7/5.0
- Rent growth +2.5/5.0
- Condition / age +2.5/5.0
- Schools +0.7/10.0
$165,000
🖨 Deal sheet 📄 Offer letter ✓ Due diligence
Listing remarks MLS
One of many new homes being built in the area. This one already has a buyer, but we can build the same one for you, give us a call to pick your lot today.....
Key facts
- 8,947 sq ft lot
- 2 garage spots
- Built 2003
Property features AI
Finance
- Other: Occupied; No conditions affecting sale
- Financial info: Loan qualification allowed; Not assumable
- HOA & community: No mandatory association dues
Exterior
- Parking: 2-car garage
- Utilities: Homestead exempt status indicated
- Home design: Single-family residence; One level; Residential property in the Cobblestone Hollow addition
- Construction: Brick and frame construction; Composition roof; Slab foundation; Existing property
- Exterior features: Located on a cul-de-sac; No notable exterior features listed
Interior
- Bedrooms: 3 bedrooms
- Bathrooms: 2 full bathrooms
- Interior features: One living area; Gas log fireplace
Neighborhood map
What this means for you Summary
Snapshot
- This is a 3-bed/2.0-bath single-family listed at $165k.
Deal economics
- At list price, monthly cash flow is $163 ($2k/yr) — positive.
- The deal already cash-flows at list — no discount required.
- To meet the 1% rule (rent ≥ 1% of price), the offer needs to be $153k (7.0% below list).
- Recommended offer: $153k (7.0% below list) — sets the bar for 1% rule.
Location & tenants
- Location reads 53/100 on livability (#615 in OK) — a working-class tenant base; expect higher turnover. Strengths: cost of living A+, housing A+; Watch: crime D, amenities F, commute F.
- Oklahoma City (urban): math 7% / reading 10% proficiency, ranked #254 of 270 in OK (top 94%) — low school quality limits family demand, transient renter base, plan for 1-2y turnover; 82% free/reduced lunch — lower-income household profile, screen leases tightly.
- Zoned schools: Spencer Es (math 2% / reading 2%, grade F, #802 of 845 statewide, top 100%, 410 students, 0% FRL); Star Spencer Hs (math 5% / reading 5%, grade F, #430 of 447 statewide, top 99%, 378 students, 0% FRL) — zoned schools average 0% FRL vs 82% district-wide (82 pts lower); this property's tenant base skews higher-income than the district average.
- Market conditions: 49 active listings in the ZIP; 8 comparable units currently listed for rent nearby; rentals lingering (median 44d on market — plan ~5-8 weeks vacancy on turnover, expect pricing pressure); 50% of comp listings sitting > 30 days — soft ceiling on asking rent; 5,365 units permitted in Oklahoma County in 2024 (569 in 5+ unit buildings).
Forward outlook
- In year one you build about $18k of equity ($1k loan paydown + $16k appreciation (10.0% local appreciation)).
- Oklahoma County population projected at +41% by 2050 — long-run rental-demand tailwind backs the buy-and-hold thesis.
- At projected returns (10.0% appreciation + 3.0% rent growth), your $46k cash investment doubles in ~3 years — after that, you're playing with house money.
- By year 3, paydown + projected appreciation supports a ~$45k cash-out refi (75% LTV) — recoverable capital for the next deal without selling this one.
Negotiation context
- It's been on market 30 days — a 2% lower offer ($163k) is reasonable based on typical stale-listing flexibility.
- 2 sale attempts since 23y ago; this cycle's ask has dropped $15k (8%) from the opening price — seller is motivated, your offer sets the floor, not the list.
- Current owner paid $103k; list at $165k implies a 60% gain — meaningful room to come down on a strong offer.
Risks & watch-outs
- Climate carrying-cost: extreme-heat days projected 7→19/yr by 2055 (HVAC capex compounding) — expect insurance premiums to compound above CPI over the hold.
Questions for the listing agent
- Is there a deadline driving the sale (1031 exchange, divorce, estate, relocation)? That informs how much negotiation room exists.
- Schools are F-rated, which usually means shorter tenancies and higher turnover. Who's the typical renter profile here, and what's been the actual vacancy rate?
- Crime grade is D in this area — have there been break-ins, vandalism, or insurance claims at this property in the last 3 years? What carrier currently insures it and at what premium?
- What's the average days-on-market for RENTAL listings here right now (not sales)? A rising rental-DOM trend means longer vacancies and softer asking-rent achievability than the comps imply.
- What's the recent tenant-quality profile in this submarket — average credit score on applications, eviction rate, late-payment / NSF rate, and stable-employment percentage? A property-management company in the area should have these aggregated.
- How much new for-sale + rental construction is in the pipeline within 1–3 miles? Heavy new supply typically softens prices + rents 12–24 months out; constrained supply supports both.
Investment metrics
- 1% rule
- 0.93% ✗
- Cap rate
- 7.48%
- Cash-on-cash
- 4.24%
- DSCR
- 1.19
- GRM
- 9.0
CMA / ARV
- ARV (median comp)
- $173,232
- List price
- $165,000
- Delta
- -4.75%
- Verdict
- FAIR
- Comps
- 20 within 1.0 mi
Show comp detail 8 sales within ~0.75 mi
| Address | Dist | Beds/Ba | Sqft | Sold | Price | $/sf | Match |
|---|---|---|---|---|---|---|---|
| 3701 Beal Ave | 0.15mi | 3/2.0 | 1,500 (-5%) | 11mo | $195,000 | $130 | 75 |
| 8620 NE 34th Pl | 0.06mi | 3/2.0 | 1,439 (-9%) | 11mo | $199,000 | $138 | 73 |
| 8917 Cecile Pl | 0.48mi | 3/2.0 | 1,500 (-5%) | 14mo | $193,000 | $129 | 58 |
| 4102 Cramer Rd | 0.67mi | 3/2.0 | 1,653 (+5%) | 5mo | $320,000 | $194 | 57 |
| 8734 Silver Creek Dr | 0.71mi | 3/1.5 | 1,449 (-8%) | 10mo | $85,000 | $59 | 43 |
| 8014 NE 35th St | 0.60mi | 3/2.0 | 1,433 (-9%) | 16mo | $194,754 | $136 | 43 |
| 8726 Silver Creek Dr | 0.73mi | 3/2.0 | 1,379 (-13%) | 4mo | $130,000 | $94 | 42 |
| 8510 NE 25th St | 0.73mi | 3/2.0 | 1,706 (+8%) | 15mo | $160,033 | $94 | 40 |
Match score weights: distance 35% · size 25% · config 20% · recency 20%. Top-matched comps best support the ARV.
Projected returns pro-forma
10.0% appreciation · 3.0% rent growth · sell at horizon
- IRR
- 27.3%
- Equity multiple
- 3.17×
- Total profit
- $100,234
- Equity at exit
- $148,645
- IRR
- 23.9%
- Equity multiple
- 7.21×
- Total profit
- $286,925
- Equity at exit
- $320,559
Cash invested: $46,200 (down + closing). Projections, not guarantees.
Landlord ↔ Tenant lean methodology
- Overall (STATE)
- 83 Strongly Landlord-Friendly
- State Oklahoma
- 83 Strongly Landlord-Friendly · R+20
- County
- — inherits STATE
- City
- — inherits STATE
ZIP-level market 73084
- Home prices YoY
- 24.3%
- Active inventory
- 49
- Price-to-rent
- 9.0×
Monthly cashflow live
- Estimated rent
- $1,534 high interval (Pro) →
- Mortgage (P&I)
- −$865
- Tax from tax record
- −$115 /mo · $1,377/yr
- Insurance
- −$69
- HOA
- −$0
- Vacancy / Maint / Mgmt
- −$322
- Net cashflow
- $163
Break-even live
UW: 25.0% down · 7.5% · 30yr · 1.5% tax · 5.0% vac · 8.0% maint · 8.0% mgmt
Financing live
Cash to close
- Down payment
- $41,250
- Closing costs
- $4,950
- Reserves months
- —
- Total cash needed
- —
Loan-product check · same deal, 3 products live
Conventional
25% down · 7.5% · 30yr
- Down + closing
- —
- Monthly P&I
- —
- Monthly cashflow
- —
- DSCR
- —
- Eligible?
- —
Personal DTI + credit; lowest rate.
DSCR
20% down · 8.5% · 30yr
- Down + closing
- —
- Monthly P&I
- —
- Monthly cashflow
- —
- DSCR
- —
- Eligible?
- —
No personal income docs; deal must DSCR.
Hard money
10% down · 12.0% · 12mo
- Down + closing
- —
- Monthly P&I
- —
- Monthly cashflow
- —
- DSCR
- —
- Eligible?
- —
Short-term bridge; refi at stabilization.
Rent comps 8 comps
| Address | Beds | Baths | Sqft | Rent | $/sqft | DOM | Units | Dist |
|---|---|---|---|---|---|---|---|---|
| 2823 Juvene Cir Spencer, OK | 3.0 | 2.0 | 1080 | $1,800 | $1.67 | 2d | 1 | 0.50mi |
| 4800 Spencer Rd Spencer, OK | 3.0 | 1.5 | 1742 | $1,675 | $0.96 | 43d | 1 | 0.93mi |
| 8741 Hillridge Dr Oklahoma City, OK | 3.0 | 2.0 | 1182 | $1,495 | $1.26 | 43d | 1 | 1.00mi |
| 8741 Hillridge Dr Oklahoma City, OK | 3.0 | 2.0 | 1182 | $1,495 | $1.26 | 2d | 1 | 1.00mi |
| 2008 Midridge Dr Oklahoma City, OK | 3.0 | 2.0 | 1232 | $1,325 | $1.08 | 14d | 1 | 1.05mi |
| 1619 N Douglas Blvd Oklahoma City, OK | 3.0 | 2.0 | 1152 | $1,129 | $0.98 | 1d | 1 | 1.46mi |
| 1620 Cynthia Dr Oklahoma City, OK | 4.0 | 1.0 | 1203 | $1,450 | $1.21 | 43d | 1 | 1.49mi |
| 1617 Cynthia Dr Oklahoma City, OK | 4.0 | 1.0 | 1161 | $1,450 | $1.25 | 43d | 1 | 1.49mi |
Listing history 5 events
-
2026-05-13price $165,000 862-char remark
-
2026-04-27$180,000 Active 862-char remark
-
2003-11-24soldstatus $102,950 159-char remark
Show marketing remark (159 chars)
One of many new homes being built in the area. This one already has a buyer, but we can build the same one for you, give us a call to pick your lot today.....
-
2003-03-19soldstatus $90,000
-
2003-03-11$99,845 159-char remark
Show marketing remark (159 chars)
One of many new homes being built in the area. This one already has a buyer, but we can build the same one for you, give us a call to pick your lot today.....
ⓘ Source: listings_history table (triggers on properties + properties_extension) + one-shot
backfill from property_details.listing_events for pre-trigger history.
Tax reassessment forecast OK · Resets to sale price
- Current annual tax
- $1,377 · $115/mo
- Projected year-2 tax
- $1,485 · $124/mo
- Expected delta
- +$108/yr (+$9/mo · 7.9%)
ⓘ Screening estimate from a state-policy table — verify with the county assessor before closing.
Climate risk First Street
- Flood 1/10 Low FEMA zone X (unshaded) · 0% chance over 30 yrs
- Wildfire 4/10 Moderate
- Heat 6/10 Major 7 d/yr ≥107°F today · 19 d/yr by 30 yrs out
- Wind 3/10 Moderate 4% chance of damaging wind over 30 yrs
- Air quality 2/10 Low 1 unhealthy d/yr today · 2 by 30 yrs out
Nearby sold comps map
Loading sold comps map…
Walkable amenities ~0.75 mi
Loading nearby amenities…
Taxation est. · year 1
- Rental income
- $18,412
- − Mortgage interest
- −$9,243
- − Property taxes
- −$1,377
- − Insurance
- −$825
- − Repairs & maintenance
- −$1,473
- − Management
- −$1,473
- − Depreciation
- −$4,800
- Taxable loss
- −$779
- Est. tax savings @ 24.0%
- +$187
- After-tax cash flow
- $2,147/yr
For passive investors: Depreciation is non-cash, so a rental often shows a tax loss while cash-flowing — sheltering income. Rental losses are passive: they offset passive income freely, and up to $25,000/yr can offset ordinary (W-2) income if you actively participate and your MAGI is under $100k (phasing out to $0 by $150k); unused losses carry forward. On sale, claimed depreciation is recaptured at up to 25%, and gains may owe capital-gains tax (a 1031 exchange can defer both). Figures are a year-1 estimate at your 24.0% rate — not tax advice; consult a CPA.
Schools (NCES district)
- District
- Oklahoma City
- NCES district ID
- 4022770
- Math proficiency
- 7% ▼ -5.00%
- Reading proficiency
- 10% ▼ -6.00%
- Median HH income
- $35,606
- Composite
- 7.0/100
- National rank
- #9970
- State rank
- #254 of 270 in OK
Livability — Spencer
- Score
- 53/100
- State rank
- #615
- US rank
- #24440
Category grades
Schools grade is shown separately in the Schools card above.
Census & demographics
- Census place
- Spencer, OK
- Population (ZIP)
- 6,296
Population outlook (Oklahoma County) Hauer SSP2
- Today (2025)
- 911,875 people
- By 2030
- 982,413 · +7.7%
- By 2040
- 1,130,468 · +24.0%
- By 2050
- 1,288,422 · +41.3%
- By 2075
- 1,711,482 · +87.7%
- By 2100
- 2,088,448 · +129.0%
Race, ethnicity, and origin ACS 2023
- Neighborhood character
- Diverse neighborhood (Simpson 0.64)
- Race & ethnicity
- Black 52% White 24% Hispanic / Latino 16% Two or more races 12% Native American 2%
- Hispanic origin (detail)
- Mexican 14%
- Common ancestry
- Italian 2% Lithuanian 2%
- Foreign-born
- 6% · Canada
- Languages at home
- 86% English-only · Spanish 14%
Political lean MEDSL · Oklahoma
- 2024 margin
- Toss-up / Even · D 48.0% · R 49.7% · Other 2.3%
- 2008→2024 swing
- +15.1pp toward D · 2008: -16.8pp · 2024: -1.7pp
- All cycles
- 2024: R+1.7 2020: R+1.1 2016: R+10.5 2012: R+16.7 2008: R+16.8
Not yet ingested
- Civics
- —
Market trends
- HPI YoY
- ▲ 53.65%
- Current HPI
- 274.4301
- Rent YoY
- —
- Metro
- —
- State GDP YoY
- ▲ 1.55%
- F500 in state
- 6
Industry mix (Fortune 500 HQ in OK)
| Industry | F500 HQs | Revenue |
|---|---|---|
| Energy | 3 | $48B |
|
||
Price history
+65.3% since first listed6 events — show timeline
- 2026-05-29 Pending — MLSOK
- 2026-05-13 Price Changed $165,000 MLSOK
- 2026-04-27 Listed $180,000 MLSOK
- 2003-11-24 Sold (MLS) $102,950 MLSOK
- 2003-03-19 Sold (Public Records) $90,000 Public Records
- 2003-03-11 Listed $99,845 MLSOK
Property tax history
+2.8%/yrLatest (2025): $1,377 · +2.1% YoY. Source: county tax records.
Cash-flow waterfall
monthlySold comps — $/sqft
last 12 mo · ≤1 miLoading sold comps…