33000 Cape Kiwanda Dr Unit 5WK28 · Pacific City, OR
Flood risk 1/10 · Minimal
- FEMA flood zone
- X (unshaded)
- Chance of flooding over 30 yrs
- 0.0%
- Est. flood insurance / yr
- $473 – $860
Fire risk 1/10 · Minimal
- Est. fire insurance / yr
- $498 – $926
Heat risk 1/10 · Minimal
- Hot days now (above 77°F)
- 8 days/yr
- Hot days in 30 yrs
- 18 days/yr
Wind risk 1/10 · Minimal
- Chance of severe wind over 30 yrs
- —
Air-quality risk 7/10 · Major
- Unhealthy air days now
- 11 days/yr
- Unhealthy air days in 30 yrs
- 11 days/yr
Risk factors via First Street. Map © Google.
Why this score? — see what drove the B grade
The composite is a weighted blend of 9 inputs, each scored 0–100. Each bar is that input's sub-score; the figure is the points it added to the 100-point composite (weight × sub-score).
- Cash flow +30.0/30.0
- 1% rule +10.0/10.0
- DSCR +10.0/10.0
- Appreciation +5.4/10.0
- Condition / age +4.8/5.0
- Schools +3.7/10.0
- Livability +3.4/5.0
- Rent growth +2.5/5.0
- ARV discount +1.0/15.0
$69,000
🖨 Deal sheet 📄 Offer letter ✓ Due diligence
Listing remarks MLS
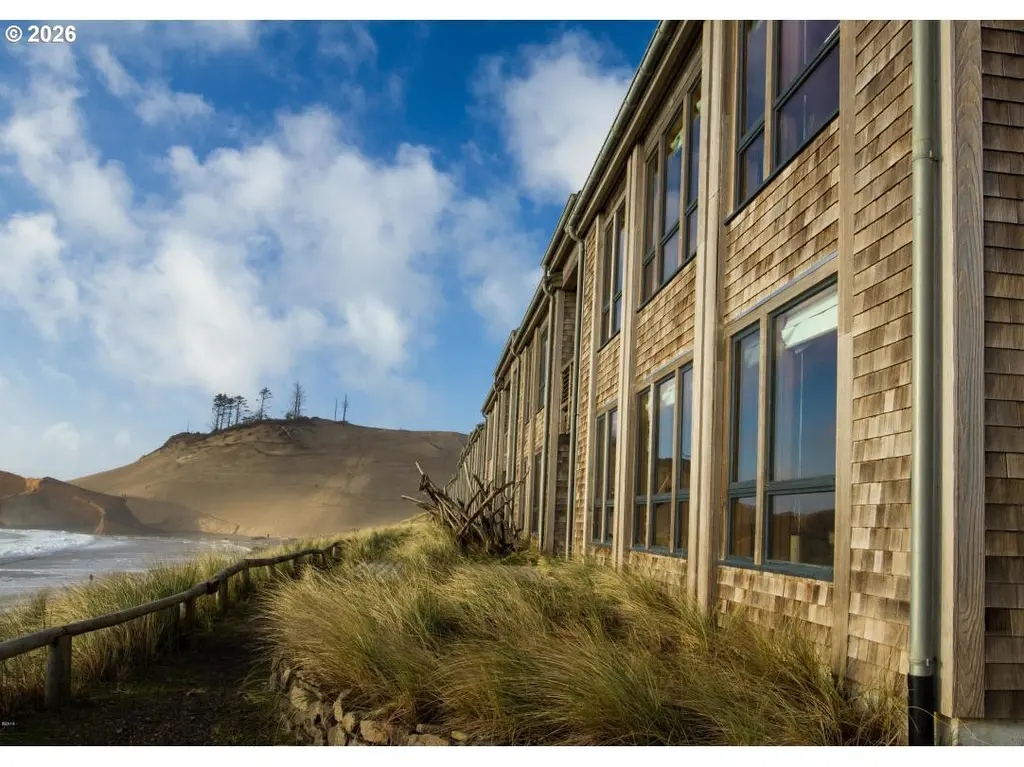
Beautiful, upper-level, three-bedroom, two-bath cottage features a large oceanfront patio perfect for watching dory boats, sunsets, surfers, and whales. As a professionally managed property, you can enjoy three weeks of relaxation annually with ease. The Cottages are fully equipped with a washer/dryer, gourmet kitchen, propane BBQ, and cleaning supplies. After your activities, you can visit Meridian Restaurant and Bar or use the oceanview hot tub. Perfect 2nd home with luxury amenities to enjoy.
Key facts
- Gourmet kitchen
- Propane bbq
- Oceanfront patio
Tags
Neighborhood map
What this means for you Summary
Snapshot
- This is a 3-bed/2.0-bath single-family listed at $69k. Condition is rated excellent.
Deal economics
- At list price, monthly cash flow is $1k ($16k/yr) — positive.
- The deal already cash-flows at list — no discount required.
- Meets the 1% rule at list price ($2k rent vs $69k).
- Recommended offer: $65k (6.0% below list) — sets the bar for market timing.
- Cap rate 29.0% vs local median 1.9% in Pacific City — top-decile yield for the area; either an underpriced asset or a hidden risk that comps aren't pricing in. Stress-test before assuming the spread holds.
Location & tenants
- Location reads 67/100 on livability (#173 in OR) — a middle-class / working-renter tenant base. Strengths: crime A+, employment B, housing B; Watch: commute D+, health & safety D+, schools F.
- Nestucca Valley SD 101J (rural): math 33% / reading 50% proficiency, ranked #101 of 183 in OR (top 55%) — families likely to look elsewhere, expect single-tenant / working-renter base with shorter leases.
- Market conditions: 113 active listings in the ZIP; 86 units permitted in Tillamook County in 2024 (0 in 5+ unit buildings).
Forward outlook
- In year one you build about $980 of equity ($477 loan paydown + $503 appreciation (0.7% local appreciation)).
- Tillamook County population projected at +3% by 2050 — modest demand growth; plan on rents tracking national, not racing it.
- At projected returns (0.7% appreciation + 3.0% rent growth), your $19k cash investment doubles in ~2 years — after that, you're playing with house money.
Negotiation context
- It's been on market 69 days — a 6% lower offer ($65k) is reasonable based on typical stale-listing flexibility.
Questions for the listing agent
- It's been on market 69 days. Have you received any prior offers? Is the seller open to a 6% concession, seller financing, or rate buy-down credit?
- Why hasn't it sold? Are there any deal-killer items the seller is aware of (foundation, flood, title, zoning, code violations)?
- Is there a deadline driving the sale (1031 exchange, divorce, estate, relocation)? That informs how much negotiation room exists.
- Schools are F-rated, which usually means shorter tenancies and higher turnover. Who's the typical renter profile here, and what's been the actual vacancy rate?
- What's the average days-on-market for RENTAL listings here right now (not sales)? A rising rental-DOM trend means longer vacancies and softer asking-rent achievability than the comps imply.
- What's the recent tenant-quality profile in this submarket — average credit score on applications, eviction rate, late-payment / NSF rate, and stable-employment percentage? A property-management company in the area should have these aggregated.
- How much new for-sale + rental construction is in the pipeline within 1–3 miles? Heavy new supply typically softens prices + rents 12–24 months out; constrained supply supports both.
Investment metrics
- 1% rule
- 3.27% ✓
- Cap rate
- 29.00%
- Cash-on-cash
- 81.10%
- DSCR
- 4.61
- GRM
- 2.5
CMA / ARV
- ARV (median comp)
- $60,332
- List price
- $69,000
- Delta
- 14.37%
- Verdict
- OVERPRICED
- Comps
- 20 within 1.0 mi
Show comp detail 11 sales within ~0.75 mi
| Address | Dist | Beds/Ba | Sqft | Sold | Price | $/sf | Match |
|---|---|---|---|---|---|---|---|
| 33000 Cape Kiwanda Dr Unit 5, week 27 | 0.00mi | 3/2.0 | 1,150 (0%) | 8mo | $72,000 | $63 | 93 |
| 33000 Cape Kiwanda Dr Unit 8, week 29 | 0.02mi | 3/2.0 | 1,150 (0%) | 12mo | $45,000 | $39 | 89 |
| 33000 Cape Kiwanda Dr Unit 14, week 34 | 0.04mi | 3/2.0 | 1,150 (0%) | 20mo | $60,000 | $52 | 82 |
| 5755 Barefoot Ln | 0.37mi | 2/2.0 (-1) | 1,176 (+2%) | 6mo | $583,500 | $496 | 69 |
| 33000 Cape Kiwanda Dr Unit 3WK29 | 0.00mi | 2/2.0 (-1) | 985 (-14%) | 11mo | $47,000 | $48 | 62 |
| 33000 Cape Kiwanda Dr Unit 10 Wk 29 | 0.02mi | 2/2.0 (-1) | 985 (-14%) | 12mo | $45,916 | $47 | 61 |
| 33000 Cape Kiwanda Dr Unit 3 Wk 29 | 0.01mi | 2/2.0 (-1) | 985 (-14%) | 13mo | $47,000 | $48 | 60 |
| 33000 Cape Kiwanda Dr | 0.02mi | 2/2.0 (-1) | 985 (-14%) | 22mo | $53,500 | $54 | 52 |
| 5835 Barefoot Ln | 0.39mi | 2/1.5 (-1) | 1,249 (+9%) | 11mo | $573,000 | $459 | 51 |
| 5990 Summerhouse Ln | 0.48mi | 2/2.0 (-1) | 1,268 (+10%) | 10mo | $632,000 | $498 | 47 |
| 5785 Barefoot Ln | 0.37mi | 2/2.0 (-1) | 1,314 (+14%) | 19mo | $619,000 | $471 | 38 |
Match score weights: distance 35% · size 25% · config 20% · recency 20%. Top-matched comps best support the ARV.
Projected returns pro-forma
0.73% appreciation · 3.0% rent growth · sell at horizon
- IRR
- 83.9%
- Equity multiple
- 5.33×
- Total profit
- $83,576
- Equity at exit
- $22,588
- IRR
- 84.9%
- Equity multiple
- 10.93×
- Total profit
- $191,847
- Equity at exit
- $29,283
Cash invested: $19,320 (down + closing). Projections, not guarantees.
Landlord ↔ Tenant lean methodology
- Overall (STATE)
- 28 Tenant-Leaning
- State Oregon
- 28 Tenant-Leaning · D+6
- County
- — inherits STATE
- City
- — inherits STATE
ZIP-level market 97135
- Home prices YoY
- 0.4%
- Active inventory
- 113
- Price-to-rent
- 2.5×
Monthly cashflow live
- Estimated rent
- $2,256 medium interval (Pro) →
- Mortgage (P&I)
- −$362
- Tax est. 1.5%
- −$86 /mo · $1,035/yr
- Insurance
- −$29
- HOA
- −$0
- Vacancy / Maint / Mgmt
- −$474
- Net cashflow
- $1,306
Break-even live
UW: 25.0% down · 7.5% · 30yr · 1.5% tax · 5.0% vac · 8.0% maint · 8.0% mgmt
Financing live
Cash to close
- Down payment
- $17,250
- Closing costs
- $2,070
- Reserves months
- —
- Total cash needed
- —
Loan-product check · same deal, 3 products live
Conventional
25% down · 7.5% · 30yr
- Down + closing
- —
- Monthly P&I
- —
- Monthly cashflow
- —
- DSCR
- —
- Eligible?
- —
Personal DTI + credit; lowest rate.
DSCR
20% down · 8.5% · 30yr
- Down + closing
- —
- Monthly P&I
- —
- Monthly cashflow
- —
- DSCR
- —
- Eligible?
- —
No personal income docs; deal must DSCR.
Hard money
10% down · 12.0% · 12mo
- Down + closing
- —
- Monthly P&I
- —
- Monthly cashflow
- —
- DSCR
- —
- Eligible?
- —
Short-term bridge; refi at stabilization.
Listing history 15 events
-
2026-06-18days on market $69,000 Active 69 DOM
-
2026-06-17days on market $69,000 Active 68 DOM
-
2026-06-16days on market $69,000 Active 67 DOM
-
2026-06-15days on market $69,000 Active 66 DOM
-
2026-06-13days on market $69,000 Active 64 DOM
-
2026-06-12days on market $69,000 Active 63 DOM
-
2026-06-09days on market $69,000 Active 60 DOM
-
2026-06-08days on market $69,000 Active 59 DOM
-
2026-06-08days on market $69,000 Active 58 DOM
-
2026-06-07days on market $69,000 Active 57 DOM
-
2026-06-04days on market $69,000 Active 54 DOM
-
2026-06-02days on market $69,000 Active 53 DOM
-
2026-06-01days on market $69,000 Active 52 DOM
-
2026-05-31days on market $69,000 Active 51 DOM
-
2026-04-10$69,000 Active 500-char remark
Show marketing remark (500 chars)
Beautiful, upper-level, three-bedroom, two-bath cottage features a large oceanfront patio perfect for watching dory boats, sunsets, surfers, and whales. As a professionally managed property, you can enjoy three weeks of relaxation annually with ease. The Cottages are fully equipped with a washer/dryer, gourmet kitchen, propane BBQ, and cleaning supplies. After your activities, you can visit Meridian Restaurant and Bar or use the oceanview hot tub. Perfect 2nd home with luxury amenities to enjoy.
ⓘ Source: listings_history table (triggers on properties + properties_extension) + one-shot
backfill from property_details.listing_events for pre-trigger history.
Climate risk First Street
- Flood 1/10 Low FEMA zone X (unshaded) · 0% chance over 30 yrs
- Wildfire 1/10 Low
- Heat 1/10 Low 8 d/yr ≥77°F today · 18 d/yr by 30 yrs out
- Wind 1/10 Low
- Air quality 7/10 Severe 11 unhealthy d/yr today · 11 by 30 yrs out
Nearby sold comps map
Loading sold comps map…
Walkable amenities ~0.75 mi
Loading nearby amenities…
Taxation est. · year 1
- Rental income
- $27,077
- − Mortgage interest
- −$3,865
- − Property taxes
- −$1,035
- − Insurance
- −$345
- − Repairs & maintenance
- −$2,166
- − Management
- −$2,166
- − Depreciation
- −$2,007
- Taxable income
- $15,492
- Est. tax owed @ 24.0%
- −$3,718
- After-tax cash flow
- $11,950/yr
For passive investors: Depreciation is non-cash, so a rental often shows a tax loss while cash-flowing — sheltering income. Rental losses are passive: they offset passive income freely, and up to $25,000/yr can offset ordinary (W-2) income if you actively participate and your MAGI is under $100k (phasing out to $0 by $150k); unused losses carry forward. On sale, claimed depreciation is recaptured at up to 25%, and gains may owe capital-gains tax (a 1031 exchange can defer both). Figures are a year-1 estimate at your 24.0% rate — not tax advice; consult a CPA.
Condition & rehab AI · 8 photos
This property is in excellent condition with a beautiful oceanfront view. It is move-in ready and would benefit from some modern updates to the kitchen and interior paint to further enhance its appeal.
Value-add opportunities
- Resale update kitchen cabinets to modern style — modernizing the kitchen can attract more buyers
- Resale paint interior walls — fresh paint can make the interior look more appealing
- Resale replace countertops — new countertops can enhance the kitchen's aesthetic
- Both install smart home devices — smart home devices can increase both resale and rental value
Renovation cost estimate screening
Value-add ROI direction
- Resale update kitchen cabinets to modern style — modernizing the kitchen can attract more buyers ↑
- Resale paint interior walls — fresh paint can make the interior look more appealing ↑
- Resale replace countertops — new countertops can enhance the kitchen's aesthetic ↑
- Both install smart home devices — smart home devices can increase both resale and rental value ↑
ⓘ Cost ranges are severity-bucket heuristics (US national rule-of-thumb). Get contractor quotes + a written scope before underwriting a rehab budget.
Schools (NCES district)
- District
- Nestucca Valley SD 101J
- NCES district ID
- 4108700
- Math proficiency
- 33% ▼ -4.00%
- Reading proficiency
- 50% ▼ -4.00%
- Median HH income
- $41,958
- Composite
- 37.3/100
- National rank
- #8956
- State rank
- #101 of 183 in OR
Livability — Pacific City
- Score
- 67/100
- State rank
- #173
- US rank
- #10340
Category grades
Schools grade is shown separately in the Schools card above.
Census & demographics
- Census place
- Pacific City, OR
- City population
- 1,505
- Population (ZIP)
- 1,505
Population outlook (Tillamook County) Hauer SSP2
- Today (2025)
- 26,318 people
- By 2030
- 26,603 · +1.1%
- By 2040
- 26,898 · +2.2%
- By 2050
- 27,129 · +3.1%
- By 2075
- 27,858 · +5.9%
- By 2100
- 26,212 · -0.4%
Race, ethnicity, and origin ACS 2023
- Neighborhood character
- Predominantly White (86%)
- Race & ethnicity
- White 86% Hispanic / Latino 8% Two or more races 3%
- Hispanic origin (detail)
- Mexican 8%
- Common ancestry
- Lithuanian 8% Italian 5% Romanian 5%
- Foreign-born
- 1%
- Languages at home
- 97% English-only · Spanish 3%
Political lean MEDSL · Tillamook
- 2024 margin
- Toss-up / Even · D 47.9% · R 49.2% · Other 2.9%
- 2008→2024 swing
- -11.2pp toward R · 2008: 9.9pp · 2024: -1.4pp
- All cycles
- 2024: R+1.4 2020: R+1.7 2016: R+5.9 2012: D+4.7 2008: D+9.9
Not yet ingested
- Civics
- —
Market trends
- HPI YoY
- ▲ 0.73%
- Current HPI
- 197.7747
- Rent YoY
- —
- Metro
- —
- State GDP YoY
- ▲ 2.05%
- F500 in state
- 2
Industry mix (Fortune 500 HQ in OR)
| Industry | F500 HQs | Revenue |
|---|---|---|
| Consumer Goods | 1 | $51B |
|
||
Price history
1 event — show timeline
- 2026-04-10 Listed $69,000 RMLS
Cash-flow waterfall
monthlySold comps — $/sqft
last 12 mo · ≤1 miLoading sold comps…