516 W Elm St · Harrisburg, IL
Flood risk 1/10 · Minimal
- FEMA flood zone
- X (unshaded)
- Chance of flooding over 30 yrs
- 0.0%
- Est. flood insurance / yr
- $507 – $1,088
Fire risk 1/10 · Minimal
- Est. fire insurance / yr
- $804 – $1,492
Heat risk 5/10 · Moderate
- Hot days now (above 108°F)
- 7 days/yr
- Hot days in 30 yrs
- 20 days/yr
Wind risk 2/10 · Minimal
- Chance of severe wind over 30 yrs
- 3.0%
Air-quality risk 2/10 · Minimal
- Unhealthy air days now
- 1 days/yr
- Unhealthy air days in 30 yrs
- 1 days/yr
Risk factors via First Street. Map © Google.
Why this score? — see what drove the D grade
The composite is a weighted blend of 9 inputs, each scored 0–100. Each bar is that input's sub-score; the figure is the points it added to the 100-point composite (weight × sub-score).
- Cash flow +15.0/30.0
- ARV discount +7.5/15.0
- 1% rule +5.0/10.0
- DSCR +5.0/10.0
- Livability +3.6/5.0
- Rent growth +2.5/5.0
- Condition / age +2.5/5.0
- Schools +1.3/10.0
- Appreciation +0.0/10.0
$7,500
🖨 Deal sheet 📄 Offer letter ✓ Due diligence
Listing remarks MLS
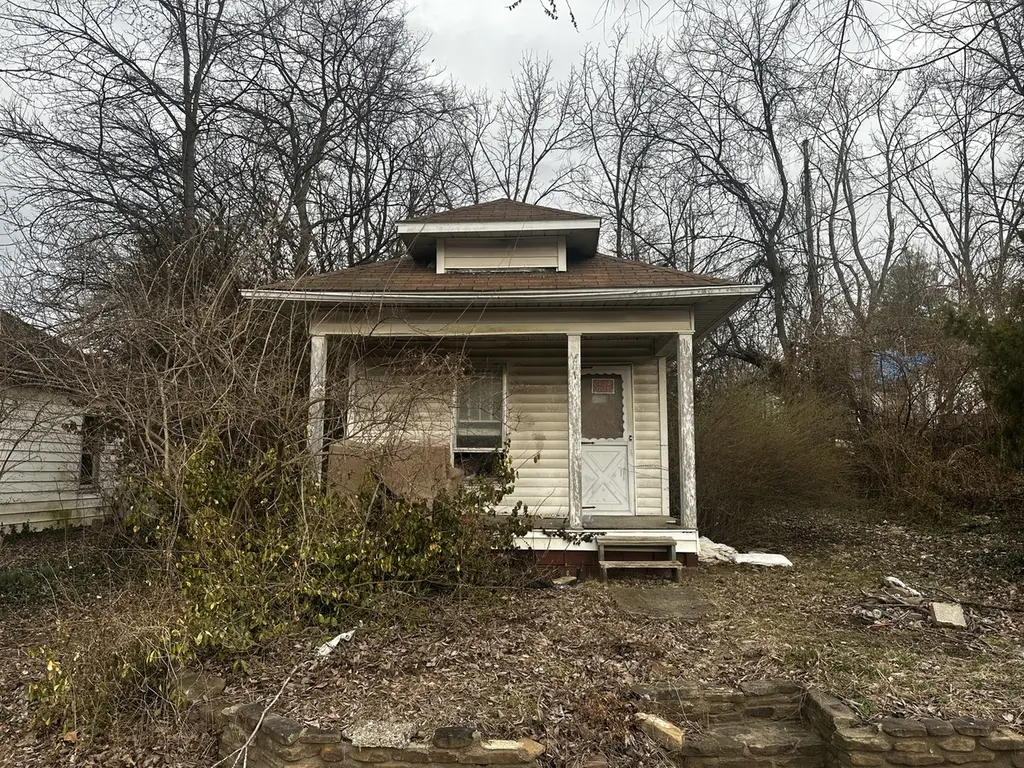
Looking for a tiny house? Check out this row style home in Harrisburg! This home is not habitable. This property is being Sold AS-IS. No interior access to structure allowed. Buyers Must Do Their Own Due Diligence to Verify Number of Beds, Baths, Square Footage, Room Sizes, Lot Size & Any Other Property Details. Listing Broker & Seller assume no responsibility and make no guarantees, warranties (expressed or implied) or representations as to the availability or accuracy of information contained herein.
Key facts
- 5,000 sq ft lot
- Listed 105 days
Neighborhood map
What this means for you Summary
Snapshot
- This is a 2-bed/1.0-bath single-family listed at $8k.
Deal economics
- At list price, monthly cash flow is $611 ($7k/yr) — positive.
- The deal already cash-flows at list — no discount required.
- Meets the 1% rule at list price ($850 rent vs $8k).
- Recommended offer: $7k (9.0% below list) — sets the bar for market timing.
- Cap rate 104.1% vs local median 5.1% in Harrisburg — top-decile yield for the area; either an underpriced asset or a hidden risk that comps aren't pricing in. Stress-test before assuming the spread holds.
Location & tenants
- Location reads 72/100 on livability (#309 in IL) — a middle-class / working-renter tenant base. Strengths: crime A+, cost of living A+, housing A+; Watch: schools F, commute F, employment F.
- Harrisburg CUSD 3 (town): math 5% / reading 25% proficiency, ranked #521 of 620 in IL (top 84%) — low school quality limits family demand, transient renter base, plan for 1-2y turnover.
- Market conditions: 73 active listings in the ZIP.
Forward outlook
- Local home prices are declining (-3.0%/yr); year-one equity from $52 of loan paydown is wiped out by about $225 of value loss. Plan a longer hold.
- Saline County population projected at -16% by 2050 — secular population decline; favor cash flow + early exit over multi-decade hold.
- At projected returns (-3.0% appreciation + 3.0% rent growth), your $2k cash investment doubles in ~1 year — after that, you're playing with house money.
Negotiation context
- It's been on market 106 days — a 9% lower offer ($7k) is reasonable based on typical stale-listing flexibility.
Risks & watch-outs
- Watch-outs: property tax is 2.8% of price.
- Climate carrying-cost: extreme-heat days projected 7→20/yr by 2055 (HVAC capex compounding) — expect insurance premiums to compound above CPI over the hold.
Questions for the listing agent
- It's been on market 106 days. Have you received any prior offers? Is the seller open to a 9% concession, seller financing, or rate buy-down credit?
- Property tax is high relative to price — has the assessment been appealed recently, and will the sale trigger a re-assessment?
- Why hasn't it sold? Are there any deal-killer items the seller is aware of (foundation, flood, title, zoning, code violations)?
- Is there a deadline driving the sale (1031 exchange, divorce, estate, relocation)? That informs how much negotiation room exists.
- Schools are F-rated, which usually means shorter tenancies and higher turnover. Who's the typical renter profile here, and what's been the actual vacancy rate?
- The area grade is low — what's the realistic commute time and amenity access for the typical tenant pool here? Any planned neighborhood developments (good or bad) we should know about?
- What's the average days-on-market for RENTAL listings here right now (not sales)? A rising rental-DOM trend means longer vacancies and softer asking-rent achievability than the comps imply.
- What's the recent tenant-quality profile in this submarket — average credit score on applications, eviction rate, late-payment / NSF rate, and stable-employment percentage? A property-management company in the area should have these aggregated.
- How much new for-sale + rental construction is in the pipeline within 1–3 miles? Heavy new supply typically softens prices + rents 12–24 months out; constrained supply supports both.
Investment metrics
- 1% rule
- 11.33% ✓
- Cap rate
- 104.08%
- Cash-on-cash
- 349.26%
- DSCR
- 16.54
- GRM
- 0.7
CMA / ARV
- ARV (median comp)
- $50,227
- List price
- $7,500
- Delta
- -85.07%
- Verdict
- UNDERPRICED
- Comps
- 2 within 1.0 mi
Projected returns pro-forma
-3.0% appreciation · 3.0% rent growth · sell at horizon
- IRR
- —
- Equity multiple
- 18.97×
- Total profit
- $37,730
- Equity at exit
- $1,118
- IRR
- —
- Equity multiple
- 40.55×
- Total profit
- $83,052
- Equity at exit
- $648
Cash invested: $2,100 (down + closing). Projections, not guarantees.
Landlord ↔ Tenant lean methodology
- Overall (STATE)
- 43 Moderately Tenant-Leaning
- State Illinois
- 43 Moderately Tenant-Leaning · D+7
- County
- — inherits STATE
- City
- — inherits STATE
ZIP-level market 62946
- Active inventory
- 73
- Price-to-rent
- 0.7×
Monthly cashflow live
- Estimated rent
- $850 medium interval (Pro) →
- Mortgage (P&I)
- −$39
- Tax from tax record
- −$18 /mo · $210/yr
- Insurance
- −$3
- HOA
- −$0
- Vacancy / Maint / Mgmt
- −$178
- Net cashflow
- $611
Break-even live
UW: 25.0% down · 7.5% · 30yr · 1.5% tax · 5.0% vac · 8.0% maint · 8.0% mgmt
Financing live
Cash to close
- Down payment
- $1,875
- Closing costs
- $225
- Reserves months
- —
- Total cash needed
- —
Loan-product check · same deal, 3 products live
Conventional
25% down · 7.5% · 30yr
- Down + closing
- —
- Monthly P&I
- —
- Monthly cashflow
- —
- DSCR
- —
- Eligible?
- —
Personal DTI + credit; lowest rate.
DSCR
20% down · 8.5% · 30yr
- Down + closing
- —
- Monthly P&I
- —
- Monthly cashflow
- —
- DSCR
- —
- Eligible?
- —
No personal income docs; deal must DSCR.
Hard money
10% down · 12.0% · 12mo
- Down + closing
- —
- Monthly P&I
- —
- Monthly cashflow
- —
- DSCR
- —
- Eligible?
- —
Short-term bridge; refi at stabilization.
Listing history 16 events
-
2026-06-18days on market $7,500 Active 106 DOM
-
2026-06-17days on market $7,500 Active 105 DOM
-
2026-06-16days on market $7,500 Active 104 DOM
-
2026-06-15days on market $7,500 Active 103 DOM
-
2026-06-13days on market $7,500 Active 101 DOM
-
2026-06-12days on market $7,500 Active 100 DOM
-
2026-06-09days on market $7,500 Active 97 DOM
-
2026-06-08days on market $7,500 Active 96 DOM
-
2026-06-07days on market $7,500 Active 95 DOM
-
2026-06-07days on market $7,500 Active 94 DOM
-
2026-06-04days on market $7,500 Active 91 DOM
-
2026-06-02days on market $7,500 Active 90 DOM
-
2026-06-01days on market $7,500 Active 89 DOM
-
2026-05-31days on market $7,500 Active 88 DOM
-
2026-05-31days on market $7,500 Active 87 DOM
-
2026-03-04$7,500 Active 517-char remark
Show marketing remark (517 chars)
Looking for a tiny house? Check out this row style home in Harrisburg! This home is not habitable. This property is being Sold AS-IS. No interior access to structure allowed. Buyers Must Do Their Own Due Diligence to Verify Number of Beds, Baths, Square Footage, Room Sizes, Lot Size & Any Other Property Details. Listing Broker & Seller assume no responsibility and make no guarantees, warranties (expressed or implied) or representations as to the availability or accuracy of information contained herein.
ⓘ Source: listings_history table (triggers on properties + properties_extension) + one-shot
backfill from property_details.listing_events for pre-trigger history.
Tax reassessment forecast IL · Partial reset (capped growth)
- Current annual tax
- $210 · $18/mo
- Projected year-2 tax
- $210 · $18/mo
- Expected delta
- $0/yr ($0/mo · 0.0%)
ⓘ Screening estimate from a state-policy table — verify with the county assessor before closing.
Climate risk First Street
- Flood 1/10 Low FEMA zone X (unshaded) · 0% chance over 30 yrs
- Wildfire 1/10 Low
- Heat 5/10 Major 7 d/yr ≥108°F today · 20 d/yr by 30 yrs out
- Wind 2/10 Low 3% chance of damaging wind over 30 yrs
- Air quality 2/10 Low 1 unhealthy d/yr today · 1 by 30 yrs out
Nearby sold comps map
Loading sold comps map…
Walkable amenities ~0.75 mi
Loading nearby amenities…
Taxation est. · year 1
- Rental income
- $10,195
- − Mortgage interest
- −$420
- − Property taxes
- −$210
- − Insurance
- −$38
- − Repairs & maintenance
- −$816
- − Management
- −$816
- − Depreciation
- −$218
- Taxable income
- $7,678
- Est. tax owed @ 24.0%
- −$1,843
- After-tax cash flow
- $5,492/yr
For passive investors: Depreciation is non-cash, so a rental often shows a tax loss while cash-flowing — sheltering income. Rental losses are passive: they offset passive income freely, and up to $25,000/yr can offset ordinary (W-2) income if you actively participate and your MAGI is under $100k (phasing out to $0 by $150k); unused losses carry forward. On sale, claimed depreciation is recaptured at up to 25%, and gains may owe capital-gains tax (a 1031 exchange can defer both). Figures are a year-1 estimate at your 24.0% rate — not tax advice; consult a CPA.
Schools (NCES district)
- District
- Harrisburg CUSD 3
- NCES district ID
- 1718270
- Math proficiency
- 5% ▼ -5.00%
- Reading proficiency
- 25% ▼ -9.00%
- Median HH income
- $38,717
- Composite
- 12.61/100
- National rank
- #9613
- State rank
- #521 of 620 in IL
Livability — Harrisburg
- Score
- 72/100
- State rank
- #309
- US rank
- #6073
Category grades
Schools grade is shown separately in the Schools card above.
Census & demographics
- Census place
- Harrisburg, IL
- Population (ZIP)
- 11,465
Population outlook (Saline County) Hauer SSP2
- Today (2025)
- 23,915 people
- By 2030
- 23,262 · -2.7%
- By 2040
- 21,775 · -8.9%
- By 2050
- 20,098 · -16.0%
- By 2075
- 15,234 · -36.3%
- By 2100
- 10,302 · -56.9%
Race, ethnicity, and origin ACS 2023
- Neighborhood character
- Predominantly White (93%)
- Race & ethnicity
- White 93% Two or more races 4% Black 3%
- Common ancestry
- Italian 2% Slovak 2% Serbian 2%
- Foreign-born
- 0%
Political lean MEDSL · Saline
- 2024 margin
- Solid R (+49.0) · D 24.8% · R 73.8% · Other 1.3%
- 2008→2024 swing
- -40.1pp toward R · 2008: -8.9pp · 2024: -49.0pp
- All cycles
- 2024: R+49.0 2020: R+47.9 2016: R+50.7 2012: R+29.0 2008: R+8.9
Not yet ingested
- Civics
- —
Market trends
- HPI YoY
- ▼ -61.20%
- Current HPI
- 102.6962
- Rent YoY
- —
- Metro
- —
- State GDP YoY
- ▲ 1.59%
- F500 in state
- 60
Industry mix (Fortune 500 HQ in IL)
| Industry | F500 HQs | Revenue |
|---|---|---|
| Insurance | 4 | $201B |
|
||
| Consumer Goods | 4 | $87B |
|
||
| Industrial Machinery | 3 | $64B |
|
||
| Healthcare | 2 | $55B |
|
||
| Retail / Pharmacy | 1 | $148B |
|
||
| Agriculture / Food | 1 | $86B |
|
||
Price history
1 event — show timeline
- 2026-03-04 Listed $7,500 MRED as Distributed by MLS Grid
Property tax history
-1.2%/yrLatest (2024): $210 · -9.4% YoY. Source: county tax records.
Cash-flow waterfall
monthlySold comps — $/sqft
last 12 mo · ≤1 miLoading sold comps…