 Fourplex
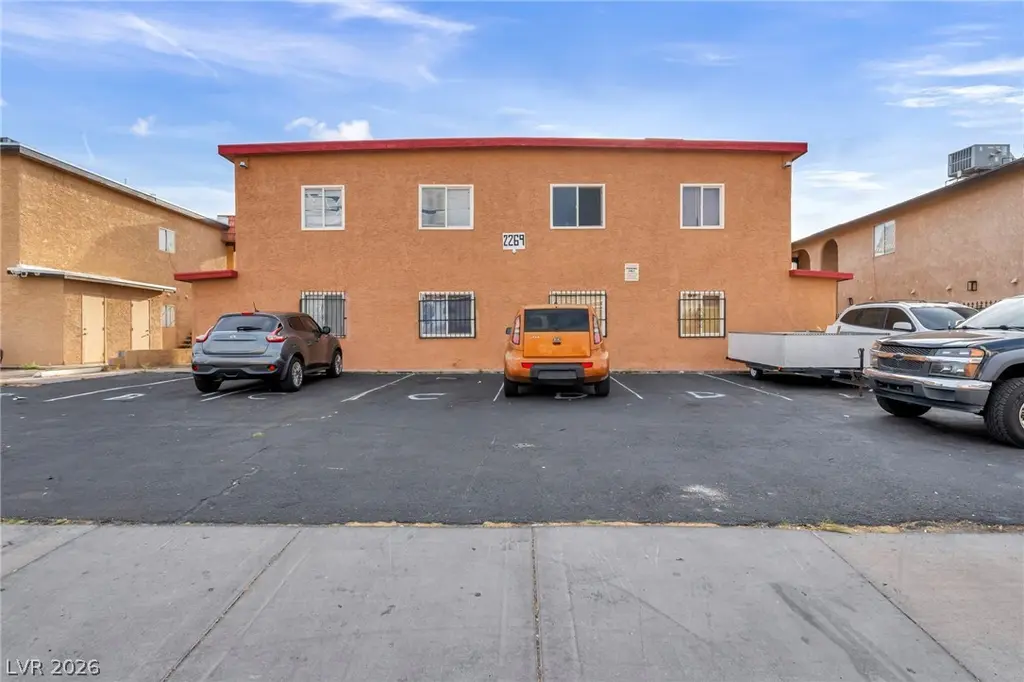
2269 Exeter Dr · Sunrise Manor, NV
Flood risk 1/10 · Minimal
- FEMA flood zone
- X (unshaded)
- Chance of flooding over 30 yrs
- 0.0%
- Est. flood insurance / yr
- $507 – $1,088
Fire risk 4/10 · Minor
- Est. fire insurance / yr
- $490 – $910
Heat risk 8/10 · Major
- Hot days now (above 106°F)
- 5 days/yr
- Hot days in 30 yrs
- 12 days/yr
Wind risk 1/10 · Minimal
- Chance of severe wind over 30 yrs
- —
Air-quality risk 3/10 · Minor
- Unhealthy air days now
- 2 days/yr
- Unhealthy air days in 30 yrs
- 3 days/yr
Risk factors via First Street. Map © Google.
Why this score? — see what drove the D grade
The composite is a weighted blend of 9 inputs, each scored 0–100. Each bar is that input's sub-score; the figure is the points it added to the 100-point composite (weight × sub-score).
- Cash flow +14.9/30.0
- ARV discount +7.5/15.0
- DSCR +4.5/10.0
- Livability +2.9/5.0
- 1% rule +2.8/10.0
- Rent growth +2.7/5.0
- Schools +2.6/10.0
- Condition / age +2.5/5.0
- Appreciation +0.0/10.0
$655,900
🖨 Deal sheet 📄 Offer letter ✓ Due diligence
Multi-family units
County records classify this as Multi-Family (2-4 Unit). Listing-text estimate: 4 units. confirmed
Listing remarks MLS
Excellent investment opportunity! All four units are currently rented, providing immediate income. Each unit features a 2-bedroom, 2-bath layout with its own full-size laundry room adding convenience for tenants. The property boasts a freshly repaved parking lot. City views! Ideal for investors seeking stable cash flow or buyers looking to combine homeownership with income potential.
Key facts
- City views
- 6,970 sq ft lot
- Built 1983
Tags
Neighborhood map
What this means for you Summary
Snapshot
- This is a 4 × 2-bed/2.0-bath units multifamily listed at $656k.
Deal economics
- At list price, monthly cash flow is $186 ($2k/yr) — positive. Per door: $47/mo.
- The deal already cash-flows at list — no discount required.
- To meet the 1% rule (rent ≥ 1% of price), the offer needs to be $513k (21.8% below list).
- Recommended offer: $513k (21.8% below list) — sets the bar for 1% rule.
Location & tenants
- Location reads 58/100 on livability (#83 in NV) — a working-class tenant base; expect higher turnover. Strengths: cost of living A+, housing A+; Watch: employment D, schools F, crime F.
- Clark County School District (urban): math 21% / reading 39% proficiency, ranked #11 of 17 in NV (top 65%) — families likely to look elsewhere, expect single-tenant / working-renter base with shorter leases.
- Market conditions: Rents flat; 159 active listings in the ZIP; 14,754 units permitted in Clark County in 2024 (2,301 in 5+ unit buildings).
- At $5,132/mo this rent would consume 88% of the median local household income ($70k/yr) (locally 895% of renters already pay >50% of income on rent) — very limited rent-growth headroom before tenants either downsize or default.
Forward outlook
- Local home prices are declining (-3.0%/yr); year-one equity from $5k of loan paydown is wiped out by about $20k of value loss. Plan a longer hold.
- Clark County population projected at +36% by 2050 — long-run rental-demand tailwind backs the buy-and-hold thesis.
Negotiation context
- It's been on market 160 days — a 12% lower offer ($577k) is reasonable based on typical stale-listing flexibility.
- 5 sale attempts since 9y ago with the ask held roughly flat each time — persistent listings suggest the price (not the market) is what's stuck; bring a comps-based counter.
- Current owner paid $175k; list at $656k implies a 275% gain — meaningful room to come down on a strong offer.
Risks & watch-outs
- Climate carrying-cost: extreme-heat days projected 5→12/yr by 2055 (HVAC capex compounding) — expect insurance premiums to compound above CPI over the hold.
Questions for the listing agent
- It's been on market 160 days. Have you received any prior offers? Is the seller open to a 22% concession, seller financing, or rate buy-down credit?
- Can we see the unit-by-unit rent roll, current vacancy, and any below-market leases? What's the average tenancy length?
- What capital expenditures (roof, boiler, parking lot, exteriors) have been made in the last 5 years, and what's planned in the next 2?
- Why hasn't it sold? Are there any deal-killer items the seller is aware of (foundation, flood, title, zoning, code violations)?
- Is there a deadline driving the sale (1031 exchange, divorce, estate, relocation)? That informs how much negotiation room exists.
- Schools are F-rated, which usually means shorter tenancies and higher turnover. Who's the typical renter profile here, and what's been the actual vacancy rate?
- Crime grade is F in this area — have there been break-ins, vandalism, or insurance claims at this property in the last 3 years? What carrier currently insures it and at what premium?
- The area grade is low — what's the realistic commute time and amenity access for the typical tenant pool here? Any planned neighborhood developments (good or bad) we should know about?
- What's the average days-on-market for RENTAL listings here right now (not sales)? A rising rental-DOM trend means longer vacancies and softer asking-rent achievability than the comps imply.
- What's the recent tenant-quality profile in this submarket — average credit score on applications, eviction rate, late-payment / NSF rate, and stable-employment percentage? A property-management company in the area should have these aggregated.
- How much new apartment / multifamily construction is in the pipeline within 1–3 miles? Heavy new supply (>2% of stock underway) typically softens rents 12–24 months out; light construction supports rent growth.
Investment metrics
- 1% rule
- 0.78% ✗
- Cap rate
- 6.63%
- Cash-on-cash
- 1.22%
- DSCR
- 1.05
- GRM
- 10.7
CMA / ARV
No comps found within radius.
Projected returns pro-forma
-3.0% appreciation · 0.87% rent growth · sell at horizon
- IRR
- -16.5%
- Equity multiple
- 0.43×
- Total profit
- $-105,518
- Equity at exit
- $97,797
- IRR
- -12.0%
- Equity multiple
- 0.34×
- Total profit
- $-120,293
- Equity at exit
- $56,710
Cash invested: $183,652 (down + closing). Projections, not guarantees.
Landlord ↔ Tenant lean methodology
- Overall (STATE)
- 71 Landlord-Friendly
- State Nevada
- 71 Landlord-Friendly · R+1
- County
- — inherits STATE
- City
- — inherits STATE
ZIP-level market 89156
- Home prices YoY
- -18.2%
- Rents YoY
- 0.9%
- Active inventory
- 159
- Price-to-rent
- 42.6×
Monthly cashflow live
- Estimated rent
- $5,132 high interval (Pro) →
- Mortgage (P&I)
- −$3,440
- Tax from tax record
- −$155 /mo · $1,861/yr
- Insurance
- −$273
- HOA
- −$0
- Vacancy / Maint / Mgmt
- −$1,078
- Net cashflow
- $186
Break-even live
4-unit breakdown (identical units grouped — click to expand)
| Units | Beds | Baths | Est. rent |
|---|---|---|---|
| 4× units | 2 | 2 | $5,132 |
| #1 | 2 | 2 | $1,283 |
| #2 | 2 | 2 | $1,283 |
| #3 | 2 | 2 | $1,283 |
| #4 | 2 | 2 | $1,283 |
| Total (4 units) | $5,132 | ||
UW: 25.0% down · 7.5% · 30yr · 1.5% tax · 5.0% vac · 8.0% maint · 8.0% mgmt
Financing live
Cash to close
- Down payment
- $163,975
- Closing costs
- $19,677
- Reserves months
- —
- Total cash needed
- —
Loan-product check · same deal, 3 products live
Conventional
25% down · 7.5% · 30yr
- Down + closing
- —
- Monthly P&I
- —
- Monthly cashflow
- —
- DSCR
- —
- Eligible?
- —
Personal DTI + credit; lowest rate.
DSCR
20% down · 8.5% · 30yr
- Down + closing
- —
- Monthly P&I
- —
- Monthly cashflow
- —
- DSCR
- —
- Eligible?
- —
No personal income docs; deal must DSCR.
Hard money
10% down · 12.0% · 12mo
- Down + closing
- —
- Monthly P&I
- —
- Monthly cashflow
- —
- DSCR
- —
- Eligible?
- —
Short-term bridge; refi at stabilization.
Listing history 39 events
-
2026-06-19price $655,900 Active 160 DOM
-
2026-06-18days on market $665,900 Active 160 DOM
-
2026-06-17days on market $665,900 Active 159 DOM
-
2026-06-16days on market $665,900 Active 158 DOM
-
2026-06-15days on market $665,900 Active 157 DOM
-
2026-06-13days on market $665,900 Active 155 DOM
-
2026-06-09days on market $665,900 Active 151 DOM
-
2026-06-08days on market $665,900 Active 150 DOM
-
2026-06-08pricedays on market $665,900 Active 149 DOM
-
2026-06-03days on market $669,900 Active 145 DOM
-
2026-06-02days on market $669,900 Active 144 DOM
-
2026-06-01days on market $669,900 Active 143 DOM
-
2026-05-31days on market $669,900 Active 142 DOM
-
2026-05-13price $669,900 386-char remark
Show marketing remark (386 chars)
Excellent investment opportunity! All four units are currently rented, providing immediate income. Each unit features a 2-bedroom, 2-bath layout with its own full-size laundry room adding convenience for tenants. The property boasts a freshly repaved parking lot. City views! Ideal for investors seeking stable cash flow or buyers looking to combine homeownership with income potential.
-
2026-04-23price $675,900 386-char remark
Show marketing remark (386 chars)
Excellent investment opportunity! All four units are currently rented, providing immediate income. Each unit features a 2-bedroom, 2-bath layout with its own full-size laundry room adding convenience for tenants. The property boasts a freshly repaved parking lot. City views! Ideal for investors seeking stable cash flow or buyers looking to combine homeownership with income potential.
-
2026-03-11price $679,900 386-char remark
Show marketing remark (386 chars)
Excellent investment opportunity! All four units are currently rented, providing immediate income. Each unit features a 2-bedroom, 2-bath layout with its own full-size laundry room adding convenience for tenants. The property boasts a freshly repaved parking lot. City views! Ideal for investors seeking stable cash flow or buyers looking to combine homeownership with income potential.
-
2026-02-13price $684,900 386-char remark
Show marketing remark (386 chars)
Excellent investment opportunity! All four units are currently rented, providing immediate income. Each unit features a 2-bedroom, 2-bath layout with its own full-size laundry room adding convenience for tenants. The property boasts a freshly repaved parking lot. City views! Ideal for investors seeking stable cash flow or buyers looking to combine homeownership with income potential.
-
2026-01-29price $687,900 386-char remark
Show marketing remark (386 chars)
Excellent investment opportunity! All four units are currently rented, providing immediate income. Each unit features a 2-bedroom, 2-bath layout with its own full-size laundry room adding convenience for tenants. The property boasts a freshly repaved parking lot. City views! Ideal for investors seeking stable cash flow or buyers looking to combine homeownership with income potential.
-
2026-01-09$689,900 Active 386-char remark
Show marketing remark (386 chars)
Excellent investment opportunity! All four units are currently rented, providing immediate income. Each unit features a 2-bedroom, 2-bath layout with its own full-size laundry room adding convenience for tenants. The property boasts a freshly repaved parking lot. City views! Ideal for investors seeking stable cash flow or buyers looking to combine homeownership with income potential.
-
2019-12-02historical
-
2019-05-31$449,000 Active
-
2017-07-27soldstatus $175,000 Sold
-
2017-07-27soldstatus $175,000
-
2017-07-11historical Contingent Offer
-
2017-06-29status Active
-
2017-06-27historical Contingent Offer
-
2017-06-23status Active
-
2017-06-23price $199,000
-
2017-06-20historical
-
2017-06-16$235,000 Active
-
2007-01-24soldstatus $419,000
-
2005-04-21soldstatus $315,000
-
2003-01-07soldstatus $242,000
-
1999-01-25soldstatus $181,000
-
1997-05-08soldstatus $175,000
-
1996-11-26soldstatus $175,000
-
1994-09-30soldstatus $168,000
-
1990-04-30soldstatus $56,000
-
1987-09-18soldstatus $135,000
ⓘ Source: listings_history table (triggers on properties + properties_extension) + one-shot
backfill from property_details.listing_events for pre-trigger history.
Tax reassessment forecast NV · Resets to sale price
- Current annual tax
- $1,861 · $155/mo
- Projected year-2 tax
- $3,870 · $322/mo
- Expected delta
- +$2,009/yr (+$167/mo · 108.0%)
ⓘ Screening estimate from a state-policy table — verify with the county assessor before closing.
Climate risk First Street
- Flood 1/10 Low FEMA zone X (unshaded) · 0% chance over 30 yrs
- Wildfire 4/10 Moderate
- Heat 8/10 Severe 5 d/yr ≥106°F today · 12 d/yr by 30 yrs out
- Wind 1/10 Low
- Air quality 3/10 Moderate 2 unhealthy d/yr today · 3 by 30 yrs out
Nearby sold comps map
Loading sold comps map…
Walkable amenities ~0.75 mi
Loading nearby amenities…
Taxation est. · year 1
- Rental income
- $61,584
- − Mortgage interest
- −$36,741
- − Property taxes
- −$1,861
- − Insurance
- −$3,280
- − Repairs & maintenance
- −$4,927
- − Management
- −$4,927
- − Depreciation
- −$19,081
- Taxable loss
- −$9,231
- Est. tax savings @ 24.0%
- +$2,215
- After-tax cash flow
- $4,451/yr
For passive investors: Depreciation is non-cash, so a rental often shows a tax loss while cash-flowing — sheltering income. Rental losses are passive: they offset passive income freely, and up to $25,000/yr can offset ordinary (W-2) income if you actively participate and your MAGI is under $100k (phasing out to $0 by $150k); unused losses carry forward. On sale, claimed depreciation is recaptured at up to 25%, and gains may owe capital-gains tax (a 1031 exchange can defer both). Figures are a year-1 estimate at your 24.0% rate — not tax advice; consult a CPA.
Schools (NCES district)
- District
- Clark County School District
- NCES district ID
- 3200060
- Math proficiency
- 21% ▼ -13.00%
- Reading proficiency
- 39% ▼ -8.00%
- Median HH income
- $53,611
- Composite
- 26.48/100
- National rank
- #7211
- State rank
- #11 of 17 in NV
Livability — Sunrise Manor
- Score
- 58/100
- State rank
- #83
- US rank
- #20692
Category grades
Schools grade is shown separately in the Schools card above.
Census & demographics
- Census place
- Sunrise Manor, NV
- County
- Clark County · 2,306,105 people
- City population
- 102,557
- Metro
- Las Vegas-Henderson-Paradise, NV
- Population (ZIP)
- 30,052
- Household income
- $69,767
- Rent vs Own
- Severe rent burden
- 895.0
Population outlook (Clark County) Hauer SSP2
- Today (2025)
- 2,504,101 people
- By 2030
- 2,693,770 · +7.6%
- By 2040
- 3,061,208 · +22.2%
- By 2050
- 3,400,072 · +35.8%
- By 2075
- 4,139,522 · +65.3%
- By 2100
- 4,596,916 · +83.6%
Race, ethnicity, and origin ACS 2023
- Neighborhood character
- Diverse neighborhood (Simpson 0.64)
- Race & ethnicity
- Hispanic / Latino 53% White 26% Two or more races 21% Black 11% Asian 4% Native American 1%
- Hispanic origin (detail)
- Mexican 44%
- Common ancestry
- Romanian 1% Slovak 1% Russian 1%
- Foreign-born
- 22% · Canada
- Languages at home
- 57% English-only · Spanish 39% Other Asian/Pacific 1% Other Indo-European 1%
Political lean MEDSL · Clark
- 2024 margin
- Toss-up / Even · D 50.4% · R 47.8% · Other 1.7%
- 2008→2024 swing
- -16.5pp toward R · 2008: 19.1pp · 2024: 2.6pp
- All cycles
- 2024: D+2.6 2020: D+9.3 2016: D+10.7 2012: D+14.5 2008: D+19.1
Not yet ingested
- Civics
- —
Market trends
- HPI YoY
- ▼ -65.96%
- Current HPI
- 295.5254
- Rent YoY
- ▲ 0.87%
- Metro
- Las Vegas-Henderson-Paradise, NV
- State GDP YoY
- ▲ 3.08%
- F500 in state
- 6
Industry mix (Fortune 500 HQ in NV)
| Industry | F500 HQs | Revenue |
|---|---|---|
| Hotels / Casinos | 3 | $36B |
|
||
Price history
+396.2% since first listed26 events — show timeline
- 2026-05-13 Price Changed $669,900 GLVAR
- 2026-04-23 Price Changed $675,900 GLVAR
- 2026-03-11 Price Changed $679,900 GLVAR
- 2026-02-13 Price Changed $684,900 GLVAR
- 2026-01-29 Price Changed $687,900 GLVAR
- 2026-01-09 Listed $689,900 GLVAR
- 2019-12-02 Listing Removed — GLVAR
- 2019-05-31 Listed $449,000 GLVAR
- 2017-07-27 Sold (Public Records) $175,000 Public Records
- 2017-07-27 Sold (MLS) $175,000 GLVAR
- 2017-07-11 Contingent — GLVAR
- 2017-06-29 Relisted — GLVAR
- 2017-06-27 Contingent — GLVAR
- 2017-06-23 Relisted — GLVAR
- 2017-06-23 Price Changed $199,000 GLVAR
- 2017-06-20 Listing Removed — GLVAR
- 2017-06-16 Listed $235,000 GLVAR
- 2007-01-24 Sold (Public Records) $419,000 Public Records
- 2005-04-21 Sold (Public Records) $315,000 Public Records
- 2003-01-07 Sold (Public Records) $242,000 Public Records
- 1999-01-25 Sold (Public Records) $181,000 Public Records
- 1997-05-08 Sold (Public Records) $175,000 Public Records
- 1996-11-26 Sold (Public Records) $175,000 Public Records
- 1994-09-30 Sold (Public Records) $168,000 Public Records
- 1990-04-30 Sold (Public Records) $56,000 Public Records
- 1987-09-18 Sold (Public Records) $135,000 Public Records
Property tax history
-3.2%/yrLatest (2025): $1,861 · +7.8% YoY. Source: county tax records.
Cash-flow waterfall
monthlySold comps — $/sqft
last 12 mo · ≤1 miLoading sold comps…