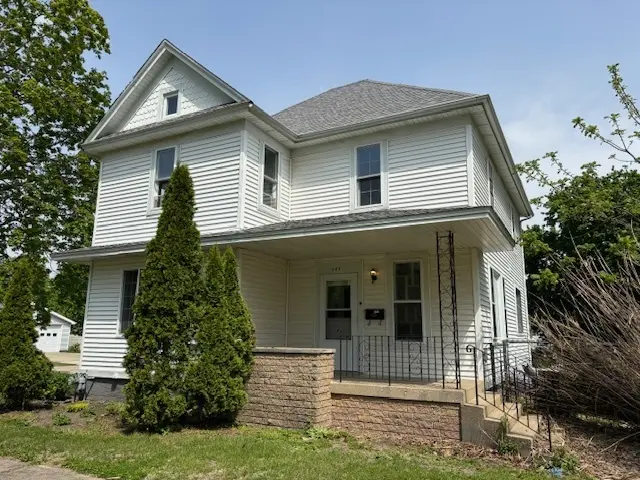
404 SE 1st St · Galva, IL
Flood risk 1/10 · Minimal
- FEMA flood zone
- X (unshaded)
- Chance of flooding over 30 yrs
- 0.0%
- Est. flood insurance / yr
- $473 – $860
Fire risk 1/10 · Minimal
- Est. fire insurance / yr
- $804 – $1,492
Heat risk 3/10 · Minor
- Hot days now (above 104°F)
- 7 days/yr
- Hot days in 30 yrs
- 17 days/yr
Wind risk 2/10 · Minimal
- Chance of severe wind over 30 yrs
- 0.0%
Air-quality risk 3/10 · Minor
- Unhealthy air days now
- 2 days/yr
- Unhealthy air days in 30 yrs
- 3 days/yr
Risk factors via First Street. Map © Google.
Why this score? — see what drove the C+ grade
The composite is a weighted blend of 9 inputs, each scored 0–100. Each bar is that input's sub-score; the figure is the points it added to the 100-point composite (weight × sub-score).
- Cash flow +20.8/30.0
- ARV discount +15.0/15.0
- DSCR +6.6/10.0
- Appreciation +5.8/10.0
- 1% rule +5.2/10.0
- Livability +3.4/5.0
- Rent growth +2.5/5.0
- Condition / age +2.5/5.0
- Schools +1.4/10.0
$119,000
🖨 Deal sheet (PDF) 📄 Offer letter ✓ Due diligence
Listing remarks
Split Personality- We have the home for both of you. A 4-bedroom, 2 1/2 bath home with a bedroom and bath on the main floor, plus 3-bedrooms on the second floor with a hallway bath. 2-car garage, kitchen dining and formal dining room. Spacious rooms large closets extra 1/2 bath in basement. All freshly painted and new laminated floors. The best of both worlds.
Key facts
- 0.26 acre lot
- Built 1911
- Listed 41 days
Property features AI
Finance
- HOA & community: No master association fee required
Exterior
- Utilities: Public water; Public sewer
- Home design: Detached single-family home; 2-story; Home is over 100 years old; Built before 1978
- Construction: Frame construction; Brick/mortar foundation; Asphalt roof
- Exterior features: Common grounds
Interior
- Kitchen: Kitchen with laminate flooring; Range; Dishwasher; Refrigerator
- Bedrooms: 4 bedrooms (Master on main; three additional bedrooms on second floor)
- Flooring: Laminate flooring in multiple main living areas and bedrooms; Carpet in one bedroom
- Bathrooms: 2 full bathrooms; 1 half bathroom; Basement includes a bathroom
- Heating & cooling: Natural gas heating; Central air conditioning
- Interior features: 7 total rooms; Unfinished, partial basement
- Laundry & utility: Laundry room in basement (5 x 6); Washer; Dryer
Neighborhood map
What this means for you Summary
Snapshot
- This is a 3-bed/1.0-bath single-family listed at $119k.
Deal economics
- At list price, monthly cash flow is $163 ($2k/yr) — positive.
- The deal already cash-flows at list — no discount required.
- Meets the 1% rule at list price ($1k rent vs $119k).
- Recommended offer: $115k (3.0% below list) — sets the bar for market timing.
Location & tenants
- Location reads 67/100 on livability (#497 in IL) — a middle-class / working-renter tenant base. Strengths: cost of living A+, crime A, housing A-; Watch: employment D+, schools F, amenities F.
- Galva CUSD 224 (rural): math 18% / reading 14% proficiency, ranked #497 of 620 in IL (top 80%) — low school quality limits family demand, transient renter base, plan for 1-2y turnover.
- Market conditions: 22 active listings in the ZIP; 32 units permitted in Henry County in 2024 (0 in 5+ unit buildings).
Forward outlook
- In year one you build about $3k of equity ($823 loan paydown + $2k appreciation (1.7% local appreciation)).
- Henry County population projected at -16% by 2050 — secular population decline; favor cash flow + early exit over multi-decade hold.
- At projected returns (1.7% appreciation + 3.0% rent growth), your $33k cash investment doubles in ~6 years — after that, you're playing with house money.
Negotiation context
- It's been on market 41 days — a 3% lower offer ($115k) is reasonable based on typical stale-listing flexibility.
Risks & watch-outs
- Watch-outs: built in 1911 — expect roof / HVAC / electrical / plumbing capex.
Questions for the listing agent
- It's been on market 41 days. Have you received any prior offers? Is the seller open to a 3% concession, seller financing, or rate buy-down credit?
- Built in 1911 — when were the roof, HVAC, electrical panel, plumbing, and water heater last replaced?
- Is there a deadline driving the sale (1031 exchange, divorce, estate, relocation)? That informs how much negotiation room exists.
- Schools are F-rated, which usually means shorter tenancies and higher turnover. Who's the typical renter profile here, and what's been the actual vacancy rate?
- What's the average days-on-market for RENTAL listings here right now (not sales)? A rising rental-DOM trend means longer vacancies and softer asking-rent achievability than the comps imply.
- What's the recent tenant-quality profile in this submarket — average credit score on applications, eviction rate, late-payment / NSF rate, and stable-employment percentage? A property-management company in the area should have these aggregated.
- How much new for-sale + rental construction is in the pipeline within 1–3 miles? Heavy new supply typically softens prices + rents 12–24 months out; constrained supply supports both.
Investment metrics
- 1% rule
- 1.02% ✓
- Cap rate
- 7.93%
- Cash-on-cash
- 5.86%
- DSCR
- 1.26
- GRM
- 8.2
CMA / ARV
- ARV (on-the-fly)
- $165,048
- Comps found
- 12
Show comp detail 12 sales within ~0.75 mi
| Address | Dist | Beds/Ba | Sqft | Sold | Price | $/sf | Match |
|---|---|---|---|---|---|---|---|
| 415 NE 1st St | 0.11mi | 3/2.0 | 1,645 (-8%) | 10mo | $45,000 | $27 | 69 |
| 417 NE 2nd Ave | 0.39mi | 3/1.0 | 1,704 (-5%) | 6mo | $77,000 | $45 | 69 |
| 103 SE 2nd Ave | 0.13mi | 3/2.0 | 1,632 (-9%) | 9mo | $89,900 | $55 | 67 |
| 416 NW 1st Ave | 0.51mi | 3/2.5 | 1,780 (-1%) | 6mo | $232,500 | $131 | 64 |
| 222 SE 5th St | 0.13mi | 3/2.0 | 1,596 (-11%) | 11mo | $189,900 | $119 | 63 |
| 222 SE 5th St | 0.13mi | 3/2.0 | 1,596 (-11%) | 11mo | $189,900 | $119 | 63 |
| 103 SW 4th St | 0.42mi | 4/1.0 (+1) | 1,624 (-10%) | 1mo | $29,000 | $18 | 59 |
| 717 NE 2nd St | 0.28mi | 4/2.0 (+1) | 1,624 (-10%) | 11mo | $150,000 | $92 | 53 |
| 502 NE 1st St | 0.15mi | 4/2.0 (+1) | 1,986 (+11%) | 18mo | $134,900 | $68 | 52 |
| 219 SW 4th St | 0.51mi | 3/2.0 | 1,960 (+9%) | 11mo | $67,000 | $34 | 47 |
| 19 SW 6th St | 0.48mi | 4/2.0 (+1) | 1,971 (+10%) | 12mo | $230,000 | $117 | 42 |
| 925 N Center Ave | 0.70mi | 4/3.0 (+1) | 1,908 (+6%) | 9mo | $294,000 | $154 | 36 |
Match score weights: distance 35% · size 25% · config 20% · recency 20%. Top-matched comps best support the ARV.
Projected returns pro-forma
1.67% appreciation · 3.0% rent growth · sell at horizon
- IRR
- 9.4%
- Equity multiple
- 1.50×
- Total profit
- $16,508
- Equity at exit
- $44,801
- IRR
- 12.7%
- Equity multiple
- 2.65×
- Total profit
- $55,037
- Equity at exit
- $62,912
Cash invested: $33,320 (down + closing). Projections, not guarantees.
Landlord ↔ Tenant lean methodology
- Overall (STATE)
- 43 Moderately Tenant-Leaning
- State Illinois
- 43 Moderately Tenant-Leaning · D+7
- County
- — inherits STATE
- City
- — inherits STATE
ZIP-level market 61434
- Home prices YoY
- 1.2%
- Active inventory
- 22
- Price-to-rent
- 8.2×
Monthly cashflow live
- Estimated rent
- $1,214 medium interval (Pro) →
- Mortgage (P&I)
- −$624
- Tax from tax record
- −$123 /mo · $1,478/yr
- Insurance
- −$50
- HOA
- −$0
- Vacancy / Maint / Mgmt
- −$255
- Net cashflow
- $163
Break-even live
Sensitivity live
| Price | -10% $230 | -5% $196 | +0% $163 | +5% $129 | +10% $95 |
|---|---|---|---|---|---|
| Rent | -10% $67 | -5% $115 | +0% $163 | +5% $211 | +10% $259 |
| Rate | -1.0pp $223 | -0.5pp $193 | base $163 | +0.5pp $132 | +1.0pp $100 |
UW: 25.0% down · 7.5% · 30yr · 1.5% tax · 5.0% vac · 8.0% maint · 8.0% mgmt
Financing live
Cash to close
- Down payment
- $29,750
- Closing costs
- $3,570
- Reserves months
- —
- Total cash needed
- —
Loan-product check · same deal, 3 products live
Conventional
25% down · 7.5% · 30yr
- Down + closing
- —
- Monthly P&I
- —
- Monthly cashflow
- —
- DSCR
- —
- Eligible?
- —
Personal DTI + credit; lowest rate.
DSCR
20% down · 8.5% · 30yr
- Down + closing
- —
- Monthly P&I
- —
- Monthly cashflow
- —
- DSCR
- —
- Eligible?
- —
No personal income docs; deal must DSCR.
Hard money
10% down · 12.0% · 12mo
- Down + closing
- —
- Monthly P&I
- —
- Monthly cashflow
- —
- DSCR
- —
- Eligible?
- —
Short-term bridge; refi at stabilization.
Listing history 11 events
-
2026-06-12statusdays on market $119,000 Pending 41 DOM
-
2026-06-09days on market $119,000 Contingent - Continue to Show 39 DOM
-
2026-06-08days on market $119,000 Contingent - Continue to Show 38 DOM
-
2026-06-07days on market $119,000 Contingent - Continue to Show 37 DOM
-
2026-06-05days on market $119,000 Contingent - Continue to Show 35 DOM
-
2026-06-04days on market $119,000 Contingent - Continue to Show 33 DOM
-
2026-06-03status $119,000 Contingent - Continue to Show 32 DOM
-
2026-06-02days on market $119,000 Active 32 DOM
-
2026-06-01days on market $119,000 Active 31 DOM
-
2026-05-31days on market $119,000 Active 30 DOM
-
2026-05-31days on market $119,000 Active 29 DOM
ⓘ Source: listings_history table (triggers on properties + properties_extension) + one-shot
backfill from property_details.listing_events for pre-trigger history.
Tax reassessment forecast IL · Partial reset (capped growth)
- Current annual tax
- $1,478 · $123/mo
- Projected year-2 tax
- $2,090 · $174/mo
- Expected delta
- +$612/yr (+$51/mo · 41.4%)
ⓘ Screening estimate from a state-policy table — verify with the county assessor before closing.
Climate risk First Street
- Flood 1/10 Low FEMA zone X (unshaded) · 0% chance over 30 yrs
- Wildfire 1/10 Low
- Heat 3/10 Moderate 7 d/yr ≥104°F today · 17 d/yr by 30 yrs out
- Wind 2/10 Low 0% chance of damaging wind over 30 yrs
- Air quality 3/10 Moderate 2 unhealthy d/yr today · 3 by 30 yrs out
Nearby sold comps map
Loading sold comps map…
Walkable amenities ~0.75 mi
Loading nearby amenities…
Taxation est. · year 1
- Rental income
- $14,573
- − Mortgage interest
- −$6,666
- − Property taxes
- −$1,478
- − Insurance
- −$595
- − Repairs & maintenance
- −$1,166
- − Management
- −$1,166
- − Depreciation
- −$3,462
- Taxable income
- $40
- Est. tax owed @ 24.0%
- −$10
- After-tax cash flow
- $1,941/yr
For passive investors: Depreciation is non-cash, so a rental often shows a tax loss while cash-flowing — sheltering income. Rental losses are passive: they offset passive income freely, and up to $25,000/yr can offset ordinary (W-2) income if you actively participate and your MAGI is under $100k (phasing out to $0 by $150k); unused losses carry forward. On sale, claimed depreciation is recaptured at up to 25%, and gains may owe capital-gains tax (a 1031 exchange can defer both). Figures are a year-1 estimate at your 24.0% rate — not tax advice; consult a CPA.
Schools (NCES district)
- District
- Galva CUSD 224
- NCES district ID
- 1716140
- Math proficiency
- 18% ▼ -9.00%
- Reading proficiency
- 14% ▼ -15.00%
- Median HH income
- $44,393
- Composite
- 14.08/100
- National rank
- #9463
- State rank
- #497 of 620 in IL
Livability — Galva
- Score
- 67/100
- State rank
- #497
- US rank
- #10271
Category grades
Schools grade is shown separately in the Schools card above.
Census & demographics
- Census place
- Galva, IL
- City population
- 2,992
- Population (ZIP)
- 2,992
Population outlook (Henry County) Hauer SSP2
- Today (2025)
- 47,376 people
- By 2030
- 45,920 · -3.1%
- By 2040
- 42,829 · -9.6%
- By 2050
- 39,606 · -16.4%
- By 2075
- 31,848 · -32.8%
- By 2100
- 23,503 · -50.4%
Race, ethnicity, and origin ACS 2023
- Neighborhood character
- Predominantly White (90%)
- Race & ethnicity
- White 90% Two or more races 7% Hispanic / Latino 5%
- Common ancestry
- English 6% Slovak 4% Lithuanian 3%
- Foreign-born
- 1%
- Languages at home
- 97% English-only · Spanish 1% Other Indo-European 1%
Political lean MEDSL · Henry
- 2024 margin
- Strong R (+24.5) · D 36.8% · R 61.3% · Other 1.9%
- 2008→2024 swing
- -32.2pp toward R · 2008: 7.7pp · 2024: -24.5pp
- All cycles
- 2024: R+24.5 2020: R+21.4 2016: R+21.2 2012: D+3.1 2008: D+7.7
Not yet ingested
- Civics
- —
Market trends
- HPI YoY
- ▲ 1.67%
- Current HPI
- 141.1529
- Rent YoY
- —
- Metro
- —
- State GDP YoY
- ▲ 1.59%
- F500 in state
- 60
Industry mix (Fortune 500 HQ in IL)
| Industry | F500 HQs | Revenue |
|---|---|---|
| Insurance | 4 | $201B |
|
||
| Consumer Goods | 4 | $87B |
|
||
| Industrial Machinery | 3 | $64B |
|
||
| Healthcare | 2 | $55B |
|
||
| Retail / Pharmacy | 1 | $148B |
|
||
| Agriculture / Food | 1 | $86B |
|
||
Property tax history
+3.3%/yrLatest (2024): $1,478 · +3.5% YoY. Source: county tax records.
Cash-flow waterfall
monthlySold comps — $/sqft
last 12 mo · ≤1 miLoading sold comps…