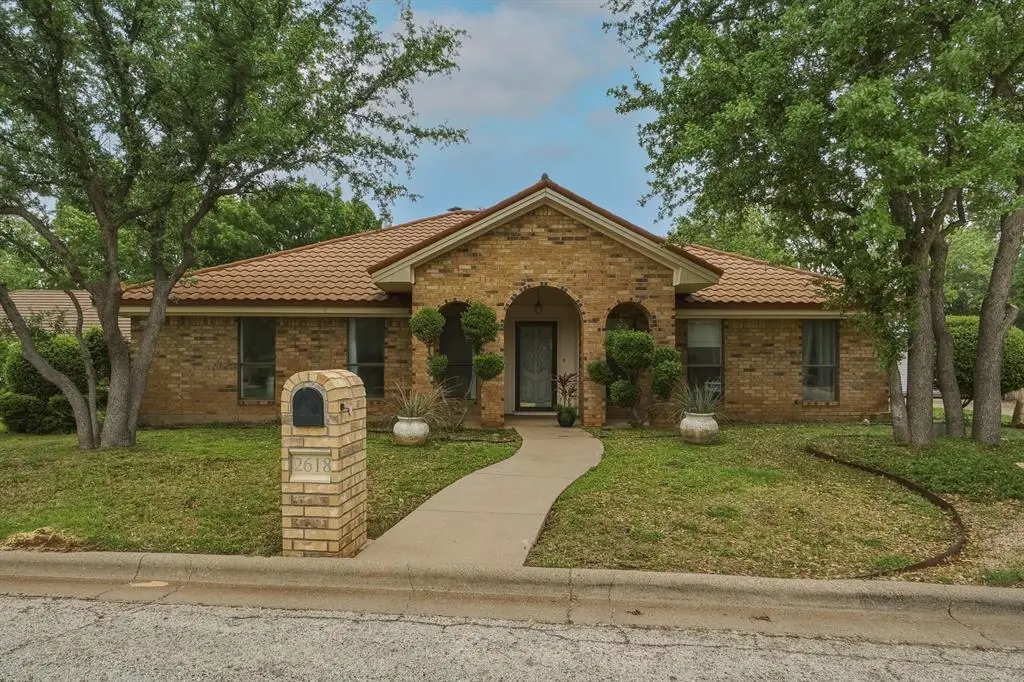
2618 Woodlake Dr · Abilene, TX
Flood risk 1/10 · Minimal
- FEMA flood zone
- X (unshaded)
- Chance of flooding over 30 yrs
- 0.0%
- Est. flood insurance / yr
- $507 – $1,088
Fire risk 8/10 · Major
- Est. fire insurance / yr
- $1,222 – $2,270
Heat risk 6/10 · Moderate
- Hot days now (above 103°F)
- 7 days/yr
- Hot days in 30 yrs
- 23 days/yr
Wind risk 4/10 · Minor
- Chance of severe wind over 30 yrs
- 13.0%
Air-quality risk 1/10 · Minimal
- Unhealthy air days now
- 0 days/yr
- Unhealthy air days in 30 yrs
- 0 days/yr
Risk factors via First Street. Map © Google.
Why this score? — see what drove the C- grade
The composite is a weighted blend of 9 inputs, each scored 0–100. Each bar is that input's sub-score; the figure is the points it added to the 100-point composite (weight × sub-score).
- Cash flow +17.4/30.0
- ARV discount +10.7/15.0
- DSCR +5.4/10.0
- Rent growth +5.0/5.0
- 1% rule +4.8/10.0
- Livability +3.8/5.0
- Schools +2.8/10.0
- Condition / age +2.5/5.0
- Appreciation +0.0/10.0
$369,900
🖨 Deal sheet 📄 Offer letter ✓ Due diligence
Listing remarks MLS
Nice brick home with swimming pool, side entry garage, extended drive for additional parking. Four bedrooms. Master bath offers separate tub and shower, walk in closet. Additional closet in entry to master bedroom. Half bath located by kitchen and garage giving convenient access from the pool. Built in hutch in breakfast nook. Formal dining area adjacent to entry. Sunken paneled living room with corner fireplace. Spacious kitchen with ample cabinetry. Large utility room. Bring your cosmetic ideas, carpeting has been removed!
Key facts
- Gas cooktop
- Vented hood
- Brick fireplace
Tags
Property features AI
Finance
- Other: Exclusion: Grey building on the side of the house
- Financial info: Accepts Cash, Conventional, FHA, VA loan
- HOA & community: No homeowners association
Exterior
- Parking: Driveway; Attached garage with 2 covered spaces
- Utilities: City water; City sewer; Not in a municipal utility district
- Home design: Single family residence; One story; Residential property; Subdivision: Woodlake
- Construction: Brick construction; Metal roof; Slab foundation; Built in 1981
- Exterior features: Back yard fencing (wood); Covered rear porch; In-ground outdoor pool
Interior
- Kitchen: Dishwasher; Gas cooktop; Gas oven
- Bedrooms: 4 bedrooms (primary bedroom on entry level)
- Flooring: Ceramic tile; Laminate
- Bathrooms: 3 total bathrooms (2 full, 1 half)
- Heating & cooling: Central air; Electric cooling; Ceiling fan(s); Natural gas heat
- Interior features: Built-in features; Cable TV available; One living area; Two dining areas; Living room on entry level
Neighborhood map
What this means for you Summary
Snapshot
- This is a 4-bed/2.5-bath single-family listed at $370k.
Deal economics
- At list price, monthly cash flow is $278 ($3k/yr) — positive.
- The deal already cash-flows at list — no discount required.
- To meet the 1% rule (rent ≥ 1% of price), the offer needs to be $364k (1.5% below list).
- Recommended offer: $359k (3.0% below list) — sets the bar for market timing.
Location & tenants
- Location reads 75/100 on livability (#142 in TX, #4,037 nationally) — a middle-class / working-renter tenant base. Strengths: cost of living A+, housing A+, health & safety A+; Watch: crime D, commute F.
- Abilene ISD (urban): math 32% / reading 34% proficiency, ranked #575 of 826 in TX (top 70%) — families likely to look elsewhere, expect single-tenant / working-renter base with shorter leases.
- Zoned schools: Ward El (math 38% / reading 40%, grade F, #1,651 of 4,322 statewide, top 39%, 494 students, 52% FRL).
- Market conditions: Rents rising fast (+40.7%/yr); 288 active listings in the ZIP; 8 comparable units currently listed for rent nearby; rentals at typical pace (median 21d on market — plan ~3-4 weeks tenant-placement turnaround); solid renter incomes; 508 units permitted in Taylor County in 2024 (0 in 5+ unit buildings).
- At $3,642/mo this rent would consume 55% of the median local household income ($79k/yr) (locally 1181% of renters already pay >50% of income on rent) — very limited rent-growth headroom before tenants either downsize or default.
Forward outlook
- Local home prices are declining (-3.0%/yr); year-one equity from $3k of loan paydown is wiped out by about $11k of value loss. Plan a longer hold.
- Taylor County population projected at +16% by 2050 — long-run rental-demand tailwind backs the buy-and-hold thesis.
- At projected returns (-3.0% appreciation + 8.0% rent growth), your $104k cash investment doubles in ~10 years — after that, you're playing with house money.
Negotiation context
- It's been on market 33 days — a 3% lower offer ($359k) is reasonable based on typical stale-listing flexibility.
- 6 sale attempts since 6y ago with the ask held roughly flat each time — persistent listings suggest the price (not the market) is what's stuck; bring a comps-based counter.
Risks & watch-outs
- Climate carrying-cost: severe wildfire risk; extreme-heat days projected 7→23/yr by 2055 (HVAC capex compounding) — expect insurance premiums to compound above CPI over the hold.
Questions for the listing agent
- It's been on market 33 days. Have you received any prior offers? Is the seller open to a 3% concession, seller financing, or rate buy-down credit?
- Is there a deadline driving the sale (1031 exchange, divorce, estate, relocation)? That informs how much negotiation room exists.
- Schools are D-rated, which usually means shorter tenancies and higher turnover. Who's the typical renter profile here, and what's been the actual vacancy rate?
- Crime grade is D in this area — have there been break-ins, vandalism, or insurance claims at this property in the last 3 years? What carrier currently insures it and at what premium?
- What's the average days-on-market for RENTAL listings here right now (not sales)? A rising rental-DOM trend means longer vacancies and softer asking-rent achievability than the comps imply.
- What's the recent tenant-quality profile in this submarket — average credit score on applications, eviction rate, late-payment / NSF rate, and stable-employment percentage? A property-management company in the area should have these aggregated.
- How much new for-sale + rental construction is in the pipeline within 1–3 miles? Heavy new supply typically softens prices + rents 12–24 months out; constrained supply supports both.
Investment metrics
- 1% rule
- 0.98% ✗
- Cap rate
- 7.20%
- Cash-on-cash
- 3.23%
- DSCR
- 1.14
- GRM
- 8.5
CMA / ARV
- ARV (on-the-fly)
- $398,300
- Comps found
- 12
Show comp detail 12 sales within ~0.75 mi
| Address | Dist | Beds/Ba | Sqft | Sold | Price | $/sf | Match |
|---|---|---|---|---|---|---|---|
| 5518 Chimney Rock Rd | 0.09mi | 4/4.0 | 2,436 (+7%) | 2mo | $319,900 | $131 | 76 |
| 2409 Lynbrook Dr | 0.38mi | 4/2.0 | 2,334 (+2%) | 2mo | $460,000 | $197 | 75 |
| 2549 Woodlake Dr | 0.06mi | 3/2.5 (-1) | 1,969 (-14%) | 2mo | $374,900 | $190 | 68 |
| 42 Riviera Cir | 0.24mi | 3/3.0 (-1) | 2,429 (+7%) | 5mo | $425,000 | $175 | 67 |
| 5057 Quail Ter | 0.43mi | 4/3.5 | 2,398 (+5%) | 1mo | $400,000 | $167 | 66 |
| 2558 Meadow Lake Dr | 0.17mi | 3/2.0 (-1) | 2,598 (+14%) | 2mo | $325,000 | $125 | 60 |
| 4624 Oak Knoll St | 0.68mi | 4/2.0 | 2,224 (-2%) | 5mo | $310,000 | $139 | 58 |
| 5810 Legacy Dr | 0.54mi | 4/2.0 | 2,032 (-11%) | 4mo | $397,000 | $195 | 52 |
| 37 Pinehurst St | 0.73mi | 4/2.0 | 2,433 (+7%) | 2mo | $375,000 | $154 | 51 |
| 33 Tamarisk Cir | 0.62mi | 3/2.0 (-1) | 2,427 (+7%) | 5mo | $420,000 | $173 | 49 |
| 3297 Woodlake Dr | 0.69mi | 4/2.0 | 2,035 (-11%) | 1mo | $359,900 | $177 | 48 |
| 9 Tamarisk Cir | 0.73mi | 3/2.5 (-1) | 2,139 (-6%) | 5mo | $385,000 | $180 | 47 |
Match score weights: distance 35% · size 25% · config 20% · recency 20%. Top-matched comps best support the ARV.
Projected returns pro-forma
-3.0% appreciation · 8.0% rent growth · sell at horizon
- IRR
- -5.6%
- Equity multiple
- 0.78×
- Total profit
- $-22,878
- Equity at exit
- $55,153
- IRR
- 9.3%
- Equity multiple
- 1.88×
- Total profit
- $90,841
- Equity at exit
- $31,982
Cash invested: $103,572 (down + closing). Projections, not guarantees.
Landlord ↔ Tenant lean methodology
- Overall (STATE)
- 87 Strongly Landlord-Friendly
- State Texas
- 87 Strongly Landlord-Friendly · R+5
- County
- — inherits STATE
- City
- — inherits STATE
ZIP-level market 79606
- Rents YoY
- 40.7%
- Active inventory
- 288
- Price-to-rent
- 8.5×
Monthly cashflow live
- Estimated rent
- $3,642 high interval (Pro) →
- Mortgage (P&I)
- −$1,940
- Tax from tax record
- −$505 /mo · $6,056/yr
- Insurance
- −$154
- HOA
- −$0
- Vacancy / Maint / Mgmt
- −$765
- Net cashflow
- $278
Break-even live
UW: 25.0% down · 7.5% · 30yr · 1.5% tax · 5.0% vac · 8.0% maint · 8.0% mgmt
Financing live
Cash to close
- Down payment
- $92,475
- Closing costs
- $11,097
- Reserves months
- —
- Total cash needed
- —
Loan-product check · same deal, 3 products live
Conventional
25% down · 7.5% · 30yr
- Down + closing
- —
- Monthly P&I
- —
- Monthly cashflow
- —
- DSCR
- —
- Eligible?
- —
Personal DTI + credit; lowest rate.
DSCR
20% down · 8.5% · 30yr
- Down + closing
- —
- Monthly P&I
- —
- Monthly cashflow
- —
- DSCR
- —
- Eligible?
- —
No personal income docs; deal must DSCR.
Hard money
10% down · 12.0% · 12mo
- Down + closing
- —
- Monthly P&I
- —
- Monthly cashflow
- —
- DSCR
- —
- Eligible?
- —
Short-term bridge; refi at stabilization.
Rent comps 8 comps
| Address | Beds | Baths | Sqft | Rent | $/sqft | DOM | Units | Dist |
|---|---|---|---|---|---|---|---|---|
| 5733 Legacy Dr Abilene, TX | 3.0 | 2.0 | 1843 | $5,000 | $2.71 | 4d | 1 | 0.52mi |
| 2418 Helena Cir Abilene, TX | 4.0 | 2.5 | 2478 | $3,700 | $1.49 | 10d | 1 | 0.69mi |
| 2510 Gilmer Ave Abilene, TX | 3.0 | 2.0 | 1974 | $2,995 | $1.52 | 43d | 1 | 0.76mi |
| 5400 Ridgeline Dr Abilene, TX | 3.0 | 2.0 | 2571 | $6,000 | $2.33 | 24d | 1 | 0.79mi |
| 3134 Winterhawk Dr Abilene, TX | 3.0 | 2.0 | 1800 | $2,795 | $1.55 | 7d | 1 | 0.83mi |
| 3826 Crest Way Abilene, TX | 3.0 | 2.0 | 1721 | $2,695 | $1.57 | 43d | 1 | 1.12mi |
| 4617 Catclaw Dr Abilene, TX | 4.0 | 2.0 | 2263 | $2,500 | $1.10 | 13d | 1 | 1.29mi |
| 6901 Glen Abbey St Abilene, TX | 4.0 | 2.0 | 1648 | $3,795 | $2.30 | 20d | 1 | 1.38mi |
Listing history 11 events
-
2026-06-19days on market $369,900 Active 33 DOM
-
2026-06-18days on market $369,900 Active 32 DOM
-
2026-06-17days on market $369,900 Active 31 DOM
-
2026-06-17status $369,900 Active 30 DOM
-
2026-06-15days on market $369,900 Active Option Contract 30 DOM
-
2026-06-14days on market $369,900 Active Option Contract 28 DOM
-
2026-06-13statusdays on market $369,900 Active Option Contract 27 DOM
-
2026-06-10days on market $369,900 Active 25 DOM
-
2026-06-09days on market $369,900 Active 24 DOM
-
2026-06-09remarks 687-char remark
-
2026-06-09$369,900 Active 23 DOM
ⓘ Source: listings_history table (triggers on properties + properties_extension) + one-shot
backfill from property_details.listing_events for pre-trigger history.
Tax reassessment forecast TX · Resets to sale price
- Current annual tax
- $6,056 · $505/mo
- Projected year-2 tax
- $6,769 · $564/mo
- Expected delta
- +$714/yr (+$59/mo · 11.8%)
ⓘ Screening estimate from a state-policy table — verify with the county assessor before closing.
Climate risk First Street
- Flood 1/10 Low FEMA zone X (unshaded) · 0% chance over 30 yrs
- Wildfire 8/10 Severe
- Heat 6/10 Major 7 d/yr ≥103°F today · 23 d/yr by 30 yrs out
- Wind 4/10 Moderate 13% chance of damaging wind over 30 yrs
- Air quality 1/10 Low 0 unhealthy d/yr today · 0 by 30 yrs out
Nearby sold comps map
Loading sold comps map…
Walkable amenities ~0.75 mi
Loading nearby amenities…
Taxation est. · year 1
- Rental income
- $43,701
- − Mortgage interest
- −$20,720
- − Property taxes
- −$6,056
- − Insurance
- −$1,850
- − Repairs & maintenance
- −$3,496
- − Management
- −$3,496
- − Depreciation
- −$10,761
- Taxable loss
- −$2,677
- Est. tax savings @ 24.0%
- +$642
- After-tax cash flow
- $3,984/yr
For passive investors: Depreciation is non-cash, so a rental often shows a tax loss while cash-flowing — sheltering income. Rental losses are passive: they offset passive income freely, and up to $25,000/yr can offset ordinary (W-2) income if you actively participate and your MAGI is under $100k (phasing out to $0 by $150k); unused losses carry forward. On sale, claimed depreciation is recaptured at up to 25%, and gains may owe capital-gains tax (a 1031 exchange can defer both). Figures are a year-1 estimate at your 24.0% rate — not tax advice; consult a CPA.
Schools (NCES district)
- District
- Abilene ISD
- NCES district ID
- 4807440
- Math proficiency
- 32% ▼ -11.00%
- Reading proficiency
- 34% ▼ -5.00%
- Median HH income
- $39,782
- Composite
- 27.71/100
- National rank
- #6909
- State rank
- #575 of 826 in TX
Livability — Abilene
- Score
- 75/100
- State rank
- #142
- US rank
- #4037
Category grades
Schools grade is shown separately in the Schools card above.
Census & demographics
- Census place
- Abilene, TX
- County
- Taylor County · 136,672 people
- City population
- 136,672
- Metro
- Abilene, TX
- Population (ZIP)
- 29,182
- Household income
- $79,196
- Rent vs Own
- Severe rent burden
- 1181.0
Population outlook (Taylor County) Hauer SSP2
- Today (2025)
- 145,270 people
- By 2030
- 150,050 · +3.3%
- By 2040
- 159,417 · +9.7%
- By 2050
- 168,883 · +16.3%
- By 2075
- 194,436 · +33.8%
- By 2100
- 203,163 · +39.9%
Race, ethnicity, and origin ACS 2023
- Neighborhood character
- Predominantly White (69%)
- Race & ethnicity
- White 69% Hispanic / Latino 19% Two or more races 11% Black 6% Asian 4%
- Hispanic origin (detail)
- Mexican 14%
- Common ancestry
- Italian 4% Slovak 2% Serbian 1%
- Foreign-born
- 7% · Canada, Vietnam
- Languages at home
- 86% English-only · Spanish 10% Tagalog/Filipino 1% Other Indo-European 1%
Political lean MEDSL · Taylor
- 2024 margin
- Solid R (+49.8) · D 24.6% · R 74.4% · Other 1.0%
- 2008→2024 swing
- -4.2pp toward R · 2008: -45.6pp · 2024: -49.8pp
- All cycles
- 2024: R+49.8 2020: R+45.3 2016: R+51.1 2012: R+53.6 2008: R+45.6
Not yet ingested
- Civics
- —
Market trends
- HPI YoY
- ▼ -167.33%
- Current HPI
- 179.2555
- Rent YoY
- ▲ 40.73%
- Metro
- Abilene, TX
- State GDP YoY
- ▲ 3.95%
- F500 in state
- 110
Industry mix (Fortune 500 HQ in TX)
| Industry | F500 HQs | Revenue |
|---|---|---|
| Energy | 16 | $1,198B |
|
||
| Technology | 5 | $198B |
|
||
| Engineering / Construction | 4 | $72B |
|
||
| Energy Services | 3 | $60B |
|
||
| Utilities | 3 | $41B |
|
||
| Healthcare | 2 | $330B |
|
||
Price history
+51.0% since first listed18 events — show timeline
- 2026-06-12 Contingent — NTREIS
- 2026-06-08 Relisted — NTREIS
- 2026-05-11 Contingent — NTREIS
- 2026-05-11 Relisted — NTREIS
- 2026-05-04 Relisted — NTREIS
- 2026-04-25 Contingent — NTREIS
- 2026-04-23 Relisted — NTREIS
- 2026-04-20 Contingent — NTREIS
- 2026-04-02 Listed $369,900 NTREIS
- 2021-10-06 Sold (Public Records) — Public Records
- 2021-02-08 Sold (Public Records) — Public Records
- 2021-02-05 Sold (MLS) — NTREIS
- 2021-01-14 Contingent — NTREIS
- 2021-01-08 Price Changed $239,500 NTREIS
- 2020-12-16 Listed $245,000 NTREIS
- 2013-10-23 Sold (Public Records) — Public Records
- 2005-09-19 Sold (Public Records) — Public Records
- 1998-08-06 Sold (Public Records) — Public Records
Property tax history
+2.5%/yrLatest (2025): $6,056 · -2.0% YoY. Source: county tax records.
Cash-flow waterfall
monthlySold comps — $/sqft
last 12 mo · ≤1 miLoading sold comps…