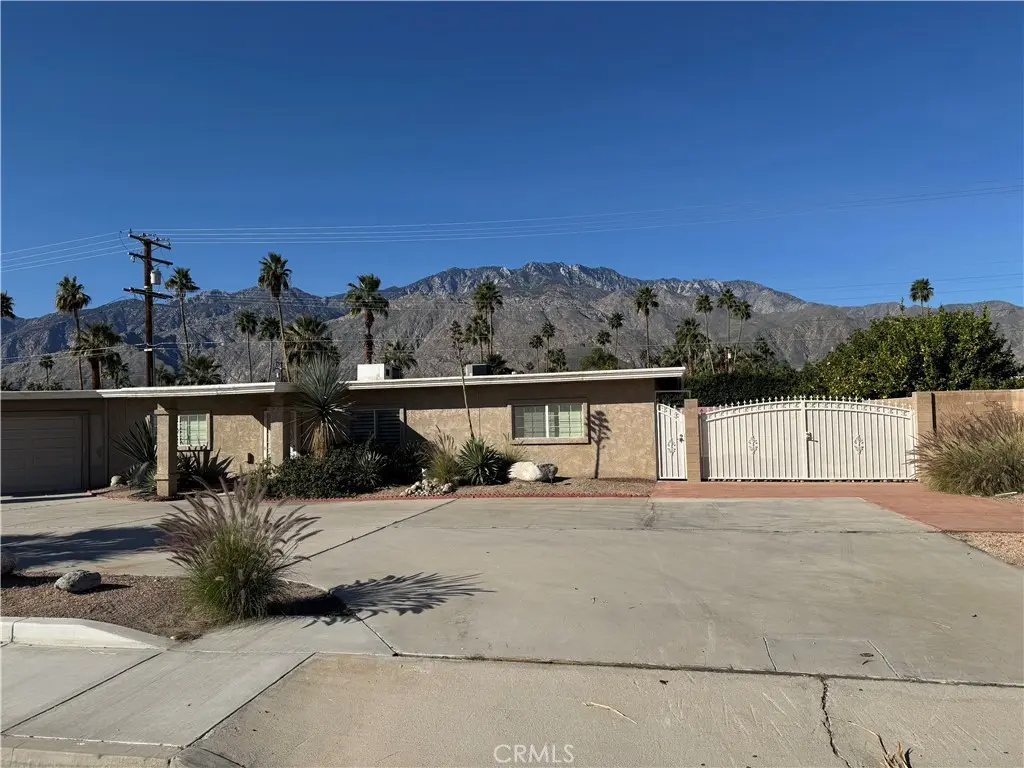
445 N Farrell · Palm Springs, CA
Flood risk 1/10 · Minimal
- FEMA flood zone
- X (unshaded)
- Chance of flooding over 30 yrs
- 0.0%
- Est. flood insurance / yr
- $507 – $1,088
Fire risk 1/10 · Minimal
- Est. fire insurance / yr
- $659 – $1,223
Heat risk 9/10 · Severe
- Hot days now (above 112°F)
- 7 days/yr
- Hot days in 30 yrs
- 21 days/yr
Wind risk 1/10 · Minimal
- Chance of severe wind over 30 yrs
- —
Air-quality risk 5/10 · Moderate
- Unhealthy air days now
- 6 days/yr
- Unhealthy air days in 30 yrs
- 8 days/yr
Risk factors via First Street. Map © Google.
Why this score? — see what drove the D grade
The composite is a weighted blend of 9 inputs, each scored 0–100. Each bar is that input's sub-score; the figure is the points it added to the 100-point composite (weight × sub-score).
- ARV discount +15.0/15.0
- Cash flow +9.7/30.0
- Livability +3.3/5.0
- DSCR +2.7/10.0
- Schools +2.7/10.0
- Rent growth +2.6/5.0
- Condition / age +2.5/5.0
- 1% rule +1.9/10.0
- Appreciation +0.0/10.0
$689,000
🖨 Deal sheet 📄 Offer letter ✓ Due diligence
Listing remarks MLS
BEAUTIFULLY REMODLED HOME ON LARGE LOT. POOL AND SPA WAS ADDED AROUND 2011, AS WELL AS GORGEOUS OUTDOOR GRILLING AREA. IT'S AN ENTERTAINER'S DREAM! GATED RV PARKING WAS ALSO ADDED. SOUGHT AFTER NEIGHBORHOOD. CENTRALLY LOCATED CLOSE TO DOWNTOWN PALM SPRINGS, CONVENTION CENTER AND CASINO. MUST SEE TO APPRECIATE!
Key facts
- 0.24 acre lot
- 2 garage spots
- Pool
Neighborhood map
What this means for you Summary
Snapshot
- This is a 4-bed/2.0-bath single-family listed at $689k.
Deal economics
- At list price, monthly cash flow is $-453 ($-5k/yr) — negative.
- To cash-flow at today's rent, offer at most $609k (11.6% below list).
- To meet the 1% rule (rent ≥ 1% of price), the offer needs to be $477k (30.8% below list).
- Recommended offer: $477k (30.8% below list) — sets the bar for 1% rule.
- Cap rate 5.5% vs local median 2.7% in Palm Springs — top-decile yield for the area; either an underpriced asset or a hidden risk that comps aren't pricing in. Stress-test before assuming the spread holds.
Location & tenants
- Location reads 66/100 on livability (#348 in CA) — a middle-class / working-renter tenant base. Strengths: amenities A+, commute A+; Watch: schools C-, crime F, cost of living F.
- Palm Springs Unified (suburban): math 21% / reading 42% proficiency, ranked #328 of 517 in CA (top 63%) — families likely to look elsewhere, expect single-tenant / working-renter base with shorter leases; 73% free/reduced lunch — lower-income household profile, screen leases tightly.
- Market conditions: Rents flat; 647 active listings in the ZIP; 30 comparable units currently listed for rent nearby; rentals at typical pace (median 25d on market — plan ~3-4 weeks tenant-placement turnaround); 47% of comp listings sitting > 30 days — soft ceiling on asking rent; 9,195 units permitted in Riverside County in 2024 (1,512 in 5+ unit buildings).
- At $4,768/mo this rent would consume 80% of the median local household income ($72k/yr) (locally 1866% of renters already pay >50% of income on rent) — very limited rent-growth headroom before tenants either downsize or default.
Forward outlook
- Local home prices are declining (-3.0%/yr); year-one equity from $5k of loan paydown is wiped out by about $21k of value loss. Plan a longer hold.
- Riverside County population projected at +22% by 2050 — long-run rental-demand tailwind backs the buy-and-hold thesis.
Negotiation context
- It's been on market 139 days — a 12% lower offer ($606k) is reasonable based on typical stale-listing flexibility.
- 5 sale attempts since 20y ago; this cycle's ask has dropped $89k (11%) from the opening price — seller is motivated, your offer sets the floor, not the list.
- Current owner paid $215k; list at $689k implies a 220% gain — meaningful room to come down on a strong offer.
Risks & watch-outs
- Watch-outs: built in 1959 — expect roof / HVAC / electrical / plumbing capex.
- Climate carrying-cost: extreme-heat days projected 7→21/yr by 2055 (HVAC capex compounding) — expect insurance premiums to compound above CPI over the hold.
Questions for the listing agent
- What do current leases actually rent for vs. the listed asking? Can we see a recent rent roll and the last 12 months of T-12 income?
- It's been on market 139 days. Have you received any prior offers? Is the seller open to a 31% concession, seller financing, or rate buy-down credit?
- Built in 1959 — when were the roof, HVAC, electrical panel, plumbing, and water heater last replaced?
- Why hasn't it sold? Are there any deal-killer items the seller is aware of (foundation, flood, title, zoning, code violations)?
- Is there a deadline driving the sale (1031 exchange, divorce, estate, relocation)? That informs how much negotiation room exists.
- Crime grade is F in this area — have there been break-ins, vandalism, or insurance claims at this property in the last 3 years? What carrier currently insures it and at what premium?
- The area grade is low — what's the realistic commute time and amenity access for the typical tenant pool here? Any planned neighborhood developments (good or bad) we should know about?
- What's the average days-on-market for RENTAL listings here right now (not sales)? A rising rental-DOM trend means longer vacancies and softer asking-rent achievability than the comps imply.
- What's the recent tenant-quality profile in this submarket — average credit score on applications, eviction rate, late-payment / NSF rate, and stable-employment percentage? A property-management company in the area should have these aggregated.
- How much new for-sale + rental construction is in the pipeline within 1–3 miles? Heavy new supply typically softens prices + rents 12–24 months out; constrained supply supports both.
Investment metrics
- 1% rule
- 0.69% ✗
- Cap rate
- 5.50%
- Cash-on-cash
- -2.82%
- DSCR
- 0.87
- GRM
- 12.0
CMA / ARV
- ARV (median comp)
- $1,000,476
- List price
- $689,000
- Delta
- -31.13%
- Verdict
- UNDERPRICED
- Comps
- 20 within 1.0 mi
Show comp detail 12 sales within ~0.75 mi
| Address | Dist | Beds/Ba | Sqft | Sold | Price | $/sf | Match |
|---|---|---|---|---|---|---|---|
| 503 N Farrell Dr | 0.10mi | 3/2.0 (-1) | 1,360 (-7%) | 8mo | $890,100 | $654 | 72 |
| 1820 E Park Dr | 0.45mi | 3/2.0 (-1) | 1,423 (-2%) | 0mo | $899,000 | $632 | 70 |
| 2250 Tamarisk | 0.40mi | 3/2.0 (-1) | 1,516 (+4%) | 1mo | $656,000 | $433 | 69 |
| 2015 E Belding Dr | 0.33mi | 3/2.0 (-1) | 1,375 (-6%) | 2mo | $1,075,000 | $782 | 68 |
| 545 N Chiquita Cir | 0.39mi | 3/2.0 (-1) | 1,541 (+6%) | 4mo | $1,045,000 | $678 | 64 |
| 2835 E Plaimor Ave | 0.29mi | 3/2.0 (-1) | 1,608 (+10%) | 2mo | $1,137,500 | $707 | 62 |
| 2271 E Calle Conejara | 0.31mi | 3/2.0 (-1) | 1,552 (+6%) | 10mo | $850,000 | $548 | 62 |
| 544 N Tercero Cir | 0.42mi | 3/2.0 (-1) | 1,541 (+6%) | 6mo | $1,095,000 | $711 | 61 |
| 2227 Paseo Roseta | 0.56mi | 3/2.0 (-1) | 1,375 (-6%) | 4mo | $1,225,000 | $891 | 56 |
| 2079 Paseo Roseta | 0.58mi | 3/2.0 (-1) | 1,375 (-6%) | 8mo | $900,000 | $655 | 52 |
| 2235 E Paseo Gracia | 0.62mi | 3/2.0 (-1) | 1,570 (+8%) | 2mo | $1,365,000 | $869 | 51 |
| 587 N Calle Marcus | 0.65mi | 3/2.0 (-1) | 1,284 (-12%) | 5mo | $1,035,000 | $806 | 41 |
Match score weights: distance 35% · size 25% · config 20% · recency 20%. Top-matched comps best support the ARV.
Projected returns pro-forma
-3.0% appreciation · 0.46% rent growth · sell at horizon
- IRR
- -23.6%
- Equity multiple
- 0.21×
- Total profit
- $-152,675
- Equity at exit
- $102,732
- IRR
- -26.0%
- Equity multiple
- -0.13×
- Total profit
- $-217,545
- Equity at exit
- $59,572
Cash invested: $192,920 (down + closing). Projections, not guarantees.
Landlord ↔ Tenant lean methodology
- Overall (STATE)
- 18 Strongly Tenant-Friendly
- State California
- 18 Strongly Tenant-Friendly · D+13
- County
- — inherits STATE
- City
- — inherits STATE
ZIP-level market 92262
- Rents YoY
- 0.5%
- Active inventory
- 647
- Price-to-rent
- 12.0×
Monthly cashflow live
- Estimated rent
- $4,768 high interval (Pro) →
- Mortgage (P&I)
- −$3,613
- Tax from tax record
- −$320 /mo · $3,842/yr
- Insurance
- −$287
- HOA
- −$0
- Vacancy / Maint / Mgmt
- −$1,001
- Net cashflow
- $-453
Break-even live
UW: 25.0% down · 7.5% · 30yr · 1.5% tax · 5.0% vac · 8.0% maint · 8.0% mgmt
Financing live
Cash to close
- Down payment
- $172,250
- Closing costs
- $20,670
- Reserves months
- —
- Total cash needed
- —
Loan-product check · same deal, 3 products live
Conventional
25% down · 7.5% · 30yr
- Down + closing
- —
- Monthly P&I
- —
- Monthly cashflow
- —
- DSCR
- —
- Eligible?
- —
Personal DTI + credit; lowest rate.
DSCR
20% down · 8.5% · 30yr
- Down + closing
- —
- Monthly P&I
- —
- Monthly cashflow
- —
- DSCR
- —
- Eligible?
- —
No personal income docs; deal must DSCR.
Hard money
10% down · 12.0% · 12mo
- Down + closing
- —
- Monthly P&I
- —
- Monthly cashflow
- —
- DSCR
- —
- Eligible?
- —
Short-term bridge; refi at stabilization.
Rent comps 30 comps
| Address | Beds | Baths | Sqft | Rent | $/sqft | DOM | Units | Dist |
|---|---|---|---|---|---|---|---|---|
| 280 N Monterey Rd Palm Springs, CA | 3.0 | 2.0 | 1278 | $4,100 | $3.21 | 44d | 1 | 0.19mi |
| 2450 Tamarisk Rd Palm Springs, CA | 4.0 | 2.0 | 1660 | $3,499 | $2.11 | 24d | 1 | 0.37mi |
| 2890 E Tahquitz Canyon Way Palm Springs, CA | 2.0–3.0 | 1.5–2.0 | 1127 | $2,725 | $2.42 | 2d | 18 | 0.47mi |
| 2007 E Andreas Rd Palm Springs, CA | 3.0 | 2.0 | 1593 | $3,800 | $2.39 | 44d | 1 | 0.47mi |
| 2056 Paseo Roseta Palm Springs, CA | 3.0 | 3.0 | 1730 | $9,900 | $5.72 | 44d | 1 | 0.55mi |
| 2056 Paseo Roseta Palm Springs, CA | 3.0 | 3.0 | 1730 | $9,900 | $5.72 | 15d | 1 | 0.55mi |
| 547 N Sunrise Way Palm Springs, CA | 4.0 | 2.0 | 1560 | $7,170 | $4.60 | 15d | 1 | 0.57mi |
| 547 N Sunrise Way Palm Springs, CA | 4.0 | 2.0 | 1560 | $7,170 | $4.60 | 44d | 1 | 0.57mi |
| 1020 N Cerritos Dr Palm Springs, CA | 3.0 | 2.0 | 1516 | $13,950 | $9.20 | 44d | 1 | 0.61mi |
| 1405 E Tachevah Dr Palm Springs, CA | 3.0 | 3.5 | 1332 | $5,999 | $4.50 | 24d | 1 | 0.86mi |
| 2240 Sunshine Way Palm Springs, CA | 3.0 | 2.0 | 1350 | $2,250 | $1.67 | 24d | 1 | 0.98mi |
| 1261 Linda Vista Rd Palm Springs, CA | 4.0 | 2.0 | 1740 | $7,000 | $4.02 | 12d | 1 | 1.01mi |
| 3370 E Avenida Fey Norte Palm Springs, CA | 3.0 | 2.0 | 1518 | $5,500 | $3.62 | 44d | 1 | 1.05mi |
| 1705 Scotia Ln Palm Springs, CA | 5.0 | 3.0 | 1800 | $3,950 | $2.19 | 8d | 1 | 1.11mi |
| 622 S Highland Dr Palm Springs, CA | 3.0 | 3.0 | 1523 | $6,000 | $3.94 | 44d | 1 | 1.22mi |
| 1889 N Los Alamos Rd Palm Springs, CA | 4.0 | 1.5 | 1714 | $3,900 | $2.28 | 18d | 1 | 1.26mi |
| 3663 E Paseo Barbara Palm Springs, CA | 3.0 | 2.0 | 1708 | $3,499 | $2.05 | 44d | 1 | 1.26mi |
| 1111 E Ramon Rd Palm Springs, CA | 2.0–3.0 | 2.0 | 1191 | $4,500 | $3.78 | 24d | 2 | 1.27mi |
| 1111 E Ramon Rd Palm Springs, CA | 2.0–3.0 | 2.0 | 1191 | $4,500 | $3.78 | 17d | 2 | 1.27mi |
| 900 E Saturnino Rd Palm Springs, CA | 1.0–3.0 | 1.0–2.0 | 1020 | $2,575 | $2.52 | 2d | 6 | 1.31mi |
| 2004 Nicola Rd E Palm Springs, CA | 4.0 | 2.0 | 1698 | $4,400 | $2.59 | 44d | 1 | 1.31mi |
| 1111 E Ramon Rd #87 Palm Springs, CA | 3.0 | 2.0 | 1313 | $4,500 | $3.43 | 17d | 1 | 1.40mi |
| 2200 Acacia Rd E Palm Springs, CA | 3.0 | 2.0 | 1597 | $5,800 | $3.63 | 20d | 1 | 1.40mi |
| 2200 Acacia Rd E Palm Springs, CA | 3.0 | 2.0 | 1597 | $5,800 | $3.63 | 44d | 1 | 1.40mi |
| 2241 N San Gorgonio Rd Palm Springs, CA | 4.0 | 2.0 | 1609 | $4,500 | $2.80 | 44d | 1 | 1.45mi |
| 2223 N Magnolia Rd Palm Springs, CA | 3.0 | 2.0 | 1472 | $3,600 | $2.45 | 24d | 1 | 1.46mi |
| 2240 N San Gorgonio Rd Palm Springs, CA | 3.0 | 2.0 | 1260 | $3,600 | $2.86 | 24d | 1 | 1.46mi |
| 2290 N Victoria Rd Palm Springs, CA | 3.0 | 3.0 | 1752 | $5,270 | $3.01 | 44d | 1 | 1.47mi |
| 2235 N Los Alamos Rd Palm Springs, CA | 3.0 | 2.0 | 1399 | $5,000 | $3.57 | 44d | 1 | 1.48mi |
| 1534 E Via Escuela Palm Springs, CA | 4.0 | 2.0 | 1717 | $4,800 | $2.80 | 44d | 1 | 1.50mi |
Listing history 49 events
-
2026-06-18days on market $689,000 Active 139 DOM
-
2026-06-17days on market $689,000 Active 138 DOM
-
2026-06-16days on market $689,000 Active 137 DOM
-
2026-06-15days on market $689,000 Active 136 DOM
-
2026-06-13days on market $689,000 Active 134 DOM
-
2026-06-13days on market $689,000 Active 133 DOM
-
2026-06-09days on market $689,000 Active 130 DOM
-
2026-06-08days on market $689,000 Active 129 DOM
-
2026-06-07days on market $689,000 Active 128 DOM
-
2026-06-04days on market $689,000 Active 125 DOM
-
2026-06-03days on market $689,000 Active 124 DOM
-
2026-06-02days on market $689,000 Active 123 DOM
-
2026-06-01days on market $689,000 Active 122 DOM
-
2026-05-31days on market $689,000 Active 121 DOM
-
2026-04-30price $689,000 311-char remark
Show marketing remark (311 chars)
BEAUTIFULLY REMODLED HOME ON LARGE LOT. POOL AND SPA WAS ADDED AROUND 2011, AS WELL AS GORGEOUS OUTDOOR GRILLING AREA. IT'S AN ENTERTAINER'S DREAM! GATED RV PARKING WAS ALSO ADDED. SOUGHT AFTER NEIGHBORHOOD. CENTRALLY LOCATED CLOSE TO DOWNTOWN PALM SPRINGS, CONVENTION CENTER AND CASINO. MUST SEE TO APPRECIATE!
-
2026-04-08price $729,000 311-char remark
Show marketing remark (311 chars)
BEAUTIFULLY REMODLED HOME ON LARGE LOT. POOL AND SPA WAS ADDED AROUND 2011, AS WELL AS GORGEOUS OUTDOOR GRILLING AREA. IT'S AN ENTERTAINER'S DREAM! GATED RV PARKING WAS ALSO ADDED. SOUGHT AFTER NEIGHBORHOOD. CENTRALLY LOCATED CLOSE TO DOWNTOWN PALM SPRINGS, CONVENTION CENTER AND CASINO. MUST SEE TO APPRECIATE!
-
2026-03-10price $755,000 311-char remark
Show marketing remark (311 chars)
BEAUTIFULLY REMODLED HOME ON LARGE LOT. POOL AND SPA WAS ADDED AROUND 2011, AS WELL AS GORGEOUS OUTDOOR GRILLING AREA. IT'S AN ENTERTAINER'S DREAM! GATED RV PARKING WAS ALSO ADDED. SOUGHT AFTER NEIGHBORHOOD. CENTRALLY LOCATED CLOSE TO DOWNTOWN PALM SPRINGS, CONVENTION CENTER AND CASINO. MUST SEE TO APPRECIATE!
-
2026-01-30$777,777 Active 311-char remark
Show marketing remark (311 chars)
BEAUTIFULLY REMODLED HOME ON LARGE LOT. POOL AND SPA WAS ADDED AROUND 2011, AS WELL AS GORGEOUS OUTDOOR GRILLING AREA. IT'S AN ENTERTAINER'S DREAM! GATED RV PARKING WAS ALSO ADDED. SOUGHT AFTER NEIGHBORHOOD. CENTRALLY LOCATED CLOSE TO DOWNTOWN PALM SPRINGS, CONVENTION CENTER AND CASINO. MUST SEE TO APPRECIATE!
-
2026-01-26historical $777,777 311-char remark
Show marketing remark (311 chars)
BEAUTIFULLY REMODLED HOME ON LARGE LOT. POOL AND SPA WAS ADDED AROUND 2011, AS WELL AS GORGEOUS OUTDOOR GRILLING AREA. IT'S AN ENTERTAINER'S DREAM! GATED RV PARKING WAS ALSO ADDED. SOUGHT AFTER NEIGHBORHOOD. CENTRALLY LOCATED CLOSE TO DOWNTOWN PALM SPRINGS, CONVENTION CENTER AND CASINO. MUST SEE TO APPRECIATE!
-
2008-03-26historical
-
2008-03-10soldstatus $215,000
-
2008-02-29soldstatus $215,000 Closed
-
2008-02-11historical
-
2008-02-08historical
-
2008-01-15price $239,000
-
2008-01-09price $239,000
-
2007-11-15price $289,000
-
2007-11-14price $289,000
-
2007-09-25price $319,000
-
2007-09-23price $319,000
-
2007-09-23price $319,000
-
2007-07-19price $337,000
-
2007-07-01price $350,000
-
2007-06-29price $350,000
-
2007-06-28price $350,000
-
2007-06-22price $369,000
-
2007-06-21price $369,000
-
2007-06-20price $379,000
-
2007-06-19price $399,000
-
2007-06-14price $379,000
-
2007-06-11price $379,000
-
2007-06-08$379,000
-
2007-06-05$399,000
-
2007-05-28$399,000
-
2006-07-02historical
-
2006-02-21$369,900
-
1998-06-12soldstatus $75,000
-
1988-10-25soldstatus $88,000
-
1988-10-25soldstatus $88,000
ⓘ Source: listings_history table (triggers on properties + properties_extension) + one-shot
backfill from property_details.listing_events for pre-trigger history.
Tax reassessment forecast CA · Resets to sale price
- Current annual tax
- $3,842 · $320/mo
- Projected year-2 tax
- $5,236 · $436/mo
- Expected delta
- +$1,395/yr (+$116/mo · 36.3%)
ⓘ Screening estimate from a state-policy table — verify with the county assessor before closing.
Climate risk First Street
- Flood 1/10 Low FEMA zone X (unshaded) · 0% chance over 30 yrs
- Wildfire 1/10 Low
- Heat 9/10 Extreme 7 d/yr ≥112°F today · 21 d/yr by 30 yrs out
- Wind 1/10 Low
- Air quality 5/10 Major 6 unhealthy d/yr today · 8 by 30 yrs out
Nearby sold comps map
Loading sold comps map…
Walkable amenities ~0.75 mi
Loading nearby amenities…
Taxation est. · year 1
- Rental income
- $57,219
- − Mortgage interest
- −$38,595
- − Property taxes
- −$3,842
- − Insurance
- −$3,445
- − Repairs & maintenance
- −$4,578
- − Management
- −$4,578
- − Depreciation
- −$20,044
- Taxable loss
- −$17,861
- Est. tax savings @ 24.0%
- +$4,287
- After-tax cash flow
- $-1,155/yr
For passive investors: Depreciation is non-cash, so a rental often shows a tax loss while cash-flowing — sheltering income. Rental losses are passive: they offset passive income freely, and up to $25,000/yr can offset ordinary (W-2) income if you actively participate and your MAGI is under $100k (phasing out to $0 by $150k); unused losses carry forward. On sale, claimed depreciation is recaptured at up to 25%, and gains may owe capital-gains tax (a 1031 exchange can defer both). Figures are a year-1 estimate at your 24.0% rate — not tax advice; consult a CPA.
Schools (NCES district)
- District
- Palm Springs Unified
- NCES district ID
- 0629550
- Math proficiency
- 21% ▼ -7.00%
- Reading proficiency
- 42% ▬ 0.00%
- Median HH income
- $43,638
- Composite
- 26.76/100
- National rank
- #7131
- State rank
- #328 of 517 in CA
Livability — Palm Springs
- Score
- 66/100
- State rank
- #348
- US rank
- #11850
Category grades
Schools grade is shown separately in the Schools card above.
Census & demographics
- Census place
- Palm Springs, CA
- County
- Riverside County · 2,287,001 people
- City population
- 46,786
- Metro
- Riverside-San Bernardino-Ontario, CA
- Population (ZIP)
- 26,887
- Household income
- $71,672
- Rent vs Own
- Severe rent burden
- 1866.0
Population outlook (Riverside County) Hauer SSP2
- Today (2025)
- 2,664,475 people
- By 2030
- 2,802,692 · +5.2%
- By 2040
- 3,050,904 · +14.5%
- By 2050
- 3,256,783 · +22.2%
- By 2075
- 3,655,058 · +37.2%
- By 2100
- 3,766,594 · +41.4%
Race, ethnicity, and origin ACS 2023
- Neighborhood character
- Diverse neighborhood (Simpson 0.58)
- Race & ethnicity
- White 58% Hispanic / Latino 27% Two or more races 13% Black 9% Asian 3%
- Hispanic origin (detail)
- Mexican 24%
- Common ancestry
- Lithuanian 3% Slovak 3% Italian 2%
- Foreign-born
- 17% · Canada, China
- Languages at home
- 75% English-only · Spanish 19% French/Haitian/Cajun 1% German/W. Germanic 1%
Political lean MEDSL · Riverside
- 2024 margin
- Toss-up / Even · D 48.0% · R 49.3% · Other 2.6%
- 2008→2024 swing
- -3.6pp toward R · 2008: 2.3pp · 2024: -1.3pp
- All cycles
- 2024: R+1.3 2020: D+8.0 2016: D+4.3 2012: R+0.4 2008: D+2.3
Not yet ingested
- Civics
- —
Market trends
- HPI YoY
- ▼ -1082.67%
- Current HPI
- 434.0524
- Rent YoY
- ▲ 0.46%
- Metro
- Riverside-San Bernardino-Ontario, CA
- State GDP YoY
- ▲ 3.21%
- F500 in state
- 116
Industry mix (Fortune 500 HQ in CA)
| Industry | F500 HQs | Revenue |
|---|---|---|
| Technology | 27 | $1,492B |
|
||
| Financial Services | 3 | $174B |
|
||
| Retail | 3 | $44B |
|
||
| Insurance | 3 | $26B |
|
||
| Media / Entertainment | 2 | $115B |
|
||
| Pharmaceuticals / Biotech | 2 | $62B |
|
||
Price history
+683.0% since first listed35 events — show timeline
- 2026-04-30 Price Changed $689,000 CRMLS
- 2026-04-08 Price Changed $729,000 CRMLS
- 2026-03-10 Price Changed $755,000 CRMLS
- 2026-01-30 Listed $777,777 CRMLS
- 2026-01-26 Coming Soon $777,777 CRMLS
- 2008-03-26 Listing Removed — CRMLS
- 2008-03-10 Sold (Public Records) $215,000 Public Records
- 2008-02-29 Sold (MLS) $215,000 CRMLS
- 2008-02-11 Listing Removed — GPSMLS
- 2008-02-08 Listing Removed — CRMLS
- 2008-01-15 Price Changed $239,000 CRMLS
- 2008-01-09 Price Changed $239,000 GPSMLS
- 2007-11-15 Price Changed $289,000 CRMLS
- 2007-11-14 Price Changed $289,000 GPSMLS
- 2007-09-25 Price Changed $319,000 GPSMLS
- 2007-09-23 Price Changed $319,000 CRMLS
- 2007-09-23 Price Changed $319,000 CRMLS
- 2007-07-19 Price Changed $337,000 GPSMLS
- 2007-07-01 Price Changed $350,000 GPSMLS
- 2007-06-29 Price Changed $350,000 CRMLS
- 2007-06-28 Price Changed $350,000 CRMLS
- 2007-06-22 Price Changed $369,000 CRMLS
- 2007-06-21 Price Changed $369,000 GPSMLS
- 2007-06-20 Price Changed $379,000 CRMLS
- 2007-06-19 Price Changed $399,000 CRMLS
- 2007-06-14 Price Changed $379,000 CRMLS
- 2007-06-11 Price Changed $379,000 CRMLS
- 2007-06-08 Listed $379,000 GPSMLS
- 2007-06-05 Listed $399,000 CRMLS
- 2007-05-28 Listed $399,000 CRMLS
- 2006-07-02 Listing Removed — GPSMLS
- 2006-02-21 Listed $369,900 GPSMLS
- 1998-06-12 Sold (Public Records) $75,000 Public Records
- 1988-10-25 Sold (Public Records) $88,000 Public Records
- 1988-10-25 Sold (Public Records) $88,000 Public Records
Property tax history
+7.1%/yrLatest (2025): $3,842 · -2.5% YoY. Source: county tax records.
Cash-flow waterfall
monthlySold comps — $/sqft
last 12 mo · ≤1 miLoading sold comps…