 Duplex
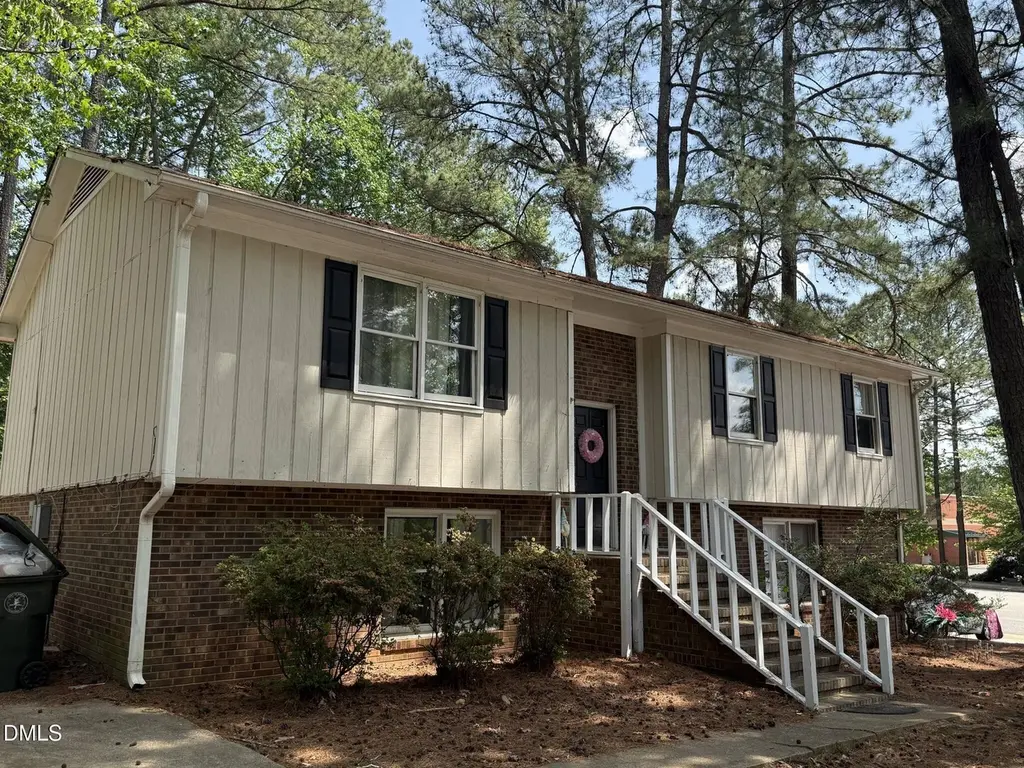
100 Madrid Ct · Garner, NC
Flood risk 1/10 · Minimal
- FEMA flood zone
- X (unshaded)
- Chance of flooding over 30 yrs
- 0.0%
- Est. flood insurance / yr
- $473 – $860
Fire risk 3/10 · Minor
- Est. fire insurance / yr
- $906 – $1,684
Heat risk 7/10 · Major
- Hot days now (above 105°F)
- 7 days/yr
- Hot days in 30 yrs
- 17 days/yr
Wind risk 6/10 · Moderate
- Chance of severe wind over 30 yrs
- 60.0%
Air-quality risk 2/10 · Minimal
- Unhealthy air days now
- 1 days/yr
- Unhealthy air days in 30 yrs
- 1 days/yr
Risk factors via First Street. Map © Google.
Why this score? — see what drove the D- grade
The composite is a weighted blend of 9 inputs, each scored 0–100. Each bar is that input's sub-score; the figure is the points it added to the 100-point composite (weight × sub-score).
- Cash flow +12.1/30.0
- ARV discount +7.5/15.0
- Schools +4.9/10.0
- Livability +3.8/5.0
- DSCR +3.6/10.0
- 1% rule +2.8/10.0
- Rent growth +2.8/5.0
- Condition / age +2.5/5.0
- Appreciation +0.0/10.0
$419,900
🖨 Deal sheet (PDF) 📄 Offer letter ✓ Due diligence
Multi-family units
County records classify this as Multi-Family (2-4 Unit). Listing-text estimate: 2 units. confirmed
Listing remarks MLS
Duplex; 100 Madrid Ct is vacant, and available for showings until rented. 102 Madrid Ct is rented. Lawn is maintained by a service. Tenants pay their own water/sewer/electric. New exterior paint 2017, interior refreshed 2016. Managed by same company since 2005.
Key facts
- Immediate cash flow
- Fully rented duplex
- No hoa fees
Tags
Property features AI
Finance
- Other: Total building area about 2,388 (living area listed as 2,388); Property located on a public maintained road in Wake County
- Financial info: Two-unit property; Owner pays HVAC maintenance, insurance, and repairs
- HOA & community: No association
Exterior
- Parking: Open parking for 4 vehicles; Driveway; Parking pad
- Utilities: Public water; Public sewer
- Home design: Duplex; Multi/split and one level configuration; No common walls
- Construction: Brick, frame, and vertical siding exterior; Shingle roof; No foundation details listed; Built as a duplex
- Exterior features: Rain gutters; Lot approximately 0.29 acres; Zoned MF-A
Interior
- Kitchen: Dishwasher; Range / Electric Range / Free‑Standing Range; Range hood; Refrigerator / Free‑Standing Refrigerator
- Bedrooms: 6 bedrooms
- Flooring: Carpet; Laminate; Luxury vinyl
- Bathrooms: 2 full bathrooms; 2 half bathrooms
- Heating & cooling: Central heating; Central air; Ceiling fan(s)
- Interior features: Laminate counters; Rain gutters
Neighborhood map
What this means for you Summary
Snapshot
- This is a 2 × 3.0-bed/1.5-bath units multifamily listed at $420k.
Deal economics
- At list price, monthly cash flow is $-94 ($-1k/yr) — negative. Per door: $-47/mo.
- To cash-flow at today's rent, offer at most $403k (4.0% below list).
- To meet the 1% rule (rent ≥ 1% of price), the offer needs to be $327k (22.2% below list).
- Recommended offer: $327k (22.2% below list) — sets the bar for 1% rule.
- Cap rate 6.0% vs local median 3.3% in Garner — top-decile yield for the area; either an underpriced asset or a hidden risk that comps aren't pricing in. Stress-test before assuming the spread holds.
Location & tenants
- Location reads 76/100 on livability (#35 in NC, #3,421 nationally) — a middle-class / working-renter tenant base. Strengths: housing A+, commute A-, cost of living A-; Watch: amenities D, crime F.
- Wake County Schools (suburban): math 52% / reading 60% proficiency, ranked #35 of 178 in NC (top 20%) — acceptable for families but not a draw, mixed tenant base, ~2y average lease.
- Zoned schools: Aversboro Elementary (math 17% / reading 42%, grade F, #975 of 1,410 statewide, top 71%, 377 students, 72% FRL); East Garner Middle (math 23% / reading 33%, grade F, #360 of 475 statewide, top 77%, 1,186 students, 73% FRL); Garner High (math 32% / reading 56%, grade F, #367 of 535 statewide, top 69%, 1,683 students, 50% FRL) — zoned schools average 65% FRL vs 30% district-wide (35 pts higher); higher-poverty schools than district average — tighter screening recommended.
- Zoned-school proficiency averages 34% at this address vs 56% district-wide (-22 pts) — the specific schools serving this property underperform the Wake County Schools average; the district grade overstates school quality for this exact location.
- Market conditions: Rents rising (+1.1%/yr); 652 active listings in the ZIP; solid renter incomes; 15,249 units permitted in Wake County in 2024 (5,568 in 5+ unit buildings).
- At $3,268/mo this rent would consume 46% of the median local household income ($86k/yr) (locally 1455% of renters already pay >50% of income on rent) — very limited rent-growth headroom before tenants either downsize or default.
Forward outlook
- Local home prices are declining (-3.0%/yr); year-one equity from $3k of loan paydown is wiped out by about $13k of value loss. Plan a longer hold.
- Wake County population projected at +51% by 2050 — long-run rental-demand tailwind backs the buy-and-hold thesis.
Negotiation context
- It's been on market 16 days — a 2% lower offer ($414k) is reasonable based on typical stale-listing flexibility.
- 7 sale attempts since 21y ago with the ask held roughly flat each time — persistent listings suggest the price (not the market) is what's stuck; bring a comps-based counter.
- Current owner paid $202k; list at $420k implies a 107% gain — meaningful room to come down on a strong offer.
Risks & watch-outs
- Climate carrying-cost: major wind risk, 60% chance of damaging wind over 30y; extreme-heat days projected 7→17/yr by 2055 (HVAC capex compounding) — expect insurance premiums to compound above CPI over the hold.
Questions for the listing agent
- What do current leases actually rent for vs. the listed asking? Can we see a recent rent roll and the last 12 months of T-12 income?
- Can we see the unit-by-unit rent roll, current vacancy, and any below-market leases? What's the average tenancy length?
- What capital expenditures (roof, boiler, parking lot, exteriors) have been made in the last 5 years, and what's planned in the next 2?
- Is there a deadline driving the sale (1031 exchange, divorce, estate, relocation)? That informs how much negotiation room exists.
- Schools are D-rated, which usually means shorter tenancies and higher turnover. Who's the typical renter profile here, and what's been the actual vacancy rate?
- Crime grade is F in this area — have there been break-ins, vandalism, or insurance claims at this property in the last 3 years? What carrier currently insures it and at what premium?
- The area grade is low — what's the realistic commute time and amenity access for the typical tenant pool here? Any planned neighborhood developments (good or bad) we should know about?
- What's the average days-on-market for RENTAL listings here right now (not sales)? A rising rental-DOM trend means longer vacancies and softer asking-rent achievability than the comps imply.
- What's the recent tenant-quality profile in this submarket — average credit score on applications, eviction rate, late-payment / NSF rate, and stable-employment percentage? A property-management company in the area should have these aggregated.
- How much new apartment / multifamily construction is in the pipeline within 1–3 miles? Heavy new supply (>2% of stock underway) typically softens rents 12–24 months out; light construction supports rent growth.
Investment metrics
- 1% rule
- 0.78% ✗
- Cap rate
- 6.02%
- Cash-on-cash
- -0.96%
- DSCR
- 0.96
- GRM
- 10.7
CMA / ARV
No comps found within radius.
Projected returns pro-forma
-3.0% appreciation · 1.15% rent growth · sell at horizon
- IRR
- -19.8%
- Equity multiple
- 0.32×
- Total profit
- $-80,091
- Equity at exit
- $62,608
- IRR
- -16.9%
- Equity multiple
- 0.14×
- Total profit
- $-101,431
- Equity at exit
- $36,305
Cash invested: $117,572 (down + closing). Projections, not guarantees.
Landlord ↔ Tenant lean methodology
- Overall (STATE)
- 85 Strongly Landlord-Friendly
- State North Carolina
- 85 Strongly Landlord-Friendly · R+3
- County
- — inherits STATE
- City
- — inherits STATE
ZIP-level market 27529
- Rents YoY
- 1.1%
- Active inventory
- 652
- Price-to-rent
- 21.4×
Monthly cashflow live
- Estimated rent
- $3,268 high interval (Pro) →
- Mortgage (P&I)
- −$2,202
- Tax from tax record
- −$299 /mo · $3,585/yr
- Insurance
- −$175
- HOA
- −$0
- Vacancy / Maint / Mgmt
- −$686
- Net cashflow
- $-94
Break-even live
Sensitivity live
| Price | -10% $144 | -5% $25 | +0% $-94 | +5% $-213 | +10% $-332 |
|---|---|---|---|---|---|
| Rent | -10% $-352 | -5% $-223 | +0% $-94 | +5% $35 | +10% $164 |
| Rate | -1.0pp $117 | -0.5pp $13 | base $-94 | +0.5pp $-203 | +1.0pp $-313 |
2-unit breakdown (identical units grouped — click to expand)
| Units | Beds | Baths | Est. rent |
|---|---|---|---|
| 2× units | 3.0 | 1.5 | $3,268 |
| #1 | 3.0 | 1.5 | $1,634 |
| #2 | 3.0 | 1.5 | $1,634 |
| Total (2 units) | $3,268 | ||
UW: 25.0% down · 7.5% · 30yr · 1.5% tax · 5.0% vac · 8.0% maint · 8.0% mgmt
Financing live
Cash to close
- Down payment
- $104,975
- Closing costs
- $12,597
- Reserves months
- —
- Total cash needed
- —
Loan-product check · same deal, 3 products live
Conventional
25% down · 7.5% · 30yr
- Down + closing
- —
- Monthly P&I
- —
- Monthly cashflow
- —
- DSCR
- —
- Eligible?
- —
Personal DTI + credit; lowest rate.
DSCR
20% down · 8.5% · 30yr
- Down + closing
- —
- Monthly P&I
- —
- Monthly cashflow
- —
- DSCR
- —
- Eligible?
- —
No personal income docs; deal must DSCR.
Hard money
10% down · 12.0% · 12mo
- Down + closing
- —
- Monthly P&I
- —
- Monthly cashflow
- —
- DSCR
- —
- Eligible?
- —
Short-term bridge; refi at stabilization.
Listing history 11 events
-
2026-06-21days on market $419,900 Active 16 DOM
-
2026-06-18days on market $419,900 Active 13 DOM
-
2026-06-17days on market $419,900 Active 12 DOM
-
2026-06-16days on market $419,900 Active 11 DOM
-
2026-06-15days on market $419,900 Active 10 DOM
-
2026-06-13days on market $419,900 Active 8 DOM
-
2026-06-13days on market $419,900 Active 7 DOM
-
2026-06-09days on market $419,900 Active 4 DOM
-
2026-06-08days on market $419,900 Active 3 DOM
-
2026-06-07remarks 695-char remark
-
2026-06-07$419,900 Active 2 DOM
ⓘ Source: listings_history table (triggers on properties + properties_extension) + one-shot
backfill from property_details.listing_events for pre-trigger history.
Tax reassessment forecast NC · Resets to sale price
- Current annual tax
- $3,585 · $299/mo
- Projected year-2 tax
- $3,585 · $299/mo
- Expected delta
- $0/yr ($0/mo · 0.0%)
ⓘ Screening estimate from a state-policy table — verify with the county assessor before closing.
Climate risk First Street
- Flood 1/10 Low FEMA zone X (unshaded) · 0% chance over 30 yrs
- Wildfire 3/10 Moderate
- Heat 7/10 Severe 7 d/yr ≥105°F today · 17 d/yr by 30 yrs out
- Wind 6/10 Major 60% chance of damaging wind over 30 yrs
- Air quality 2/10 Low 1 unhealthy d/yr today · 1 by 30 yrs out
Nearby sold comps map
Loading sold comps map…
Walkable amenities ~0.75 mi
Loading nearby amenities…
Taxation est. · year 1
- Rental income
- $39,216
- − Mortgage interest
- −$23,521
- − Property taxes
- −$3,585
- − Insurance
- −$2,100
- − Repairs & maintenance
- −$3,137
- − Management
- −$3,137
- − Depreciation
- −$12,215
- Taxable loss
- −$8,479
- Est. tax savings @ 24.0%
- +$2,035
- After-tax cash flow
- $907/yr
For passive investors: Depreciation is non-cash, so a rental often shows a tax loss while cash-flowing — sheltering income. Rental losses are passive: they offset passive income freely, and up to $25,000/yr can offset ordinary (W-2) income if you actively participate and your MAGI is under $100k (phasing out to $0 by $150k); unused losses carry forward. On sale, claimed depreciation is recaptured at up to 25%, and gains may owe capital-gains tax (a 1031 exchange can defer both). Figures are a year-1 estimate at your 24.0% rate — not tax advice; consult a CPA.
Schools (NCES district)
- District
- Wake County Schools
- NCES district ID
- 3704720
- Math proficiency
- 52% ▲ 2.00%
- Reading proficiency
- 60% ▲ 4.00%
- Median HH income
- $67,509
- Composite
- 49.41/100
- National rank
- #2010
- State rank
- #35 of 178 in NC
Livability — Garner
- Score
- 76/100
- State rank
- #35
- US rank
- #3421
Category grades
Schools grade is shown separately in the Schools card above.
Census & demographics
- Census place
- Garner, NC
- County
- Wake County · 1,216,256 people
- City population
- 55,242
- Metro
- Raleigh-Cary, NC
- Population (ZIP)
- 55,242
- Household income
- $85,716
- Rent vs Own
- Severe rent burden
- 1455.0
Population outlook (Wake County) Hauer SSP2
- Today (2025)
- 1,293,152 people
- By 2030
- 1,428,223 · +10.4%
- By 2040
- 1,698,188 · +31.3%
- By 2050
- 1,955,807 · +51.2%
- By 2075
- 2,520,273 · +94.9%
- By 2100
- 2,893,335 · +123.7%
Race, ethnicity, and origin ACS 2023
- Neighborhood character
- Diverse neighborhood (Simpson 0.61)
- Race & ethnicity
- White 56% Black 25% Hispanic / Latino 13% Two or more races 9% Asian 1%
- Hispanic origin (detail)
- Mexican 8% Puerto Rican 2%
- Common ancestry
- Lithuanian 3% Slovak 3% Italian 2%
- Foreign-born
- 8% · Canada
- Languages at home
- 87% English-only · Spanish 11% Other Indo-European 1%
Political lean MEDSL · Wake
- 2024 margin
- Strong D (+25.5) · D 61.9% · R 36.4% · Other 1.7%
- 2008→2024 swing
- +11.1pp toward D · 2008: 14.4pp · 2024: 25.5pp
- All cycles
- 2024: D+25.5 2020: D+26.4 2016: D+20.5 2012: D+10.2 2008: D+14.4
Not yet ingested
- Civics
- —
Market trends
- HPI YoY
- ▼ -241.30%
- Current HPI
- 238.8492
- Rent YoY
- ▲ 1.15%
- Metro
- Raleigh-Cary, NC
- State GDP YoY
- ▲ 3.28%
- F500 in state
- 26
Industry mix (Fortune 500 HQ in NC)
| Industry | F500 HQs | Revenue |
|---|---|---|
| Financial Services | 2 | $213B |
|
||
| Retail | 2 | $95B |
|
||
| Industrial Conglomerate | 1 | $38B |
|
||
| Metals / Steel | 1 | $35B |
|
||
| Utilities | 1 | $30B |
|
||
| Industrial Machinery | 1 | $19B |
|
||
Price history
+139.9% since first listed19 events — show timeline
- 2026-06-05 Listed $419,900 TMLS
- 2017-05-12 Listing Removed — TMLS
- 2017-05-12 Sold (Public Records) $202,500 Public Records
- 2017-05-12 Sold (MLS) $202,400 AMLSNC
- 2017-05-12 Sold (MLS) $202,400 TMLS
- 2017-03-23 Contingent — TMLS
- 2017-03-17 Price Changed $204,900 TMLS
- 2017-03-17 Relisted — TMLS
- 2017-02-24 Pending — TMLS
- 2017-02-22 Listed $199,900 TMLS
- 2017-02-22 Listed $204,900 AMLSNC
- 2010-01-01 Listing Removed — TMLS
- 2009-08-28 Listed $225,000 TMLS
- 2005-11-10 Sold (Public Records) $174,000 Public Records
- 2005-11-10 Sold (MLS) $174,000 AMLSNC
- 2005-11-10 Sold (MLS) $174,000 TMLS
- 2005-10-21 Listing Removed — TMLS
- 2005-10-06 Listed $175,000 AMLSNC
- 2005-10-06 Listed $175,000 TMLS
Property tax history
+4.6%/yrLatest (2025): $3,585 · +0.3% YoY. Source: county tax records.
Cash-flow waterfall
monthlySold comps — $/sqft
last 12 mo · ≤1 miLoading sold comps…