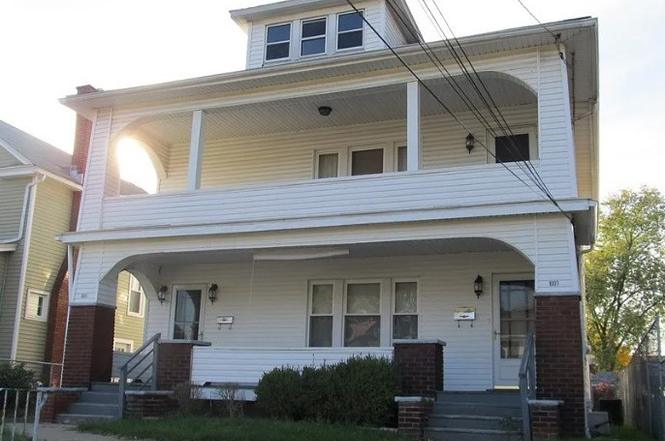
 Duplex
1005 Clarendon Ave NW · Canton, OH
Flood risk 1/10 · Minimal
- FEMA flood zone
- X (unshaded)
- Chance of flooding over 30 yrs
- 0.0%
- Est. flood insurance / yr
- $473 – $860
Fire risk 1/10 · Minimal
- Est. fire insurance / yr
- $713 – $1,323
Heat risk 3/10 · Minor
- Hot days now (above 96°F)
- 7 days/yr
- Hot days in 30 yrs
- 17 days/yr
Wind risk 1/10 · Minimal
- Chance of severe wind over 30 yrs
- —
Air-quality risk 2/10 · Minimal
- Unhealthy air days now
- 0 days/yr
- Unhealthy air days in 30 yrs
- 1 days/yr
Risk factors via First Street. Map © Google.
Why this score? — see what drove the B- grade
The composite is a weighted blend of 9 inputs, each scored 0–100. Each bar is that input's sub-score; the figure is the points it added to the 100-point composite (weight × sub-score).
- Cash flow +28.8/30.0
- DSCR +10.0/10.0
- ARV discount +8.8/15.0
- 1% rule +7.4/10.0
- Rent growth +4.2/5.0
- Livability +3.6/5.0
- Condition / age +2.5/5.0
- Schools +1.7/10.0
- Appreciation +0.0/10.0
$155,000
🖨 Deal sheet (PDF) 📄 Offer letter ✓ Due diligence
Multi-family units
County records classify this as Multi-Family (2-4 Unit). Listing-text estimate: 2 units. confirmed
Listing remarks MLS
Property is in excellent condition and always clean and maintained. Great rental history and cash flow. Basement for both units is divided and private. Front and back doors for both units. Newer windows & shingles. Separate water, electric, & gas.
Key facts
- 4,098 sq ft lot
- 2 garage spots
- Built 1925
Property features AI
Finance
- Financial info: Gross rental income listed as $1,525; Unit rents: one unit at $725, the other at $800; Both units currently leased (leases expire Jul 31, 2026 and Oct 31, 2026)
Exterior
- Parking: Detached 2-car garage
- Utilities: Public water; Public sewer
- Home design: Two-story building; Frame construction; Asphalt roof
- Construction: Built (year per public records); Frame construction; Asphalt roof; Full basement
- Exterior features: Small lot (approximately 0.094 acres)
Interior
- Kitchen: Standard kitchens in each unit
- Bedrooms: Two 2-bedroom units (each unit leased)
- Bathrooms: Each unit has 1 bathroom (total 2 full bathrooms)
- Heating & cooling: Central air; Forced-air gas heating
- Interior features: Full basement
- Laundry & utility: On-site utilities (public water and public sewer)
Neighborhood map
What this means for you Summary
Snapshot
- This is a 2 × 2-bed/1.0-bath units multifamily listed at $155k.
Deal economics
- At list price, monthly cash flow is $520 ($6k/yr) — positive. Per door: $260/mo.
- The deal already cash-flows at list — no discount required.
- Meets the 1% rule at list price ($2k rent vs $155k).
- Cap rate 10.3% vs local median 4.9% in Canton — top-decile yield for the area; either an underpriced asset or a hidden risk that comps aren't pricing in. Stress-test before assuming the spread holds.
Location & tenants
- Location reads 71/100 on livability (#441 in OH) — a middle-class / working-renter tenant base. Strengths: commute A+, cost of living A+, housing A; Watch: crime F, employment F.
- Canton City (urban): math 17% / reading 26% proficiency, ranked #627 of 656 in OH (top 96%) — low school quality limits family demand, transient renter base, plan for 1-2y turnover; 76% free/reduced lunch — lower-income household profile, screen leases tightly.
- Zoned schools: Harter Elementary School (381 students, 0% FRL); Crenshaw Middle School (math 10% / reading 19%, grade F, #630 of 654 statewide, top 97%, 774 students, 0% FRL); Mckinley High School (math 8% / reading 29%, grade F, #683 of 781 statewide, top 88%, 2,154 students, 0% FRL) — zoned schools average 0% FRL vs 76% district-wide (76 pts lower); this property's tenant base skews higher-income than the district average.
- Market conditions: Rents rising fast (+6.7%/yr); 124 active listings in the ZIP; 3 comparable units currently listed for rent nearby; rentals at typical pace (median 23d on market — plan ~3-4 weeks tenant-placement turnaround); 528 units permitted in Stark County in 2024 (84 in 5+ unit buildings).
- This rent runs 36% of the median local income ($64k/yr) — at the standard rent-burdened threshold; future hikes will face affordability resistance.
Forward outlook
- Local home prices are declining (-3.0%/yr); year-one equity from $1k of loan paydown is wiped out by about $5k of value loss. Plan a longer hold.
- Stark County population projected to shrink 8% by 2050 — rents likely to lag national; underwrite the cash flow, not the appreciation.
- At projected returns (-3.0% appreciation + 6.7% rent growth), your $43k cash investment doubles in ~7 years — after that, you're playing with house money.
Negotiation context
- Only 5 days on market — expect competitive offers; lowballing is unlikely to land.
- 2 sale attempts since 11y ago with the ask held roughly flat each time — persistent listings suggest the price (not the market) is what's stuck; bring a comps-based counter.
- Current owner paid $65k; list at $155k implies a 138% gain — meaningful room to come down on a strong offer.
Risks & watch-outs
- Watch-outs: built in 1925 — expect roof / HVAC / electrical / plumbing capex.
Questions for the listing agent
- Can we see the unit-by-unit rent roll, current vacancy, and any below-market leases? What's the average tenancy length?
- What capital expenditures (roof, boiler, parking lot, exteriors) have been made in the last 5 years, and what's planned in the next 2?
- Built in 1925 — when were the roof, HVAC, electrical panel, plumbing, and water heater last replaced?
- Is there a deadline driving the sale (1031 exchange, divorce, estate, relocation)? That informs how much negotiation room exists.
- Crime grade is F in this area — have there been break-ins, vandalism, or insurance claims at this property in the last 3 years? What carrier currently insures it and at what premium?
- What's the average days-on-market for RENTAL listings here right now (not sales)? A rising rental-DOM trend means longer vacancies and softer asking-rent achievability than the comps imply.
- What's the recent tenant-quality profile in this submarket — average credit score on applications, eviction rate, late-payment / NSF rate, and stable-employment percentage? A property-management company in the area should have these aggregated.
- How much new apartment / multifamily construction is in the pipeline within 1–3 miles? Heavy new supply (>2% of stock underway) typically softens rents 12–24 months out; light construction supports rent growth.
Investment metrics
- 1% rule
- 1.24% ✓
- Cap rate
- 10.32%
- Cash-on-cash
- 14.38%
- DSCR
- 1.64
- GRM
- 6.7
CMA / ARV
- ARV (on-the-fly)
- $159,432
- Comps found
- 5
Show comp detail 5 sales within ~0.75 mi
| Address | Dist | Beds/Ba | Sqft | Sold | Price | $/sf | Match |
|---|---|---|---|---|---|---|---|
| 2904 12th St NW | 0.19mi | 4/2.0 | 1,904 (-13%) | 11mo | $92,500 | $49 | 60 |
| 1128 Clarendon Ave NW | 0.10mi | 5/2.0 (+1) | 1,924 (-12%) | 17mo | $150,000 | $78 | 56 |
| 339 Broad Ave NW | 0.41mi | 4/2.0 | 1,896 (-13%) | 12mo | $135,000 | $71 | 49 |
| 427 Smith Ave NW | 0.41mi | 4/4.0 | 2,370 (+8%) | 23mo | $174,000 | $73 | 39 |
| 115 Broad Ave NW | 0.61mi | 5/3.0 (+1) | 2,000 (-8%) | 20mo | $220,000 | $110 | 32 |
Match score weights: distance 35% · size 25% · config 20% · recency 20%. Top-matched comps best support the ARV.
Projected returns pro-forma
-3.0% appreciation · 6.73% rent growth · sell at horizon
- IRR
- 8.7%
- Equity multiple
- 1.36×
- Total profit
- $15,444
- Equity at exit
- $23,111
- IRR
- 20.7%
- Equity multiple
- 3.05×
- Total profit
- $89,062
- Equity at exit
- $13,402
Cash invested: $43,400 (down + closing). Projections, not guarantees.
Landlord ↔ Tenant lean methodology
- Overall (STATE)
- 73 Landlord-Friendly
- State Ohio
- 73 Landlord-Friendly · R+6
- County
- — inherits STATE
- City
- — inherits STATE
ZIP-level market 44708
- Rents YoY
- 6.7%
- Active inventory
- 124
- Price-to-rent
- 13.5×
Monthly cashflow live
- Estimated rent
- $1,915 high interval (Pro) →
- Mortgage (P&I)
- −$813
- Tax from tax record
- −$115 /mo · $1,384/yr
- Insurance
- −$65
- HOA
- −$0
- Vacancy / Maint / Mgmt
- −$402
- Net cashflow
- $520
Break-even live
Sensitivity live
| Price | -10% $608 | -5% $564 | +0% $520 | +5% $476 | +10% $432 |
|---|---|---|---|---|---|
| Rent | -10% $369 | -5% $444 | +0% $520 | +5% $596 | +10% $671 |
| Rate | -1.0pp $598 | -0.5pp $559 | base $520 | +0.5pp $480 | +1.0pp $439 |
2-unit breakdown (identical units grouped — click to expand)
| Units | Beds | Baths | Est. rent |
|---|---|---|---|
| 2× units | 2 | 1 | $1,914 |
| #1 | 2 | 1 | $957 |
| #2 | 2 | 1 | $957 |
| Total (2 units) | $1,915 | ||
UW: 25.0% down · 7.5% · 30yr · 1.5% tax · 5.0% vac · 8.0% maint · 8.0% mgmt
Financing live
Cash to close
- Down payment
- $38,750
- Closing costs
- $4,650
- Reserves months
- —
- Total cash needed
- —
Loan-product check · same deal, 3 products live
Conventional
25% down · 7.5% · 30yr
- Down + closing
- —
- Monthly P&I
- —
- Monthly cashflow
- —
- DSCR
- —
- Eligible?
- —
Personal DTI + credit; lowest rate.
DSCR
20% down · 8.5% · 30yr
- Down + closing
- —
- Monthly P&I
- —
- Monthly cashflow
- —
- DSCR
- —
- Eligible?
- —
No personal income docs; deal must DSCR.
Hard money
10% down · 12.0% · 12mo
- Down + closing
- —
- Monthly P&I
- —
- Monthly cashflow
- —
- DSCR
- —
- Eligible?
- —
Short-term bridge; refi at stabilization.
Rent comps 3 comps
| Address | Beds | Baths | Sqft | Rent | $/sqft | DOM | Units | Dist |
|---|---|---|---|---|---|---|---|---|
| 2510 10th St NW Canton, OH | 3.0 | 1.5 | 1468 | $1,175 | $0.80 | 23d | 1 | 0.05mi |
| 2306 6th St SW Canton, OH | 4.0 | 1.5 | 2086 | $1,200 | $0.58 | 23d | 1 | 0.81mi |
| 1137 7th St NW Canton, OH | 3.0 | 1.0 | 1736 | $1,095 | $0.63 | 46d | 1 | 0.97mi |
Listing history 4 events
-
2026-06-21days on market $155,000 Active 5 DOM
-
2026-06-18days on market $155,000 Active 2 DOM
-
2026-06-16remarks 699-char remark
-
2026-06-16$155,000 Active 1 DOM
ⓘ Source: listings_history table (triggers on properties + properties_extension) + one-shot
backfill from property_details.listing_events for pre-trigger history.
Tax reassessment forecast OH · Partial reset (capped growth)
- Current annual tax
- $1,384 · $115/mo
- Projected year-2 tax
- $1,901 · $158/mo
- Expected delta
- +$517/yr (+$43/mo · 37.3%)
ⓘ Screening estimate from a state-policy table — verify with the county assessor before closing.
Climate risk First Street
- Flood 1/10 Low FEMA zone X (unshaded) · 0% chance over 30 yrs
- Wildfire 1/10 Low
- Heat 3/10 Moderate 7 d/yr ≥96°F today · 17 d/yr by 30 yrs out
- Wind 1/10 Low
- Air quality 2/10 Low 0 unhealthy d/yr today · 1 by 30 yrs out
Nearby sold comps map
Loading sold comps map…
Walkable amenities ~0.75 mi
Loading nearby amenities…
Taxation est. · year 1
- Rental income
- $22,980
- − Mortgage interest
- −$8,682
- − Property taxes
- −$1,384
- − Insurance
- −$775
- − Repairs & maintenance
- −$1,838
- − Management
- −$1,838
- − Depreciation
- −$4,509
- Taxable income
- $3,952
- Est. tax owed @ 24.0%
- −$949
- After-tax cash flow
- $5,292/yr
For passive investors: Depreciation is non-cash, so a rental often shows a tax loss while cash-flowing — sheltering income. Rental losses are passive: they offset passive income freely, and up to $25,000/yr can offset ordinary (W-2) income if you actively participate and your MAGI is under $100k (phasing out to $0 by $150k); unused losses carry forward. On sale, claimed depreciation is recaptured at up to 25%, and gains may owe capital-gains tax (a 1031 exchange can defer both). Figures are a year-1 estimate at your 24.0% rate — not tax advice; consult a CPA.
Schools (NCES district)
- District
- Canton City
- NCES district ID
- 3904371
- Math proficiency
- 17% ▼ -17.00%
- Reading proficiency
- 26% ▼ -12.00%
- Median HH income
- $28,825
- Composite
- 17.1/100
- National rank
- #9116
- State rank
- #627 of 656 in OH
Livability — Canton
- Score
- 71/100
- State rank
- #441
- US rank
- #7259
Category grades
Schools grade is shown separately in the Schools card above.
Census & demographics
- Census place
- Canton, OH
- County
- Stark County · 272,865 people
- City population
- 103,614
- Metro
- Canton-Massillon, OH
- Population (ZIP)
- 24,285
- Household income
- $63,706
- Rent vs Own
- Severe rent burden
- 725.0
Population outlook (Stark County) Hauer SSP2
- Today (2025)
- 373,708 people
- By 2030
- 371,245 · -0.7%
- By 2040
- 361,331 · -3.3%
- By 2050
- 345,290 · -7.6%
- By 2075
- 302,669 · -19.0%
- By 2100
- 238,870 · -36.1%
Race, ethnicity, and origin ACS 2023
- Neighborhood character
- Predominantly White (80%)
- Race & ethnicity
- White 80% Black 8% Two or more races 8% Hispanic / Latino 4% Asian 3%
- Common ancestry
- Italian 8% Romanian 2% Slovak 2%
- Foreign-born
- 4% · Canada, South Korea, Vietnam
- Languages at home
- 95% English-only · Spanish 2% Other Indo-European 1% Tagalog/Filipino 1%
Political lean MEDSL · Stark
- 2024 margin
- Strong R (+21.9) · D 38.6% · R 60.5%
- 2008→2024 swing
- -27.4pp toward R · 2008: 5.5pp · 2024: -21.9pp
- All cycles
- 2024: R+21.9 2020: R+18.5 2016: R+17.4 2012: R+0.4 2008: D+5.5
Not yet ingested
- Civics
- —
Market trends
- HPI YoY
- ▼ -168.35%
- Current HPI
- 206.298
- Rent YoY
- ▲ 6.73%
- Metro
- Canton-Massillon, OH
- State GDP YoY
- ▲ 1.98%
- F500 in state
- 48
Industry mix (Fortune 500 HQ in OH)
| Industry | F500 HQs | Revenue |
|---|---|---|
| Insurance | 3 | $145B |
|
||
| Industrial Machinery | 3 | $49B |
|
||
| Financial Services | 3 | $24B |
|
||
| Consumer Goods | 2 | $93B |
|
||
| Aerospace / Defense | 2 | $47B |
|
||
| Utilities | 2 | $33B |
|
||
Price history
+190.3% since first listed7 events — show timeline
- 2026-06-16 Listed $155,000 MLSNOW
- 2016-05-13 Sold (Public Records) $65,000 Public Records
- 2016-05-11 Sold (MLS) $65,000 MLSNOW
- 2016-05-04 Pending — MLSNOW
- 2016-04-13 Contingent — MLSNOW
- 2015-10-30 Listed $74,900 MLSNOW
- 2004-11-12 Sold (Public Records) $53,400 Public Records
Property tax history
+0.3%/yrLatest (2024): $1,384 · -10.2% YoY. Source: county tax records.
Cash-flow waterfall
monthlySold comps — $/sqft
last 12 mo · ≤1 miLoading sold comps…