304 E 4th St · East Brady, PA
Flood risk 1/10 · Minimal
- FEMA flood zone
- X (unshaded)
- Chance of flooding over 30 yrs
- 0.0%
- Est. flood insurance / yr
- $507 – $1,088
Fire risk 1/10 · Minimal
- Est. fire insurance / yr
- $511 – $949
Heat risk 3/10 · Minor
- Hot days now (above 98°F)
- 7 days/yr
- Hot days in 30 yrs
- 18 days/yr
Wind risk 2/10 · Minimal
- Chance of severe wind over 30 yrs
- —
Air-quality risk 2/10 · Minimal
- Unhealthy air days now
- 1 days/yr
- Unhealthy air days in 30 yrs
- 3 days/yr
Risk factors via First Street. Map © Google.
Why this score? — see what drove the C+ grade
The composite is a weighted blend of 9 inputs, each scored 0–100. Each bar is that input's sub-score; the figure is the points it added to the 100-point composite (weight × sub-score).
- Cash flow +22.1/30.0
- 1% rule +8.8/10.0
- ARV discount +7.5/15.0
- DSCR +7.1/10.0
- Schools +3.6/10.0
- Livability +3.2/5.0
- Appreciation +2.8/10.0
- Rent growth +2.5/5.0
- Condition / age +2.5/5.0
$69,999
🖨 Deal sheet 📄 Offer letter ✓ Due diligence
Listing remarks
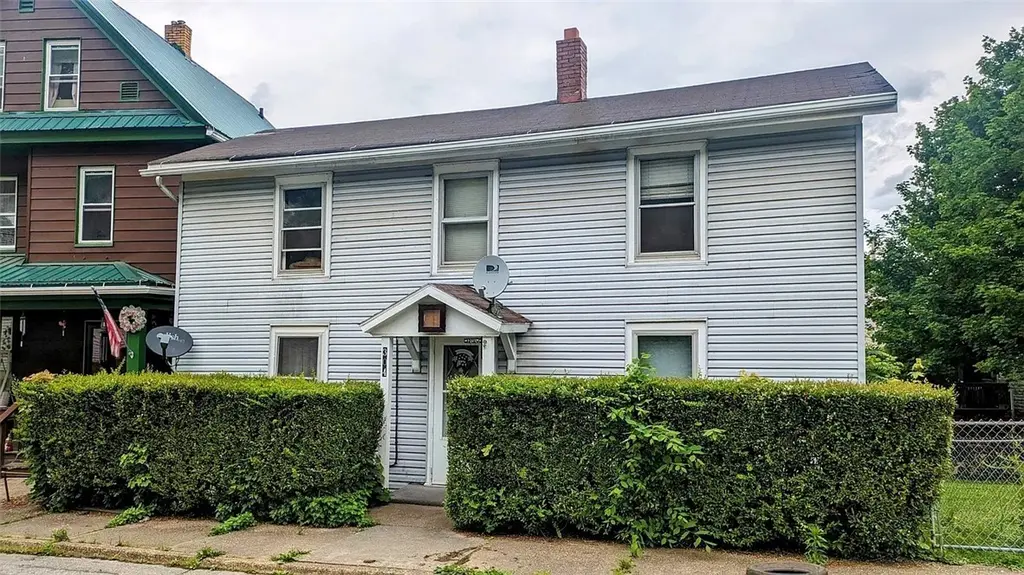
Charming two-story home located in the heart of Oil City offering timeless character and everyday convenience! This 3-bedroom, 1-bath residence features spacious rooms, abundant natural light, and a functional layout perfect for comfortable living. Enjoy a large backyard, and rear deck ideal for relaxing or entertaining. Conveniently situated near downtown shopping, dining, schools, and local parks. Whether you're looking for a primary residence or investment opportunity, this property offers great potential at an affordable price. Sold AS-IS.
Key facts
- Large backyard
- Downtown shopping
- Two story home
Tags
Property features AI
Exterior
- Parking: Detached garage; Total of 3 parking spaces
- Utilities: Public water; Public sewer
- Home design: Two stories; Resale property
- Construction: Frame construction; Composition roof
- Exterior features: Public water; Public sewer
Interior
- Kitchen: Refrigerator; Stove; Some gas appliances
- Bedrooms: Three bedrooms (two located on the upper level; third bedroom on the upper level)
- Bathrooms: One full bathroom
- Heating & cooling: Gas heating
- Interior features: Basement
Neighborhood map
What this means for you Summary
Snapshot
- This is a 3-bed/1.0-bath single-family listed at $70k.
Deal economics
- At list price, monthly cash flow is $112 ($1k/yr) — positive.
- The deal already cash-flows at list — no discount required.
- Meets the 1% rule at list price ($968 rent vs $70k).
- Recommended offer: $69k (1.5% below list) — sets the bar for market timing.
Location & tenants
- Location reads 64/100 on livability (#1,240 in PA) — a middle-class / working-renter tenant base. Strengths: cost of living A+, housing A+, health & safety A-; Watch: schools F, amenities F, commute F.
- Karns City Area SD (rural): math 33% / reading 51% proficiency, ranked #322 of 539 in PA (top 60%) — families likely to look elsewhere, expect single-tenant / working-renter base with shorter leases.
- Market conditions: 10 active listings in the ZIP; 25 units permitted in Clarion County in 2024 (0 in 5+ unit buildings).
Forward outlook
- Local home prices are declining (-3.0%/yr); year-one equity from $484 of loan paydown is wiped out by about $2k of value loss. Plan a longer hold.
- Clarion County population projected at -18% by 2050 — secular population decline; favor cash flow + early exit over multi-decade hold.
Negotiation context
- It's been on market 22 days — a 2% lower offer ($69k) is reasonable based on typical stale-listing flexibility.
- Current owner paid $16k; list at $70k implies a 337% gain — meaningful room to come down on a strong offer.
Risks & watch-outs
- Watch-outs: property tax is 4.4% of price; built in 1953 — expect roof / HVAC / electrical / plumbing capex.
Questions for the listing agent
- Built in 1953 — when were the roof, HVAC, electrical panel, plumbing, and water heater last replaced?
- Property tax is high relative to price — has the assessment been appealed recently, and will the sale trigger a re-assessment?
- Is there a deadline driving the sale (1031 exchange, divorce, estate, relocation)? That informs how much negotiation room exists.
- Schools are F-rated, which usually means shorter tenancies and higher turnover. Who's the typical renter profile here, and what's been the actual vacancy rate?
- What's the average days-on-market for RENTAL listings here right now (not sales)? A rising rental-DOM trend means longer vacancies and softer asking-rent achievability than the comps imply.
- What's the recent tenant-quality profile in this submarket — average credit score on applications, eviction rate, late-payment / NSF rate, and stable-employment percentage? A property-management company in the area should have these aggregated.
- How much new for-sale + rental construction is in the pipeline within 1–3 miles? Heavy new supply typically softens prices + rents 12–24 months out; constrained supply supports both.
Investment metrics
- 1% rule
- 1.38% ✓
- Cap rate
- 8.22%
- Cash-on-cash
- 6.89%
- DSCR
- 1.31
- GRM
- 6.0
CMA / ARV
No comps found within radius.
Projected returns pro-forma
-3.0% appreciation · 3.0% rent growth · sell at horizon
- IRR
- -5.6%
- Equity multiple
- 0.79×
- Total profit
- $-4,061
- Equity at exit
- $10,437
- IRR
- 4.3%
- Equity multiple
- 1.31×
- Total profit
- $6,167
- Equity at exit
- $6,052
Cash invested: $19,600 (down + closing). Projections, not guarantees.
Landlord ↔ Tenant lean methodology
- Overall (STATE)
- 62 Landlord-Friendly
- State Pennsylvania
- 62 Landlord-Friendly · EVEN
- County
- — inherits STATE
- City
- — inherits STATE
ZIP-level market 16028
- Home prices YoY
- -1.9%
- Active inventory
- 10
- Price-to-rent
- 6.0×
Monthly cashflow live
- Estimated rent
- $968 medium interval (Pro) →
- Mortgage (P&I)
- −$367
- Tax from tax record
- −$256 /mo · $3,068/yr
- Insurance
- −$29
- HOA
- −$0
- Vacancy / Maint / Mgmt
- −$203
- Net cashflow
- $112
Break-even live
UW: 25.0% down · 7.5% · 30yr · 1.5% tax · 5.0% vac · 8.0% maint · 8.0% mgmt
Financing live
Cash to close
- Down payment
- $17,500
- Closing costs
- $2,100
- Reserves months
- —
- Total cash needed
- —
Loan-product check · same deal, 3 products live
Conventional
25% down · 7.5% · 30yr
- Down + closing
- —
- Monthly P&I
- —
- Monthly cashflow
- —
- DSCR
- —
- Eligible?
- —
Personal DTI + credit; lowest rate.
DSCR
20% down · 8.5% · 30yr
- Down + closing
- —
- Monthly P&I
- —
- Monthly cashflow
- —
- DSCR
- —
- Eligible?
- —
No personal income docs; deal must DSCR.
Hard money
10% down · 12.0% · 12mo
- Down + closing
- —
- Monthly P&I
- —
- Monthly cashflow
- —
- DSCR
- —
- Eligible?
- —
Short-term bridge; refi at stabilization.
Listing history 17 events
-
2026-06-18days on market $69,999 Active 22 DOM
-
2026-06-17days on market $69,999 Active 21 DOM
-
2026-06-16days on market $69,999 Active 20 DOM
-
2026-06-15days on market $69,999 Active 19 DOM
-
2026-06-13days on market $69,999 Active 17 DOM
-
2026-06-12days on market $69,999 Active 16 DOM
-
2026-06-09days on market $69,999 Active 13 DOM
-
2026-06-08days on market $69,999 Active 12 DOM
-
2026-06-08days on market $69,999 Active 11 DOM
-
2026-06-07remarks 549-char remark
-
2026-06-07days on market $69,999 Active 10 DOM
-
2026-06-04days on market $69,999 Active 7 DOM
-
2026-06-02days on market $69,999 Active 6 DOM
-
2026-06-01days on market $69,999 Active 5 DOM
-
2026-05-31days on market $69,999 Active 4 DOM
-
2026-05-27$69,999 Active
-
2017-02-24soldstatus $16,000
ⓘ Source: listings_history table (triggers on properties + properties_extension) + one-shot
backfill from property_details.listing_events for pre-trigger history.
Tax reassessment forecast PA · Partial reset (capped growth)
- Current annual tax
- $3,068 · $256/mo
- Projected year-2 tax
- $3,068 · $256/mo
- Expected delta
- $0/yr ($0/mo · 0.0%)
ⓘ Screening estimate from a state-policy table — verify with the county assessor before closing.
Climate risk First Street
- Flood 1/10 Low FEMA zone X (unshaded) · 0% chance over 30 yrs
- Wildfire 1/10 Low
- Heat 3/10 Moderate 7 d/yr ≥98°F today · 18 d/yr by 30 yrs out
- Wind 2/10 Low
- Air quality 2/10 Low 1 unhealthy d/yr today · 3 by 30 yrs out
Nearby sold comps map
Loading sold comps map…
Walkable amenities ~0.75 mi
Loading nearby amenities…
Taxation est. · year 1
- Rental income
- $11,612
- − Mortgage interest
- −$3,921
- − Property taxes
- −$3,068
- − Insurance
- −$350
- − Repairs & maintenance
- −$929
- − Management
- −$929
- − Depreciation
- −$2,036
- Taxable income
- $378
- Est. tax owed @ 24.0%
- −$91
- After-tax cash flow
- $1,259/yr
For passive investors: Depreciation is non-cash, so a rental often shows a tax loss while cash-flowing — sheltering income. Rental losses are passive: they offset passive income freely, and up to $25,000/yr can offset ordinary (W-2) income if you actively participate and your MAGI is under $100k (phasing out to $0 by $150k); unused losses carry forward. On sale, claimed depreciation is recaptured at up to 25%, and gains may owe capital-gains tax (a 1031 exchange can defer both). Figures are a year-1 estimate at your 24.0% rate — not tax advice; consult a CPA.
Schools (NCES district)
- District
- Karns City Area SD
- NCES district ID
- 4209600
- Math proficiency
- 33% ▼ -14.00%
- Reading proficiency
- 51% ▼ -17.00%
- Median HH income
- $48,988
- Composite
- 35.99/100
- National rank
- #4792
- State rank
- #322 of 539 in PA
Livability — East Brady
- Score
- 64/100
- State rank
- #1240
- US rank
- #14847
Category grades
Schools grade is shown separately in the Schools card above.
Census & demographics
- Census place
- East Brady, PA
- Population (ZIP)
- 2,053
Population outlook (Clarion County) Hauer SSP2
- Today (2025)
- 37,796 people
- By 2030
- 36,830 · -2.6%
- By 2040
- 34,113 · -9.7%
- By 2050
- 31,092 · -17.7%
- By 2075
- 24,200 · -36.0%
- By 2100
- 18,737 · -50.4%
Race, ethnicity, and origin ACS 2023
- Neighborhood character
- Predominantly White (92%)
- Race & ethnicity
- White 92% Two or more races 7%
- Common ancestry
- Serbian 3% Lithuanian 2% Romanian 2%
- Foreign-born
- 1%
Political lean MEDSL · Clarion
- 2024 margin
- Solid R (+53.1) · D 23.1% · R 76.2%
- 2008→2024 swing
- -30.7pp toward R · 2008: -22.4pp · 2024: -53.1pp
- All cycles
- 2024: R+53.1 2020: R+50.8 2016: R+47.4 2012: R+36.1 2008: R+22.4
Not yet ingested
- Civics
- —
Market trends
- HPI YoY
- ▼ -4.47%
- Current HPI
- 231.9446
- Rent YoY
- —
- Metro
- —
- State GDP YoY
- ▲ 1.68%
- F500 in state
- 34
Industry mix (Fortune 500 HQ in PA)
| Industry | F500 HQs | Revenue |
|---|---|---|
| Healthcare | 2 | $309B |
|
||
| Insurance | 2 | $27B |
|
||
| Telecommunications / Media | 1 | $124B |
|
||
| Industrial Distribution | 1 | $22B |
|
||
| Financial Services | 1 | $20B |
|
||
| Chemicals / Materials | 1 | $18B |
|
||
Price history
+337.5% since first listed2 events — show timeline
- 2026-05-27 Listed $69,999 West Penn MLS
- 2017-02-24 Sold (Public Records) $16,000 Public Records
Property tax history
+19.9%/yrLatest (2026): $3,068 · +662.0% YoY. Source: county tax records.
Cash-flow waterfall
monthlySold comps — $/sqft
last 12 mo · ≤1 miLoading sold comps…