5549 E Beech St · Farmington, NM
Flood risk 1/10 · Minimal
- FEMA flood zone
- X (unshaded)
- Chance of flooding over 30 yrs
- 0.0%
- Est. flood insurance / yr
- $507 – $1,088
Fire risk 3/10 · Minor
- Est. fire insurance / yr
- $706 – $1,312
Heat risk 4/10 · Minor
- Hot days now (above 94°F)
- 7 days/yr
- Hot days in 30 yrs
- 19 days/yr
Wind risk 1/10 · Minimal
- Chance of severe wind over 30 yrs
- —
Air-quality risk 1/10 · Minimal
- Unhealthy air days now
- 0 days/yr
- Unhealthy air days in 30 yrs
- 0 days/yr
Risk factors via First Street. Map © Google.
Why this score? — see what drove the C+ grade
The composite is a weighted blend of 9 inputs, each scored 0–100. Each bar is that input's sub-score; the figure is the points it added to the 100-point composite (weight × sub-score).
- Cash flow +28.3/30.0
- DSCR +10.0/10.0
- ARV discount +7.5/15.0
- 1% rule +6.9/10.0
- Livability +3.3/5.0
- Schools +3.2/10.0
- Rent growth +2.5/5.0
- Condition / age +2.5/5.0
- Appreciation +0.0/10.0
$188,000
🖨 Deal sheet 📄 Offer letter ✓ Due diligence
Listing remarks MLS
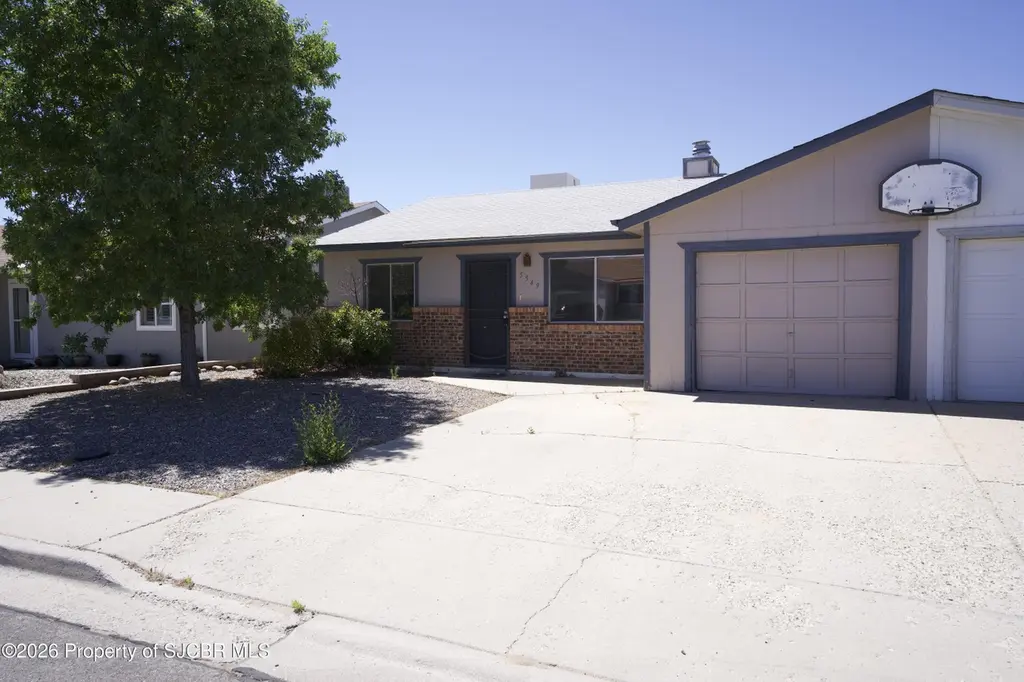
Picture perfect move-in ready town home in Foothills. Enjoy the fireplace in the large living room. Located in a quiet low traffic area just down the Street from Foothills Park, close to schools and shopping. A must-see home. See private remarks.
Key facts
- Foothills park
- Garage
- Built 1979
Tags
Property features AI
Exterior
- Parking: Attached garage (1 space)
- Utilities: Public water; Public sewer
- Home design: Townhouse; One level; House structure
- Construction: Wood siding construction
- Exterior features: Deck; Wood fencing; Lot in residential subdivision
Interior
- Kitchen: Gas range; Refrigerator; Appliances include dishwasher-equivalent not listed — primary listed kitchen appliances: Gas range, Refrigerator
- Bathrooms: 1 full bathroom
- Heating & cooling: Forced air heating; Natural gas heating
- Interior features: Living room fireplace (1); Washer and dryer; Gas range; Refrigerator
- Laundry & utility: Washer; Dryer
Neighborhood map
What this means for you Summary
Snapshot
- This is a 2-bed/1.0-bath townhouse listed at $188k.
Deal economics
- At list price, monthly cash flow is $604 ($7k/yr) — positive.
- The deal already cash-flows at list — no discount required.
- Meets the 1% rule at list price ($2k rent vs $188k).
Location & tenants
- Location reads 66/100 on livability (#38 in NM) — a middle-class / working-renter tenant base. Strengths: cost of living A+, housing A+, health & safety A+; Watch: employment C-, crime F, commute F.
- Farmington Municipal Schools (urban): math 23% / reading 43% proficiency, ranked #23 of 95 in NM (top 24%) — families likely to look elsewhere, expect single-tenant / working-renter base with shorter leases.
- Zoned schools: Country Club Elementary (525 students, 29% FRL); Heights Middle School (718 students, 44% FRL); Piedra Vista High (math 27% / reading 52%, grade F, #68 of 110 statewide, top 62%, 1,578 students, 47% FRL).
- Market conditions: 89 active listings in the ZIP; 2 comparable units currently listed for rent nearby; 78 units permitted in San Juan County in 2024 (8 in 5+ unit buildings).
Forward outlook
- Local home prices are declining (-3.0%/yr); year-one equity from $1k of loan paydown is wiped out by about $6k of value loss. Plan a longer hold.
- San Juan County population projected at -51% by 2050 — secular population decline; favor cash flow + early exit over multi-decade hold.
- At projected returns (-3.0% appreciation + 3.0% rent growth), your $53k cash investment doubles in ~9 years — after that, you're playing with house money.
Negotiation context
- Only 3 days on market — expect competitive offers; lowballing is unlikely to land.
- 2 sale attempts since 4y ago with the ask held roughly flat each time — persistent listings suggest the price (not the market) is what's stuck; bring a comps-based counter.
Questions for the listing agent
- Built in 1979 — when were the roof, HVAC, electrical panel, plumbing, and water heater last replaced?
- Is there a deadline driving the sale (1031 exchange, divorce, estate, relocation)? That informs how much negotiation room exists.
- Schools are D-rated, which usually means shorter tenancies and higher turnover. Who's the typical renter profile here, and what's been the actual vacancy rate?
- Crime grade is F in this area — have there been break-ins, vandalism, or insurance claims at this property in the last 3 years? What carrier currently insures it and at what premium?
- What's the average days-on-market for RENTAL listings here right now (not sales)? A rising rental-DOM trend means longer vacancies and softer asking-rent achievability than the comps imply.
- What's the recent tenant-quality profile in this submarket — average credit score on applications, eviction rate, late-payment / NSF rate, and stable-employment percentage? A property-management company in the area should have these aggregated.
- How much new for-sale + rental construction is in the pipeline within 1–3 miles? Heavy new supply typically softens prices + rents 12–24 months out; constrained supply supports both.
Investment metrics
- 1% rule
- 1.19% ✓
- Cap rate
- 10.15%
- Cash-on-cash
- 13.78%
- DSCR
- 1.61
- GRM
- 7.0
CMA / ARV
No comps found within radius.
Projected returns pro-forma
-3.0% appreciation · 3.0% rent growth · sell at horizon
- IRR
- 3.9%
- Equity multiple
- 1.15×
- Total profit
- $7,986
- Equity at exit
- $28,031
- IRR
- 13.4%
- Equity multiple
- 2.07×
- Total profit
- $56,332
- Equity at exit
- $16,255
Cash invested: $52,640 (down + closing). Projections, not guarantees.
Landlord ↔ Tenant lean methodology
- Overall (STATE)
- 55 Moderately Landlord-Leaning
- State New Mexico
- 55 Moderately Landlord-Leaning · D+3
- County
- — inherits STATE
- City
- — inherits STATE
ZIP-level market 87402
- Active inventory
- 89
- Price-to-rent
- 7.0×
Monthly cashflow live
- Estimated rent
- $2,242 medium interval (Pro) →
- Mortgage (P&I)
- −$986
- Tax from tax record
- −$103 /mo · $1,233/yr
- Insurance
- −$78
- HOA
- −$0
- Vacancy / Maint / Mgmt
- −$471
- Net cashflow
- $604
Break-even live
UW: 25.0% down · 7.5% · 30yr · 1.5% tax · 5.0% vac · 8.0% maint · 8.0% mgmt
Financing live
Cash to close
- Down payment
- $47,000
- Closing costs
- $5,640
- Reserves months
- —
- Total cash needed
- —
Loan-product check · same deal, 3 products live
Conventional
25% down · 7.5% · 30yr
- Down + closing
- —
- Monthly P&I
- —
- Monthly cashflow
- —
- DSCR
- —
- Eligible?
- —
Personal DTI + credit; lowest rate.
DSCR
20% down · 8.5% · 30yr
- Down + closing
- —
- Monthly P&I
- —
- Monthly cashflow
- —
- DSCR
- —
- Eligible?
- —
No personal income docs; deal must DSCR.
Hard money
10% down · 12.0% · 12mo
- Down + closing
- —
- Monthly P&I
- —
- Monthly cashflow
- —
- DSCR
- —
- Eligible?
- —
Short-term bridge; refi at stabilization.
Rent comps 2 comps
| Address | Beds | Baths | Sqft | Rent | $/sqft | DOM | Units | Dist |
|---|---|---|---|---|---|---|---|---|
| 5542 Cypress St Farmington, NM | 3.0 | 2.0 | 1276 | $2,400 | $1.88 | 43d | 1 | 0.04mi |
| 5200 Villa View Dr Unit 16C Farmington, NM | 2.0 | 2.5 | 1272 | $1,600 | $1.26 | 43d | 1 | 0.41mi |
Listing history 4 events
-
2026-06-09status $188,000 Pending 3 DOM
-
2026-06-08days on market $188,000 Active 3 DOM
-
2026-06-07remarks 510-char remark
-
2026-06-07$188,000 Active 2 DOM
ⓘ Source: listings_history table (triggers on properties + properties_extension) + one-shot
backfill from property_details.listing_events for pre-trigger history.
Tax reassessment forecast NM · Resets to sale price
- Current annual tax
- $1,233 · $103/mo
- Projected year-2 tax
- $1,504 · $125/mo
- Expected delta
- +$271/yr (+$23/mo · 22.0%)
ⓘ Screening estimate from a state-policy table — verify with the county assessor before closing.
Climate risk First Street
- Flood 1/10 Low FEMA zone X (unshaded) · 0% chance over 30 yrs
- Wildfire 3/10 Moderate
- Heat 4/10 Moderate 7 d/yr ≥94°F today · 19 d/yr by 30 yrs out
- Wind 1/10 Low
- Air quality 1/10 Low 0 unhealthy d/yr today · 0 by 30 yrs out
Nearby sold comps map
Loading sold comps map…
Walkable amenities ~0.75 mi
Loading nearby amenities…
Taxation est. · year 1
- Rental income
- $26,907
- − Mortgage interest
- −$10,531
- − Property taxes
- −$1,233
- − Insurance
- −$940
- − Repairs & maintenance
- −$2,153
- − Management
- −$2,153
- − Depreciation
- −$5,469
- Taxable income
- $4,429
- Est. tax owed @ 24.0%
- −$1,063
- After-tax cash flow
- $6,190/yr
For passive investors: Depreciation is non-cash, so a rental often shows a tax loss while cash-flowing — sheltering income. Rental losses are passive: they offset passive income freely, and up to $25,000/yr can offset ordinary (W-2) income if you actively participate and your MAGI is under $100k (phasing out to $0 by $150k); unused losses carry forward. On sale, claimed depreciation is recaptured at up to 25%, and gains may owe capital-gains tax (a 1031 exchange can defer both). Figures are a year-1 estimate at your 24.0% rate — not tax advice; consult a CPA.
Schools (NCES district)
- District
- Farmington Municipal Schools
- NCES district ID
- 3500990
- Math proficiency
- 23% —
- Reading proficiency
- 43% —
- Median HH income
- $51,365
- Composite
- 31.5/100
- National rank
- #11178
- State rank
- #23 of 95 in NM
Livability — Farmington
- Score
- 66/100
- State rank
- #38
- US rank
- #11926
Category grades
Schools grade is shown separately in the Schools card above.
Census & demographics
- Census place
- Farmington, NM
- City population
- 45,229
- Population (ZIP)
- 10,997
Population outlook (San Juan County) Hauer SSP2
- Today (2025)
- 95,201 people
- By 2030
- 84,154 · -11.6%
- By 2040
- 63,810 · -33.0%
- By 2050
- 46,929 · -50.7%
- By 2075
- 21,097 · -77.8%
- By 2100
- 9,410 · -90.1%
Race, ethnicity, and origin ACS 2023
- Neighborhood character
- Diverse neighborhood (Simpson 0.65)
- Race & ethnicity
- White 54% Hispanic / Latino 24% Native American 17% Two or more races 15%
- Hispanic origin (detail)
- Mexican 12%
- Common ancestry
- Italian 3% Slovak 2% Lithuanian 2%
- Foreign-born
- 2% · Canada
- Languages at home
- 87% English-only · Spanish 7% Russian/Polish/Slavic 1%
Political lean MEDSL · San Juan
- 2024 margin
- Solid R (+31.7) · D 33.0% · R 64.7% · Other 2.3%
- 2008→2024 swing
- -10.6pp toward R · 2008: -21.2pp · 2024: -31.7pp
- All cycles
- 2024: R+31.7 2020: R+28.3 2016: R+33.1 2012: R+28.5 2008: R+21.2
Not yet ingested
- Civics
- —
Market trends
- HPI YoY
- ▼ -117.39%
- Current HPI
- 207.275
- Rent YoY
- —
- Metro
- —
- State GDP YoY
- —
- F500 in state
- 0
Price history
+18.2% since first listed3 events — show timeline
- 2026-06-05 Listed $188,000 SJCMLS
- 2022-05-31 Sold (MLS) — SJCMLS
- 2022-05-13 Listed $159,000 SJCMLS
Property tax history
+3.3%/yrLatest (2025): $1,233 · -1.3% YoY. Source: county tax records.
Cash-flow waterfall
monthlySold comps — $/sqft
last 12 mo · ≤1 miLoading sold comps…