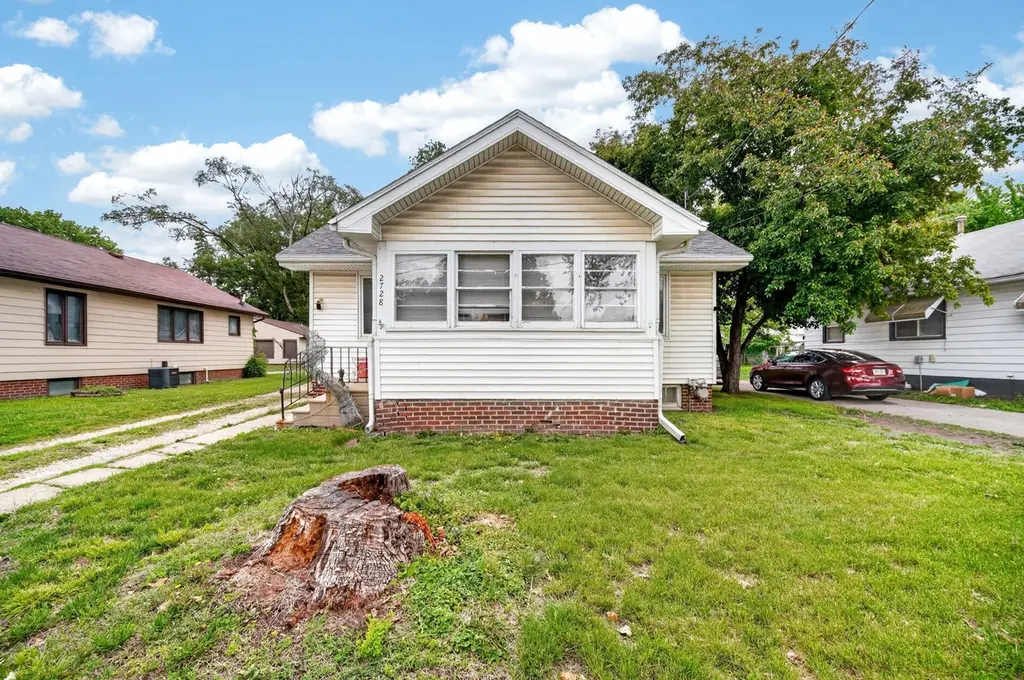
2728 Des Moines St · Des Moines, IA
Flood risk 1/10 · Minimal
- FEMA flood zone
- X (unshaded)
- Chance of flooding over 30 yrs
- 0.0%
- Est. flood insurance / yr
- $473 – $860
Fire risk 3/10 · Minor
- Est. fire insurance / yr
- $902 – $1,676
Heat risk 3/10 · Minor
- Hot days now (above 103°F)
- 7 days/yr
- Hot days in 30 yrs
- 15 days/yr
Wind risk 2/10 · Minimal
- Chance of severe wind over 30 yrs
- —
Air-quality risk 2/10 · Minimal
- Unhealthy air days now
- 1 days/yr
- Unhealthy air days in 30 yrs
- 2 days/yr
Risk factors via First Street. Map © Google.
Why this score? — see what drove the B- grade
The composite is a weighted blend of 9 inputs, each scored 0–100. Each bar is that input's sub-score; the figure is the points it added to the 100-point composite (weight × sub-score).
- Cash flow +25.3/30.0
- ARV discount +15.0/15.0
- DSCR +8.4/10.0
- 1% rule +6.8/10.0
- Livability +4.0/5.0
- Schools +3.8/10.0
- Rent growth +3.1/5.0
- Condition / age +2.5/5.0
- Appreciation +0.0/10.0
$109,000
🖨 Deal sheet 📄 Offer letter ✓ Due diligence
Listing remarks
This bungalow-style home in Northeast Des Moines offers a functional layout with character and opportunity throughout. Step into the enclosed front porch before entering the main living area, which connects comfortably to the dining space and kitchen. The main floor features two bedrooms and a full bathroom, while the finished upper level provides a third bedroom or flexible bonus space. The full basement includes laundry, storage, and additional usable space. Outside, the backyard offers room for recreation, gardening, or entertaining. Conveniently located near parks, schools, shopping, dining, and major commuter routes, this property combines practical living space with potential in an es
Key facts
- Finished upper level
- Backyard
- Full basement
Tags
Property features AI
Finance
- Other: Zoning: N3C
Exterior
- Security: Smoke detector(s)
- Utilities: Public water; Public sewer
- Home design: Wood-sided exterior; Brick/mortar foundation; Asphalt shingle roof
- Construction: Wood siding construction; Brick/mortar foundation; Asphalt shingle roof
- Exterior features: Enclosed porch; Screened porch
Interior
- Kitchen: Eat-in kitchen
- Bedrooms: 2 main-level bedrooms
- Flooring: Carpet; Hardwood
- Bathrooms: 1 full bathroom
- Heating & cooling: Central air conditioning; Forced air heating (natural gas)
- Interior features: Eat-in kitchen
Neighborhood map
What this means for you Summary
Snapshot
- This is a 2-bed/1.0-bath single-family listed at $109k.
Deal economics
- At list price, monthly cash flow is $249 ($3k/yr) — positive.
- The deal already cash-flows at list — no discount required.
- Meets the 1% rule at list price ($1k rent vs $109k).
- Cap rate 9.0% vs local median 3.1% in Des Moines — top-decile yield for the area; either an underpriced asset or a hidden risk that comps aren't pricing in. Stress-test before assuming the spread holds.
Location & tenants
- Location reads 81/100 on livability (#63 in IA, #1,432 nationally) — a professional / high-income tenant draw. Strengths: commute A+, cost of living A+, housing A+; Watch: employment C-, schools D+, crime F.
- Des Moines Independent Community School District (urban): math 43% / reading 46% proficiency, ranked #289 of 289 in IA (top 100%) — families likely to look elsewhere, expect single-tenant / working-renter base with shorter leases; 63% free/reduced lunch — lower-income household profile, screen leases tightly.
- Market conditions: Rents rising (+2.3%/yr); 357 active listings in the ZIP; 7 comparable units currently listed for rent nearby; rentals lingering (median 44d on market — plan ~5-8 weeks vacancy on turnover, expect pricing pressure); 71% of comp listings sitting > 30 days — soft ceiling on asking rent; 2,953 units permitted in Polk County in 2024 (540 in 5+ unit buildings).
Forward outlook
- Local home prices are declining (-3.0%/yr); year-one equity from $754 of loan paydown is wiped out by about $3k of value loss. Plan a longer hold.
- Polk County population projected at +37% by 2050 — long-run rental-demand tailwind backs the buy-and-hold thesis.
Negotiation context
- Only 9 days on market — expect competitive offers; lowballing is unlikely to land.
- 2 sale attempts with the ask held roughly flat each time — persistent listings suggest the price (not the market) is what's stuck; bring a comps-based counter.
- Current owner paid $67k; list at $109k implies a 63% gain — meaningful room to come down on a strong offer.
Risks & watch-outs
- Watch-outs: built in 1926 — expect roof / HVAC / electrical / plumbing capex.
Questions for the listing agent
- Built in 1926 — when were the roof, HVAC, electrical panel, plumbing, and water heater last replaced?
- Is there a deadline driving the sale (1031 exchange, divorce, estate, relocation)? That informs how much negotiation room exists.
- Schools are D-rated, which usually means shorter tenancies and higher turnover. Who's the typical renter profile here, and what's been the actual vacancy rate?
- Crime grade is F in this area — have there been break-ins, vandalism, or insurance claims at this property in the last 3 years? What carrier currently insures it and at what premium?
- What's the average days-on-market for RENTAL listings here right now (not sales)? A rising rental-DOM trend means longer vacancies and softer asking-rent achievability than the comps imply.
- What's the recent tenant-quality profile in this submarket — average credit score on applications, eviction rate, late-payment / NSF rate, and stable-employment percentage? A property-management company in the area should have these aggregated.
- How much new for-sale + rental construction is in the pipeline within 1–3 miles? Heavy new supply typically softens prices + rents 12–24 months out; constrained supply supports both.
Investment metrics
- 1% rule
- 1.18% ✓
- Cap rate
- 9.03%
- Cash-on-cash
- 9.78%
- DSCR
- 1.44
- GRM
- 7.1
CMA / ARV
- ARV (on-the-fly)
- $192,469
- Comps found
- 12
Show comp detail 12 sales within ~0.75 mi
| Address | Dist | Beds/Ba | Sqft | Sold | Price | $/sf | Match |
|---|---|---|---|---|---|---|---|
| 2432 Maple St | 0.39mi | 2/2.0 | 980 (+0%) | 1mo | $209,000 | $213 | 76 |
| 2925 Walker St | 0.28mi | 3/1.0 (+1) | 1,000 (+2%) | 3mo | $192,500 | $193 | 76 |
| 2841 Des Moines St | 0.15mi | 3/2.0 (+1) | 920 (-6%) | 4mo | $201,000 | $218 | 71 |
| 2805 Des Moines St | 0.08mi | 2/1.0 | 832 (-15%) | 2mo | $101,000 | $121 | 70 |
| 903 E 27th Ct | 0.19mi | 3/1.0 (+1) | 1,086 (+11%) | 2mo | $220,000 | $203 | 66 |
| 2524 E Walnut St | 0.35mi | 3/1.0 (+1) | 1,071 (+10%) | 2mo | $211,000 | $197 | 61 |
| 3104 Garfield Ave | 0.61mi | 1/1.0 (-1) | 1,027 (+5%) | 1mo | $70,000 | $68 | 58 |
| 3113 State Ave | 0.52mi | 2/1.5 | 880 (-10%) | 2mo | $165,000 | $188 | 56 |
| 2428 Des Moines St | 0.37mi | 2/1.5 | 832 (-15%) | 2mo | $140,000 | $168 | 54 |
| 807 E 23rd Ct | 0.51mi | 3/2.0 (+1) | 1,105 (+13%) | 1mo | $250,000 | $226 | 45 |
| 2224 Capitol Ave | 0.65mi | 3/2.0 (+1) | 1,082 (+11%) | 3mo | $110,000 | $102 | 40 |
| 2924 Kinsey Ave | 0.74mi | 3/2.0 (+1) | 864 (-12%) | 2mo | $205,000 | $237 | 36 |
Match score weights: distance 35% · size 25% · config 20% · recency 20%. Top-matched comps best support the ARV.
Projected returns pro-forma
-3.0% appreciation · 2.29% rent growth · sell at horizon
- IRR
- -2.4%
- Equity multiple
- 0.91×
- Total profit
- $-2,705
- Equity at exit
- $16,252
- IRR
- 6.5%
- Equity multiple
- 1.47×
- Total profit
- $14,469
- Equity at exit
- $9,424
Cash invested: $30,520 (down + closing). Projections, not guarantees.
Landlord ↔ Tenant lean methodology
- Overall (STATE)
- 83 Strongly Landlord-Friendly
- State Iowa
- 83 Strongly Landlord-Friendly · R+6
- County
- — inherits STATE
- City
- — inherits STATE
ZIP-level market 50317
- Rents YoY
- 2.3%
- Active inventory
- 357
- Price-to-rent
- 7.1×
Monthly cashflow live
- Estimated rent
- $1,284 high interval (Pro) →
- Mortgage (P&I)
- −$572
- Tax from tax record
- −$148 /mo · $1,782/yr
- Insurance
- −$45
- HOA
- −$0
- Vacancy / Maint / Mgmt
- −$270
- Net cashflow
- $249
Break-even live
UW: 25.0% down · 7.5% · 30yr · 1.5% tax · 5.0% vac · 8.0% maint · 8.0% mgmt
Financing live
Cash to close
- Down payment
- $27,250
- Closing costs
- $3,270
- Reserves months
- —
- Total cash needed
- —
Loan-product check · same deal, 3 products live
Conventional
25% down · 7.5% · 30yr
- Down + closing
- —
- Monthly P&I
- —
- Monthly cashflow
- —
- DSCR
- —
- Eligible?
- —
Personal DTI + credit; lowest rate.
DSCR
20% down · 8.5% · 30yr
- Down + closing
- —
- Monthly P&I
- —
- Monthly cashflow
- —
- DSCR
- —
- Eligible?
- —
No personal income docs; deal must DSCR.
Hard money
10% down · 12.0% · 12mo
- Down + closing
- —
- Monthly P&I
- —
- Monthly cashflow
- —
- DSCR
- —
- Eligible?
- —
Short-term bridge; refi at stabilization.
Rent comps 7 comps
| Address | Beds | Baths | Sqft | Rent | $/sqft | DOM | Units | Dist |
|---|---|---|---|---|---|---|---|---|
| 2726 Des Moines St Des Moines, IA | 2.0 | 1.0 | 975 | $1,295 | $1.33 | 43d | 1 | 0.02mi |
| 2120 Capitol Ave Des Moines, IA | 3.0 | 1.0 | 973 | $1,395 | $1.43 | 43d | 1 | 0.80mi |
| 1726 E 24th St Des Moines, IA | 3.0 | 1.0 | 850 | $1,295 | $1.52 | 43d | 1 | 1.01mi |
| 1220 E 37th Ct Des Moines, IA | 2.0 | 1.0 | 560 | $950 | $1.70 | 23d | 1 | 1.15mi |
| 2121 E 23rd St Des Moines, IA | 3.0 | 1.0 | 972 | $1,395 | $1.44 | 43d | 1 | 1.27mi |
| 1713 Lyon St Des Moines, IA | 3.0 | 1.0 | 834 | $1,045 | $1.25 | 21d | 1 | 1.35mi |
| 410 E 17th St Des Moines, IA | 3.0 | 1.0 | 1000 | $1,695 | $1.70 | 43d | 1 | 1.36mi |
Listing history 8 events
-
2026-06-07statusdays on market $109,000 Pending 9 DOM
-
2026-06-05days on market $109,000 Active 7 DOM
-
2026-06-03days on market $109,000 Active 6 DOM
-
2026-06-03status $109,000 Active 5 DOM
-
2026-05-22$109,000 Active
-
2025-05-12historical
-
2025-04-24$135,000 Active
-
2010-09-03soldstatus $67,000
ⓘ Source: listings_history table (triggers on properties + properties_extension) + one-shot
backfill from property_details.listing_events for pre-trigger history.
Tax reassessment forecast IA · Partial reset (capped growth)
- Current annual tax
- $1,782 · $148/mo
- Projected year-2 tax
- $1,782 · $148/mo
- Expected delta
- $0/yr ($0/mo · 0.0%)
ⓘ Screening estimate from a state-policy table — verify with the county assessor before closing.
Climate risk First Street
- Flood 1/10 Low FEMA zone X (unshaded) · 0% chance over 30 yrs
- Wildfire 3/10 Moderate
- Heat 3/10 Moderate 7 d/yr ≥103°F today · 15 d/yr by 30 yrs out
- Wind 2/10 Low
- Air quality 2/10 Low 1 unhealthy d/yr today · 2 by 30 yrs out
Nearby sold comps map
Loading sold comps map…
Walkable amenities ~0.75 mi
Loading nearby amenities…
Taxation est. · year 1
- Rental income
- $15,406
- − Mortgage interest
- −$6,106
- − Property taxes
- −$1,782
- − Insurance
- −$545
- − Repairs & maintenance
- −$1,233
- − Management
- −$1,233
- − Depreciation
- −$3,171
- Taxable income
- $1,338
- Est. tax owed @ 24.0%
- −$321
- After-tax cash flow
- $2,664/yr
For passive investors: Depreciation is non-cash, so a rental often shows a tax loss while cash-flowing — sheltering income. Rental losses are passive: they offset passive income freely, and up to $25,000/yr can offset ordinary (W-2) income if you actively participate and your MAGI is under $100k (phasing out to $0 by $150k); unused losses carry forward. On sale, claimed depreciation is recaptured at up to 25%, and gains may owe capital-gains tax (a 1031 exchange can defer both). Figures are a year-1 estimate at your 24.0% rate — not tax advice; consult a CPA.
Schools (NCES district)
- District
- Des Moines Independent Community School District
- NCES district ID
- 1908970
- Math proficiency
- 43% ▼ -6.00%
- Reading proficiency
- 46% ▼ -1.00%
- Median HH income
- $45,905
- Composite
- 37.83/100
- National rank
- #4331
- State rank
- #289 of 289 in IA
Livability — Des Moines
- Score
- 81/100
- State rank
- #63
- US rank
- #1432
Category grades
Schools grade is shown separately in the Schools card above.
Census & demographics
- Census place
- Des Moines, IA
- County
- Polk County · 453,298 people
- City population
- 203,612
- Metro
- Des Moines-West Des Moines, IA
- Population (ZIP)
- 36,548
- Household income
- $65,617
- Rent vs Own
- Severe rent burden
- 716.0
Population outlook (Polk County) Hauer SSP2
- Today (2025)
- 548,042 people
- By 2030
- 588,557 · +7.4%
- By 2040
- 670,629 · +22.4%
- By 2050
- 752,830 · +37.4%
- By 2075
- 955,069 · +74.3%
- By 2100
- 1,115,436 · +103.5%
Race, ethnicity, and origin ACS 2023
- Neighborhood character
- Majority White (65%)
- Race & ethnicity
- White 65% Hispanic / Latino 19% Two or more races 10% Black 10% Asian 3%
- Hispanic origin (detail)
- Mexican 15% Puerto Rican 1%
- Common ancestry
- Portuguese 3% Iranian 2% Swiss 1%
- Foreign-born
- 12% · Canada
- Languages at home
- 80% English-only · Spanish 13% Other Asian/Pacific 2%
Political lean MEDSL · Polk
- 2024 margin
- D (+10.9) · D 54.8% · R 43.9% · Other 1.3%
- 2008→2024 swing
- -3.7pp toward R · 2008: 14.6pp · 2024: 10.9pp
- All cycles
- 2024: D+10.9 2020: D+15.2 2016: D+11.5 2012: D+14.2 2008: D+14.6
Not yet ingested
- Civics
- —
Market trends
- HPI YoY
- ▼ -235.00%
- Current HPI
- 281.7409
- Rent YoY
- ▲ 2.29%
- Metro
- Des Moines-West Des Moines, IA
- State GDP YoY
- ▲ 2.48%
- F500 in state
- 4
Industry mix (Fortune 500 HQ in IA)
| Industry | F500 HQs | Revenue |
|---|---|---|
| Financial Services | 1 | $16B |
|
||
| Retail / Convenience | 1 | $15B |
|
||
Price history
+62.7% since first listed4 events — show timeline
- 2026-05-22 Listed $109,000 DMMLS
- 2025-05-12 Listing Removed — DMMLS
- 2025-04-24 Listed $135,000 DMMLS
- 2010-09-03 Sold (Public Records) $67,000 Public Records
Property tax history
+0.8%/yrLatest (2025): $1,782 · -4.9% YoY. Source: county tax records.
Cash-flow waterfall
monthlySold comps — $/sqft
last 12 mo · ≤1 miLoading sold comps…