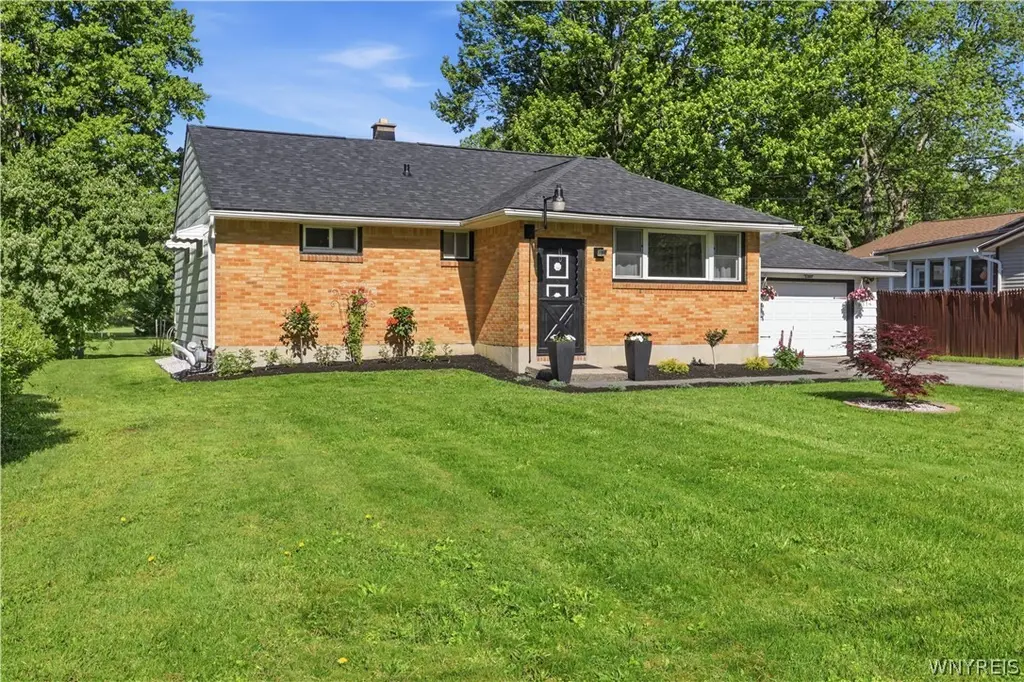
3314 Sweet Home Rd · North Tonawanda, NY
Flood risk 3/10 · Minor
- FEMA flood zone
- X (shaded)
- Chance of flooding over 30 yrs
- 0.17%
- Est. flood insurance / yr
- $473 – $860
Fire risk 4/10 · Minor
- Est. fire insurance / yr
- $691 – $1,283
Heat risk 2/10 · Minimal
- Hot days now (above 94°F)
- 7 days/yr
- Hot days in 30 yrs
- 15 days/yr
Wind risk 1/10 · Minimal
- Chance of severe wind over 30 yrs
- —
Air-quality risk 2/10 · Minimal
- Unhealthy air days now
- 1 days/yr
- Unhealthy air days in 30 yrs
- 3 days/yr
Risk factors via First Street. Map © Google.
Why this score? — see what drove the D- grade
The composite is a weighted blend of 9 inputs, each scored 0–100. Each bar is that input's sub-score; the figure is the points it added to the 100-point composite (weight × sub-score).
- Cash flow +11.8/30.0
- ARV discount +7.5/15.0
- Schools +4.5/10.0
- Livability +4.2/5.0
- DSCR +3.5/10.0
- 1% rule +3.4/10.0
- Rent growth +2.5/5.0
- Condition / age +2.5/5.0
- Appreciation +0.0/10.0
$269,990
🖨 Deal sheet 📄 Offer letter ✓ Due diligence
Listing remarks MLS
Three bedroom brick front home in Sweet Home School District. One car garage with breezeway room transitioning you to the large eat-in kitchen. Living room with hardwood floors that continue down the hallway and through each of the three bedrooms. Large full, dry basement. New Hot water tank within past 2 years. Backyard is huge (500ft deep) and provides a true, private country feel, complete with two 12' x 14' sheds and chicken coop! Just cosmetic updates to make this home shine. Offers will be reviewed on Tuesday 8/8 at 5PM
Key facts
- Incredible lot
- Fishing docks
- Trailer boat ramp
Tags
Property features AI
Finance
- HOA & community: Trails/paths nearby
Exterior
- Parking: Attached garage (1 car)
- Utilities: High-speed internet available; Public water connected; Sewer connected
- Home design: Single-story; Resale property
- Construction: Brick construction; Asphalt roof; Poured foundation; Existing (built previously)
- Exterior features: Blacktop driveway; Shed(s) / storage; Near public transit; Rectangular residential lot, 75 x 500
Interior
- Kitchen: Electric cooktop
- Bedrooms: 3 main-level bedrooms
- Flooring: Hardwood; Vinyl; Varied flooring
- Bathrooms: 1 full bathroom (main level)
- Heating & cooling: Gas forced-air heating
- Interior features: Ceiling fan(s); Eat-in kitchen; Full basement with sump pump; Laundry area in basement; 6 total rooms
- Laundry & utility: Laundry located in basement; Gas water heater
Neighborhood map
What this means for you Summary
Snapshot
- This is a 3-bed/1.0-bath single-family listed at $270k.
Deal economics
- At list price, monthly cash flow is $-72 ($-866/yr) — negative.
- To cash-flow at today's rent, offer at most $257k (4.7% below list).
- To meet the 1% rule (rent ≥ 1% of price), the offer needs to be $226k (16.2% below list).
- Recommended offer: $226k (16.2% below list) — sets the bar for 1% rule.
- Cap rate 6.0% vs local median 4.0% in North Tonawanda — top-decile yield for the area; either an underpriced asset or a hidden risk that comps aren't pricing in. Stress-test before assuming the spread holds.
Location & tenants
- Location reads 85/100 on livability (#30 in NY, #518 nationally) — a professional / high-income tenant draw. Strengths: commute A+, housing A+, health & safety A+.
- Sweet Home Central School District (suburban): math 46% / reading 59% proficiency, ranked #342 of 590 in NY (top 58%) — acceptable for families but not a draw, mixed tenant base, ~2y average lease.
- Market conditions: 94 active listings in the ZIP; 3 comparable units currently listed for rent nearby; rentals at typical pace (median 16d on market — plan ~3-4 weeks tenant-placement turnaround); 1,244 units permitted in Erie County in 2024 (563 in 5+ unit buildings).
- This rent runs 36% of the median local income ($75k/yr) — at the standard rent-burdened threshold; future hikes will face affordability resistance.
Forward outlook
- Local home prices are declining (-3.0%/yr); year-one equity from $2k of loan paydown is wiped out by about $8k of value loss. Plan a longer hold.
Negotiation context
- Only 3 days on market — expect competitive offers; lowballing is unlikely to land.
- 2 sale attempts since 3y ago with the ask held roughly flat each time — persistent listings suggest the price (not the market) is what's stuck; bring a comps-based counter.
- Current owner paid $200k; 35% above their basis — modest negotiation headroom, anchor on the comps not their cost.
Questions for the listing agent
- What do current leases actually rent for vs. the listed asking? Can we see a recent rent roll and the last 12 months of T-12 income?
- Built in 1964 — when were the roof, HVAC, electrical panel, plumbing, and water heater last replaced?
- Is there a deadline driving the sale (1031 exchange, divorce, estate, relocation)? That informs how much negotiation room exists.
- Schools are B-rated — typically a magnet for longer-tenancy family renters. What's the average tenant stay here, and is there a school-zone premium baked into asking?
- The area grade is low — what's the realistic commute time and amenity access for the typical tenant pool here? Any planned neighborhood developments (good or bad) we should know about?
- What's the average days-on-market for RENTAL listings here right now (not sales)? A rising rental-DOM trend means longer vacancies and softer asking-rent achievability than the comps imply.
- What's the recent tenant-quality profile in this submarket — average credit score on applications, eviction rate, late-payment / NSF rate, and stable-employment percentage? A property-management company in the area should have these aggregated.
- How much new for-sale + rental construction is in the pipeline within 1–3 miles? Heavy new supply typically softens prices + rents 12–24 months out; constrained supply supports both.
Investment metrics
- 1% rule
- 0.84% ✗
- Cap rate
- 5.97%
- Cash-on-cash
- -1.15%
- DSCR
- 0.95
- GRM
- 9.9
CMA / ARV
No comps found within radius.
Projected returns pro-forma
-3.0% appreciation · 3.0% rent growth · sell at horizon
- IRR
- -18.2%
- Equity multiple
- 0.36×
- Total profit
- $-48,318
- Equity at exit
- $40,256
- IRR
- -10.4%
- Equity multiple
- 0.37×
- Total profit
- $-47,872
- Equity at exit
- $23,344
Cash invested: $75,597 (down + closing). Projections, not guarantees.
Landlord ↔ Tenant lean methodology
- Overall (STATE)
- 15 Strongly Tenant-Friendly
- State New York
- 15 Strongly Tenant-Friendly · D+10
- County
- — inherits STATE
- City
- — inherits STATE
ZIP-level market 14228
- Home prices YoY
- -31.9%
- Active inventory
- 94
- Price-to-rent
- 9.9×
Monthly cashflow live
- Estimated rent
- $2,263 medium interval (Pro) →
- Mortgage (P&I)
- −$1,416
- Tax from tax record
- −$332 /mo · $3,979/yr
- Insurance
- −$112
- HOA
- −$0
- Vacancy / Maint / Mgmt
- −$475
- Net cashflow
- $-72
Break-even live
UW: 25.0% down · 7.5% · 30yr · 1.5% tax · 5.0% vac · 8.0% maint · 8.0% mgmt
Financing live
Cash to close
- Down payment
- $67,498
- Closing costs
- $8,100
- Reserves months
- —
- Total cash needed
- —
Loan-product check · same deal, 3 products live
Conventional
25% down · 7.5% · 30yr
- Down + closing
- —
- Monthly P&I
- —
- Monthly cashflow
- —
- DSCR
- —
- Eligible?
- —
Personal DTI + credit; lowest rate.
DSCR
20% down · 8.5% · 30yr
- Down + closing
- —
- Monthly P&I
- —
- Monthly cashflow
- —
- DSCR
- —
- Eligible?
- —
No personal income docs; deal must DSCR.
Hard money
10% down · 12.0% · 12mo
- Down + closing
- —
- Monthly P&I
- —
- Monthly cashflow
- —
- DSCR
- —
- Eligible?
- —
Short-term bridge; refi at stabilization.
Rent comps 3 comps
| Address | Beds | Baths | Sqft | Rent | $/sqft | DOM | Units | Dist |
|---|---|---|---|---|---|---|---|---|
| 157 Fairgreen Dr Unit Right side Buffalo, NY | 3.0 | 1.5 | 1500 | $2,300 | $1.53 | 1d | 1 | 0.39mi |
| 1 Apollo Dr Buffalo, NY | 2.0 | 2.5 | 988 | $2,150 | $2.18 | 16d | 1 | 0.99mi |
| 133 Sunshine Dr Buffalo, NY | 3.0 | 1.0 | 1300 | $2,100 | $1.62 | 16d | 1 | 1.50mi |
Listing history 2 events
-
2026-06-07remarks 687-char remark
-
2026-06-07$269,990 Pending 3 DOM
ⓘ Source: listings_history table (triggers on properties + properties_extension) + one-shot
backfill from property_details.listing_events for pre-trigger history.
Tax reassessment forecast NY · Partial reset (capped growth)
- Current annual tax
- $3,979 · $332/mo
- Projected year-2 tax
- $4,271 · $356/mo
- Expected delta
- +$292/yr (+$24/mo · 7.3%)
ⓘ Screening estimate from a state-policy table — verify with the county assessor before closing.
Climate risk First Street
- Flood 3/10 Moderate FEMA zone X (shaded) · 17% chance over 30 yrs
- Wildfire 4/10 Moderate
- Heat 2/10 Low 7 d/yr ≥94°F today · 15 d/yr by 30 yrs out
- Wind 1/10 Low
- Air quality 2/10 Low 1 unhealthy d/yr today · 3 by 30 yrs out
Nearby sold comps map
Loading sold comps map…
Walkable amenities ~0.75 mi
Loading nearby amenities…
Taxation est. · year 1
- Rental income
- $27,156
- − Mortgage interest
- −$15,124
- − Property taxes
- −$3,979
- − Insurance
- −$1,350
- − Repairs & maintenance
- −$2,172
- − Management
- −$2,172
- − Depreciation
- −$7,854
- Taxable loss
- −$5,496
- Est. tax savings @ 24.0%
- +$1,319
- After-tax cash flow
- $453/yr
For passive investors: Depreciation is non-cash, so a rental often shows a tax loss while cash-flowing — sheltering income. Rental losses are passive: they offset passive income freely, and up to $25,000/yr can offset ordinary (W-2) income if you actively participate and your MAGI is under $100k (phasing out to $0 by $150k); unused losses carry forward. On sale, claimed depreciation is recaptured at up to 25%, and gains may owe capital-gains tax (a 1031 exchange can defer both). Figures are a year-1 estimate at your 24.0% rate — not tax advice; consult a CPA.
Schools (NCES district)
- District
- Sweet Home Central School District
- NCES district ID
- 3628500
- Math proficiency
- 46% ▼ -12.00%
- Reading proficiency
- 59% ▲ 4.00%
- Median HH income
- $48,509
- Composite
- 44.67/100
- National rank
- #2765
- State rank
- #342 of 590 in NY
Livability — North Tonawanda
- Score
- 85/100
- State rank
- #30
- US rank
- #518
Category grades
Schools grade is shown separately in the Schools card above.
Census & demographics
- County
- Erie County · 714,559 people
- City population
- 44,241
- Metro
- Buffalo-Cheektowaga, NY
- Population (ZIP)
- 25,350
- Household income
- $74,871
- Rent vs Own
- Severe rent burden
- 1566.0
Population outlook (Erie County) Hauer SSP2
- Today (2025)
- 933,037 people
- By 2030
- 935,181 · +0.2%
- By 2040
- 928,531 · -0.5%
- By 2050
- 905,725 · -2.9%
- By 2075
- 834,037 · -10.6%
- By 2100
- 708,033 · -24.1%
Race, ethnicity, and origin ACS 2023
- Neighborhood character
- Predominantly White (74%)
- Race & ethnicity
- White 74% Asian 13% Black 5% Hispanic / Latino 5% Two or more races 5%
- Hispanic origin (detail)
- Puerto Rican 3%
- Common ancestry
- Romanian 13% Scotch-Irish 2% Lithuanian 1%
- Foreign-born
- 17% · China, Canada, South Korea
- Languages at home
- 78% English-only · Chinese 6% Other Indo-European 4% Russian/Polish/Slavic 3%
Political lean MEDSL · Erie
- 2024 margin
- Lean D (+9.7) · D 54.8% · R 45.2%
- 2008→2024 swing
- -7.9pp toward R · 2008: 17.5pp · 2024: 9.7pp
- All cycles
- 2024: D+9.7 2020: D+14.7 2016: D+4.8 2012: D+15.6 2008: D+17.5
Not yet ingested
- Civics
- —
Market trends
- HPI YoY
- ▼ -148.08%
- Current HPI
- 316.3097
- Rent YoY
- —
- Metro
- Buffalo-Cheektowaga, NY
- State GDP YoY
- ▲ 2.60%
- F500 in state
- 92
Industry mix (Fortune 500 HQ in NY)
| Industry | F500 HQs | Revenue |
|---|---|---|
| Financial Services | 10 | $950B |
|
||
| Consumer Goods | 9 | $162B |
|
||
| Insurance | 4 | $225B |
|
||
| Telecommunications | 2 | $144B |
|
||
| Pharmaceuticals | 2 | $112B |
|
||
| Media / Entertainment | 2 | $69B |
|
||
Price history
+50.8% since first listed6 events — show timeline
- 2026-06-07 Pending — WNYREIS
- 2026-06-03 Listed $269,990 WNYREIS
- 2023-10-10 Sold (Public Records) $200,000 Public Records
- 2023-10-03 Sold (MLS) $200,000 WNYREIS
- 2023-08-09 Pending — WNYREIS
- 2023-08-01 Listed $179,000 WNYREIS
Property tax history
+2.8%/yrLatest (2025): $3,979 · -19.9% YoY. Source: county tax records.
Cash-flow waterfall
monthlySold comps — $/sqft
last 12 mo · ≤1 miLoading sold comps…