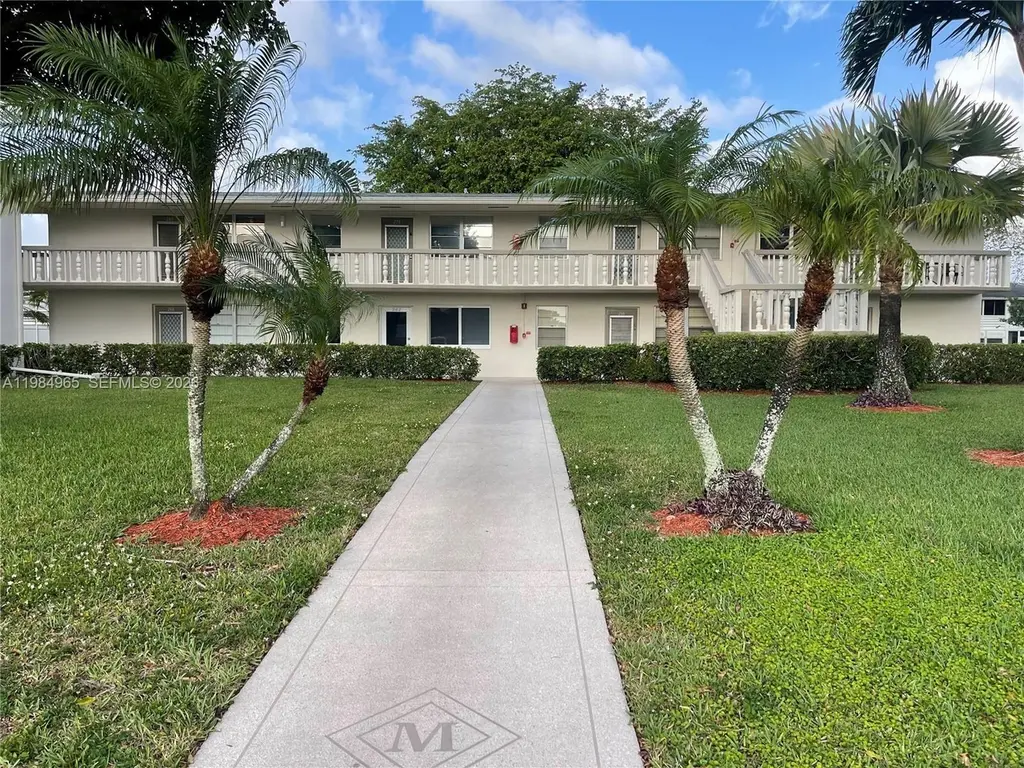
279 Markham M Unit M · Deerfield Beach, FL
Flood risk No data
- FEMA flood zone
- —
- Chance of flooding over 30 yrs
- —
- Est. flood insurance / yr
- —
Fire risk No data
- Est. fire insurance / yr
- —
Heat risk No data
- Hot days now (above threshold)
- —
- Hot days in 30 yrs
- —
Wind risk No data
- Chance of severe wind over 30 yrs
- —
Air-quality risk No data
- Unhealthy air days now
- —
- Unhealthy air days in 30 yrs
- —
Risk factors via First Street. Map © Google.
Why this score? — see what drove the D grade
The composite is a weighted blend of 9 inputs, each scored 0–100. Each bar is that input's sub-score; the figure is the points it added to the 100-point composite (weight × sub-score).
- Cash flow +10.3/30.0
- ARV discount +7.5/15.0
- 1% rule +7.2/10.0
- Schools +4.1/10.0
- Livability +3.8/5.0
- Condition / age +3.8/5.0
- DSCR +2.9/10.0
- Rent growth +2.5/5.0
- Appreciation +0.0/10.0
$150,000
🖨 Deal sheet 📄 Offer letter ✓ Due diligence
Listing remarks
Ready to move in only 3.3 miles to the beach. This new lifestyle 55+ community has completely updates club house with more improvements to come. These two beds, 1.5 bath, 2nd floor unit features new flooring throughout. AC is 2018, water heater is 2019, new laundry machines in each building at no charge. HOA include NEW club house, gym, 1600 seat theater, tennis courts, NEW putt putt, outdoor pools, on-site restaurant, pickle ball, jogging path etc. Fees included: shuttle bus transport, water, trash, basic cable TV. Conveniently located near highways, shopping, restaurants & more.
Key facts
- Jogging path
- 55 community
- Club house
Tags
Property features AI
Finance
- Financial info: Lease considered; Pets allowed (dogs OK)
- HOA & community: Monthly association fee of $490; Association amenities include basketball court, clubhouse, laundry, barbecue, picnic area; Senior community
Exterior
- Parking: Guest parking; One assigned space
- Security: Complex fenced
- Utilities: Central heating and cooling; Electric water heater
- Home design: Attached property; 2-story building; Entry on level 2
- Construction: Block construction; Effective year built noted
- Exterior features: Barbecue area; Tennis courts; Complex is fenced
Interior
- Bedrooms: Bedroom on main level
- Flooring: Tile
- Bathrooms: 1 full bathroom; 1 half bathroom
- Heating & cooling: Central heating; Central air conditioning
- Interior features: Elevator; Bedroom on main level; Second-floor entry
- Laundry & utility: Common area laundry; Electric water heater
Neighborhood map
What this means for you Summary
Snapshot
- This is a 2-bed/1.5-bath condo listed at $150k. Condition is rated good.
Deal economics
- At list price, monthly cash flow is $-83 ($-992/yr) — negative.
- To cash-flow at today's rent, offer at most $138k (8.0% below list).
- Meets the 1% rule at list price ($2k rent vs $150k).
- Recommended offer: $136k (9.0% below list) — sets the bar for market timing.
- Cap rate 5.6% vs local median 4.2% in Deerfield Beach — top-decile yield for the area; either an underpriced asset or a hidden risk that comps aren't pricing in. Stress-test before assuming the spread holds.
Location & tenants
- Location reads 75/100 on livability (#250 in FL, #3,970 nationally) — a middle-class / working-renter tenant base. Strengths: housing A+, health & safety A+, cost of living A; Watch: schools D-, amenities D-, employment D-.
- Broward (suburban): math 42% / reading 53% proficiency, ranked #46 of 73 in FL (top 63%) — families likely to look elsewhere, expect single-tenant / working-renter base with shorter leases.
- Market conditions: Rents flat; 586 active listings in the ZIP; 40 comparable units currently listed for rent nearby; rentals at typical pace (median 24d on market — plan ~3-4 weeks tenant-placement turnaround); 2,111 units permitted in Broward County in 2024 (1,265 in 5+ unit buildings).
- This rent runs 41% of the median local income ($53k/yr) — at the standard rent-burdened threshold; future hikes will face affordability resistance.
Forward outlook
- Local home prices are declining (-3.0%/yr); year-one equity from $1k of loan paydown is wiped out by about $4k of value loss. Plan a longer hold.
- Broward County population projected at +34% by 2050 — long-run rental-demand tailwind backs the buy-and-hold thesis.
Negotiation context
- It's been on market 92 days — a 9% lower offer ($136k) is reasonable based on typical stale-listing flexibility.
- 3 sale attempts; this cycle's ask has dropped $19k (11%) from the opening price — seller is motivated, your offer sets the floor, not the list.
Risks & watch-outs
- Watch-outs: HOA is 27% of rent.
Questions for the listing agent
- What do current leases actually rent for vs. the listed asking? Can we see a recent rent roll and the last 12 months of T-12 income?
- It's been on market 92 days. Have you received any prior offers? Is the seller open to a 9% concession, seller financing, or rate buy-down credit?
- Built in 1974 — when were the roof, HVAC, electrical panel, plumbing, and water heater last replaced?
- What does the HOA fee cover, when was the last increase, and are there any pending special assessments or reserve-fund shortfalls?
- Any open or pending special assessments — roof, HVAC, plumbing, elevator, façade? What's the per-unit balance and payoff schedule, and is the seller paying it off at close or rolling it to the buyer?
- Why hasn't it sold? Are there any deal-killer items the seller is aware of (foundation, flood, title, zoning, code violations)?
- Is there a deadline driving the sale (1031 exchange, divorce, estate, relocation)? That informs how much negotiation room exists.
- Schools are D-rated, which usually means shorter tenancies and higher turnover. Who's the typical renter profile here, and what's been the actual vacancy rate?
- The area grade is low — what's the realistic commute time and amenity access for the typical tenant pool here? Any planned neighborhood developments (good or bad) we should know about?
- What's the average days-on-market for RENTAL listings here right now (not sales)? A rising rental-DOM trend means longer vacancies and softer asking-rent achievability than the comps imply.
- What's the recent tenant-quality profile in this submarket — average credit score on applications, eviction rate, late-payment / NSF rate, and stable-employment percentage? A property-management company in the area should have these aggregated.
- How much new apartment / multifamily construction is in the pipeline within 1–3 miles? Heavy new supply (>2% of stock underway) typically softens rents 12–24 months out; light construction supports rent growth.
Investment metrics
- 1% rule
- 1.22% ✓
- Cap rate
- 5.63%
- Cash-on-cash
- -2.36%
- DSCR
- 0.89
- GRM
- 6.8
CMA / ARV
No comps found within radius.
Projected returns pro-forma
-3.0% appreciation · 0.1% rent growth · sell at horizon
- IRR
- -25.0%
- Equity multiple
- 0.18×
- Total profit
- $-34,425
- Equity at exit
- $22,365
- IRR
- -44.0%
- Equity multiple
- -0.32×
- Total profit
- $-55,490
- Equity at exit
- $12,969
Cash invested: $42,000 (down + closing). Projections, not guarantees.
Landlord ↔ Tenant lean methodology
- Overall (STATE)
- 87 Strongly Landlord-Friendly
- State Florida
- 87 Strongly Landlord-Friendly · R+3
- County
- — inherits STATE
- City
- — inherits STATE
ZIP-level market 33442
- Rents YoY
- 0.1%
- Active inventory
- 586
- Price-to-rent
- 6.8×
Monthly cashflow live
- Estimated rent
- $1,828 high interval (Pro) →
- Mortgage (P&I)
- −$787
- Tax est. 1.5%
- −$188 /mo · $2,250/yr
- Insurance
- −$62
- HOA
- −$490
- Vacancy / Maint / Mgmt
- −$384
- Net cashflow
- $-83
Break-even live
UW: 25.0% down · 7.5% · 30yr · 1.5% tax · 5.0% vac · 8.0% maint · 8.0% mgmt
Financing live
Cash to close
- Down payment
- $37,500
- Closing costs
- $4,500
- Reserves months
- —
- Total cash needed
- —
Loan-product check · same deal, 3 products live
Conventional
25% down · 7.5% · 30yr
- Down + closing
- —
- Monthly P&I
- —
- Monthly cashflow
- —
- DSCR
- —
- Eligible?
- —
Personal DTI + credit; lowest rate.
DSCR
20% down · 8.5% · 30yr
- Down + closing
- —
- Monthly P&I
- —
- Monthly cashflow
- —
- DSCR
- —
- Eligible?
- —
No personal income docs; deal must DSCR.
Hard money
10% down · 12.0% · 12mo
- Down + closing
- —
- Monthly P&I
- —
- Monthly cashflow
- —
- DSCR
- —
- Eligible?
- —
Short-term bridge; refi at stabilization.
Rent comps 40 comps
| Address | Beds | Baths | Sqft | Rent | $/sqft | DOM | Units | Dist |
|---|---|---|---|---|---|---|---|---|
| 308 Markham N Deerfield Beach, FL | 1.0 | 1.5 | 700 | $1,200 | $1.71 | 24d | 1 | 0.03mi |
| 316 Markham Cres Deerfield Beach, FL | 2.0 | 1.5 | 820 | $1,800 | $2.20 | 24d | 1 | 0.07mi |
| 358 Markham Cres Unit 358 Deerfield Beach, FL | 1.0 | 1.5 | 700 | $1,500 | $2.14 | 24d | 1 | 0.11mi |
| 436 Markham S #436 Deerfield Beach, FL | 1.0 | 1.0 | 585 | $1,400 | $2.39 | 24d | 1 | 0.13mi |
| 111 Oakridge I #111 Deerfield Beach, FL | 1.0 | 1.5 | 706 | $1,595 | $2.26 | 24d | 1 | 0.26mi |
| 124 Oakridge I #124 Deerfield Beach, FL | 2.0 | 1.5 | 820 | $1,700 | $2.07 | 4d | 1 | 0.27mi |
| 111 Tilford F #111 Deerfield Beach, FL | 1.0 | 1.0 | 585 | $1,500 | $2.56 | 5d | 1 | 0.28mi |
| 111 Tilford F #111 Deerfield Beach, FL | 1.0 | 1.0 | 585 | $1,500 | $2.56 | 20d | 1 | 0.28mi |
| 306 Newport T #306 Deerfield Beach, FL | 1.0 | 1.0 | 585 | $1,350 | $2.31 | 24d | 1 | 0.28mi |
| 3042 Harwood E Unit 3042 Deerfield Beach, FL | 2.0 | 2.0 | 860 | $3,000 | $3.49 | 24d | 1 | 0.34mi |
| 125 Newport I Unit I Deerfield Beach, FL | 1.0 | 1.5 | 700 | $1,600 | $2.29 | 24d | 1 | 0.36mi |
| 181 Tilford I Unit I Deerfield Beach, FL | 1.0 | 1.5 | 700 | $1,350 | $1.93 | 24d | 1 | 0.37mi |
| 184 Tilford I Unit I Deerfield Beach, FL | 2.0 | 1.5 | 820 | $2,000 | $2.44 | 24d | 1 | 0.37mi |
| 27 Newport B Deerfield Beach, FL | 1.0 | 1.5 | 700 | $1,550 | $2.21 | 21d | 1 | 0.37mi |
| 25 Newport Ct Unit 25 Deerfield Beach, FL | 1.0 | 1.0 | 700 | $1,549 | $2.21 | 24d | 1 | 0.37mi |
| 193 Newport Ct #193 Deerfield Beach, FL | 2.0 | 1.5 | 820 | $2,200 | $2.68 | 24d | 1 | 0.39mi |
| 295 Newport Dr Unit 295 Deerfield Beach, FL | 1.0 | 1.0 | 595 | $1,450 | $2.44 | 24d | 1 | 0.40mi |
| 226 Newport O Deerfield Beach, FL | 1.0 | 1.5 | 700 | $1,600 | $2.29 | 2d | 1 | 0.41mi |
| 226 Newport O Deerfield Beach, FL | 1.0 | 1.5 | 700 | $1,700 | $2.43 | 24d | 1 | 0.41mi |
| 188 Prescott E Unit 188 Deerfield Beach, FL | 1.0 | 1.5 | 700 | $1,800 | $2.57 | 24d | 1 | 0.42mi |
| 20 Prescott E Unit 20 Deerfield Beach, FL | 1.0 | 1.5 | 700 | $1,600 | $2.29 | 24d | 1 | 0.43mi |
| 181 Newport Ct #181 Deerfield Beach, FL | 1.0 | 1.5 | 700 | $1,650 | $2.36 | 24d | 1 | 0.43mi |
| 170 Newport K Deerfield Beach, FL | 1.0 | 1.0 | 585 | $1,430 | $2.44 | 24d | 1 | 0.44mi |
| 272 Tilford M Unit M Deerfield Beach, FL | 2.0 | 1.5 | 820 | $1,900 | $2.32 | 24d | 1 | 0.48mi |
| 178 Durham E Unit 178 Deerfield Beach, FL | 1.0 | 1.0 | 593 | $1,350 | $2.28 | 10d | 1 | 0.57mi |
| 178 Durham E Unit 178 Deerfield Beach, FL | 1.0 | 1.0 | 593 | $1,350 | $2.28 | 2d | 1 | 0.57mi |
| 384 Durham Cir Unit 384 Deerfield Beach, FL | 1.0 | 1.0 | 593 | $1,400 | $2.36 | 24d | 1 | 0.59mi |
| 283 Durham Cir Unit 283 Deerfield Beach, FL | 2.0 | 2.0 | 820 | $3,300 | $4.02 | 24d | 1 | 0.59mi |
| 137 Farnham F Deerfield Beach, FL | 1.0 | 1.5 | 708 | $2,000 | $2.82 | 24d | 1 | 0.59mi |
| 144 Farnham F Unit F Deerfield Beach, FL | 2.0 | 1.5 | 828 | $2,500 | $3.02 | 24d | 1 | 0.59mi |
| 137 Farnham F #137 Deerfield Beach, FL | 1.0 | 1.5 | 700 | $2,500 | $3.57 | 24d | 1 | 0.60mi |
| 3016 Cambridge A Unit A Deerfield Beach, FL | 1.0 | 1.5 | 700 | $1,350 | $1.93 | 24d | 1 | 0.62mi |
| 6 Ventnor a Deerfield Beach, FL | 1.0 | 1.0 | 600 | $1,429 | $2.38 | 24d | 1 | 0.63mi |
| 361 Tilford Q Unit Q Deerfield Beach, FL | 2.0 | 1.5 | 820 | $1,800 | $2.20 | 24d | 1 | 0.63mi |
| 260 Prescott N Unit 260 Deerfield Beach, FL | 1.0 | 1.5 | 700 | $1,500 | $2.14 | 24d | 1 | 0.64mi |
| 127 Westbury Cir Deerfield Beach, FL | 1.0 | 1.0 | 585 | $1,425 | $2.44 | 24d | 1 | 0.67mi |
| 98 Westbury E #98 Deerfield Beach, FL | 1.0 | 1.0 | 585 | $1,600 | $2.74 | 24d | 1 | 0.68mi |
| 102 Westbury E #102 Deerfield Beach, FL | 1.0 | 1.0 | 585 | $1,900 | $3.25 | 7d | 1 | 0.68mi |
| 329 Farnham P #329 Deerfield Beach, FL | 1.0 | 1.5 | 700 | $1,450 | $2.07 | 24d | 1 | 0.68mi |
| 333 Farnham P Unit P Deerfield Beach, FL | 2.0 | 1.5 | 828 | $1,800 | $2.17 | 20d | 1 | 0.68mi |
HOA detail condo
- Monthly dues
- $490 · $5,880/yr
- Likely covers
- watertrashcablepoolgym
- Assessments
- None detected in remarks — confirm with the listing agent.
Listing history 22 events
-
2026-06-18days on market $150,000 Active 92 DOM
-
2026-06-17days on market $150,000 Active 91 DOM
-
2026-06-16days on market $150,000 Active 90 DOM
-
2026-06-15days on market $150,000 Active 89 DOM
-
2026-06-13days on market $150,000 Active 87 DOM
-
2026-06-09days on market $150,000 Active 83 DOM
-
2026-06-08days on market $150,000 Active 82 DOM
-
2026-06-07days on market $150,000 Active 81 DOM
-
2026-06-04days on market $150,000 Active 78 DOM
-
2026-06-03days on market $150,000 Active 77 DOM
-
2026-06-02days on market $150,000 Active 76 DOM
-
2026-06-01days on market $150,000 Active 75 DOM
-
2026-05-31days on market $150,000 Active 74 DOM
-
2026-05-14price $150,000
-
2026-03-16$169,000 Active
-
2026-03-14historical
-
2026-01-29price $175,000
-
2025-10-14$178,000 Active
-
2025-10-07historical
-
2025-08-05price $180,000
-
2025-05-28price $185,000
-
2025-04-07$187,000 Active
ⓘ Source: listings_history table (triggers on properties + properties_extension) + one-shot
backfill from property_details.listing_events for pre-trigger history.
Nearby sold comps map
Loading sold comps map…
Walkable amenities ~0.75 mi
Loading nearby amenities…
Taxation est. · year 1
- Rental income
- $21,934
- − Mortgage interest
- −$8,402
- − Property taxes
- −$2,250
- − Insurance
- −$750
- − Repairs & maintenance
- −$1,755
- − Management
- −$1,755
- − HOA
- −$5,880
- − Depreciation
- −$4,364
- Taxable loss
- −$3,222
- Est. tax savings @ 24.0%
- +$773
- After-tax cash flow
- $-219/yr
For passive investors: Depreciation is non-cash, so a rental often shows a tax loss while cash-flowing — sheltering income. Rental losses are passive: they offset passive income freely, and up to $25,000/yr can offset ordinary (W-2) income if you actively participate and your MAGI is under $100k (phasing out to $0 by $150k); unused losses carry forward. On sale, claimed depreciation is recaptured at up to 25%, and gains may owe capital-gains tax (a 1031 exchange can defer both). Figures are a year-1 estimate at your 24.0% rate — not tax advice; consult a CPA.
Condition & rehab AI · 12 photos
This 2-bedroom, 1.5-bath condo is in good condition with neutral paint and hardwood floors. It is located in a 55+ community with amenities such as a new clubhouse, gym, and outdoor pools. The home is ready to move in and can be improved with some cosmetic updates to increase its value.
Value-add opportunities
- Both painting — Neutral paint can be updated to a more modern color scheme
- Both new flooring — Hardwood floors can be replaced with more modern materials
- Both new kitchen appliances — New appliances can improve the kitchen's functionality and appearance
- Both new bathroom fixtures — New fixtures can improve the bathroom's functionality and appearance
- Both landscaping — Landscaping can improve the home's curb appeal and increase its value
Renovation cost estimate screening
Value-add ROI direction
- Both painting — Neutral paint can be updated to a more modern color scheme ↑
- Both new flooring — Hardwood floors can be replaced with more modern materials ↑
- Both new kitchen appliances — New appliances can improve the kitchen's functionality and appearance ↑
- Both new bathroom fixtures — New fixtures can improve the bathroom's functionality and appearance ↑
- Both landscaping — Landscaping can improve the home's curb appeal and increase its value ↑
ⓘ Cost ranges are severity-bucket heuristics (US national rule-of-thumb). Get contractor quotes + a written scope before underwriting a rehab budget.
Schools (NCES district)
- District
- Broward
- NCES district ID
- 1200180
- Math proficiency
- 42% ▼ -18.00%
- Reading proficiency
- 53% ▼ -5.00%
- Median HH income
- $52,139
- Composite
- 40.88/100
- National rank
- #3621
- State rank
- #46 of 73 in FL
Livability — Deerfield Beach
- Score
- 75/100
- State rank
- #250
- US rank
- #3970
Category grades
Schools grade is shown separately in the Schools card above.
Census & demographics
- Census place
- Deerfield Beach, FL
- County
- Broward County · 1,963,430 people
- City population
- 61,449
- Metro
- Miami-Fort Lauderdale-Pompano Beach, FL
- Population (ZIP)
- 31,296
- Household income
- $53,254
- Rent vs Own
- Severe rent burden
- 2169.0
Population outlook (Broward County) Hauer SSP2
- Today (2025)
- 2,207,033 people
- By 2030
- 2,360,704 · +7.0%
- By 2040
- 2,661,208 · +20.6%
- By 2050
- 2,946,698 · +33.5%
- By 2075
- 3,602,273 · +63.2%
- By 2100
- 3,970,984 · +79.9%
Race, ethnicity, and origin ACS 2023
- Neighborhood character
- Diverse neighborhood (Simpson 0.61)
- Race & ethnicity
- White 57% Hispanic / Latino 23% Two or more races 19% Black 10% Asian 2%
- Hispanic origin (detail)
- Mexican 1% Puerto Rican 4% Cuban 3%
- Common ancestry
- Estonian 7% Romanian 4% Hispanic 3%
- Foreign-born
- 34% · Canada, Jamaica, Dominican Republic
- Languages at home
- 59% English-only · Spanish 20% Other Indo-European 13% French/Haitian/Cajun 4%
Political lean MEDSL · Broward
- 2024 margin
- D (+17.0) · D 58.0% · R 41.0%
- 2008→2024 swing
- -17.8pp toward R · 2008: 34.7pp · 2024: 17.0pp
- All cycles
- 2024: D+17.0 2020: D+29.8 2016: D+35.0 2012: D+34.9 2008: D+34.7
Not yet ingested
- Civics
- —
Market trends
- HPI YoY
- ▼ -280.44%
- Current HPI
- 323.0166
- Rent YoY
- ▲ 0.10%
- Metro
- Miami-Fort Lauderdale-Pompano Beach, FL
- State GDP YoY
- ▲ 3.28%
- F500 in state
- 36
Industry mix (Fortune 500 HQ in FL)
| Industry | F500 HQs | Revenue |
|---|---|---|
| Industrial Technology | 2 | $29B |
|
||
| Insurance | 2 | $17B |
|
||
| Retail | 1 | $60B |
|
||
| Technology Distribution | 1 | $58B |
|
||
| Homebuilding | 1 | $35B |
|
||
| Technology Manufacturing | 1 | $35B |
|
||
Price history
-19.8% since first listed9 events — show timeline
- 2026-05-14 Price Changed $150,000 MARMLS
- 2026-03-16 Listed $169,000 MARMLS
- 2026-03-14 Listing Removed — MARMLS
- 2026-01-29 Price Changed $175,000 MARMLS
- 2025-10-14 Listed $178,000 MARMLS
- 2025-10-07 Listing Removed — MARMLS
- 2025-08-05 Price Changed $180,000 MARMLS
- 2025-05-28 Price Changed $185,000 MARMLS
- 2025-04-07 Listed $187,000 MARMLS
Cash-flow waterfall
monthlySold comps — $/sqft
last 12 mo · ≤1 miLoading sold comps…