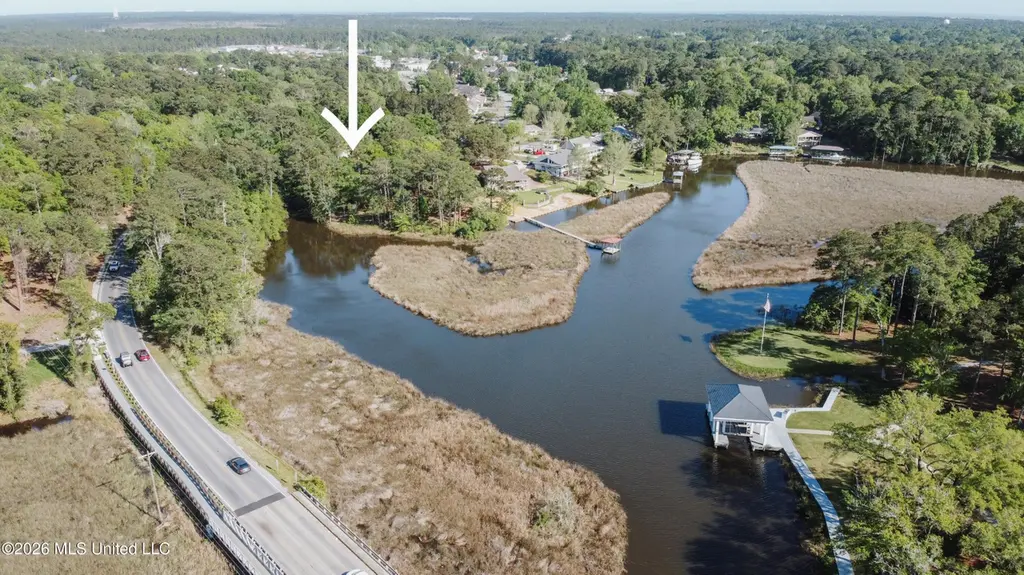
9300 Ridgeview Dr · Gulf Park Estates, MS
Flood risk 7/10 · Major
- FEMA flood zone
- X (shaded)
- Chance of flooding over 30 yrs
- 0.74%
- Est. flood insurance / yr
- $507 – $1,088
Fire risk 3/10 · Minor
- Est. fire insurance / yr
- $1,241 – $2,305
Heat risk 10/10 · Severe
- Hot days now (above 106°F)
- 7 days/yr
- Hot days in 30 yrs
- 22 days/yr
Wind risk 9/10 · Severe
- Chance of severe wind over 30 yrs
- 99.0%
Air-quality risk 2/10 · Minimal
- Unhealthy air days now
- 1 days/yr
- Unhealthy air days in 30 yrs
- 2 days/yr
Risk factors via First Street. Map © Google.
Why this score? — see what drove the D grade
The composite is a weighted blend of 9 inputs, each scored 0–100. Each bar is that input's sub-score; the figure is the points it added to the 100-point composite (weight × sub-score).
- Cash flow +11.2/30.0
- ARV discount +11.0/15.0
- Schools +5.3/10.0
- Livability +3.5/5.0
- DSCR +3.3/10.0
- Rent growth +2.8/5.0
- Condition / age +2.5/5.0
- 1% rule +2.2/10.0
- Appreciation +0.0/10.0
$322,000
🖨 Deal sheet (PDF) 📄 Offer letter ✓ Due diligence
Listing remarks MLS
Discover the hidden potential of this charming family home located on a site with pleasant views overlooking Davis Bayou. The home features office space inside the garage, a generator and a nice deck overlooking the canal of Davis Bayou. Come experience the relaxing views of Davis Bayou before it's gone! USDA Eligible
Key facts
- 0.52 acre lot
- 2 garage spots
- Built 1998
Neighborhood map
What this means for you Summary
Snapshot
- This is a 3-bed/2.0-bath single-family listed at $322k.
Deal economics
- At list price, monthly cash flow is $-187 ($-2k/yr) — negative.
- To cash-flow at today's rent, offer at most $289k (10.3% below list).
- To meet the 1% rule (rent ≥ 1% of price), the offer needs to be $230k (28.4% below list).
- Recommended offer: $230k (28.4% below list) — sets the bar for 1% rule.
Location & tenants
- Location reads 70/100 on livability (#43 in MS) — a middle-class / working-renter tenant base. Strengths: crime A+, cost of living A+, housing A+; Watch: health & safety D+, amenities F, commute F.
- Ocean Springs School District (suburban): math 64% / reading 59% proficiency, ranked #1 of 130 in MS (top 1%) — acceptable for families but not a draw, mixed tenant base, ~2y average lease.
- Zoned schools: Magnolia Park Elementary (math 62% / reading 52%, grade C+, #37 of 375 statewide, top 10%, 635 students, 100% FRL); Ocean Springs Upper Elementary Scho (math 59% / reading 56%, grade B, #12 of 179 statewide, top 6%, 1,332 students, 100% FRL); Ocean Springs High School (math 77% / reading 64%, grade B+, #1 of 197 statewide, top 0%, 1,899 students, 100% FRL) — zoned schools average 100% FRL vs 33% district-wide (67 pts higher); higher-poverty schools than district average — tighter screening recommended.
- Market conditions: Rents rising (+1.3%/yr); 723 active listings in the ZIP; 7 comparable units currently listed for rent nearby; rentals at typical pace (median 23d on market — plan ~3-4 weeks tenant-placement turnaround); solid renter incomes; 516 units permitted in Jackson County in 2024 (6 in 5+ unit buildings).
- This rent runs 35% of the median local income ($79k/yr) — at the standard rent-burdened threshold; future hikes will face affordability resistance.
Forward outlook
- Local home prices are declining (-3.0%/yr); year-one equity from $2k of loan paydown is wiped out by about $10k of value loss. Plan a longer hold.
Negotiation context
- It's been on market 71 days — a 6% lower offer ($303k) is reasonable based on typical stale-listing flexibility.
- 2 sale attempts; this cycle's ask has dropped $25k (7%) from the opening price — seller is motivated, your offer sets the floor, not the list.
Risks & watch-outs
- Watch-outs: flood insurance adds $66/mo.
- Climate carrying-cost: major flood risk; severe wind risk, 99% chance of damaging wind over 30y; extreme-heat days projected 7→22/yr by 2055 (HVAC capex compounding) — expect insurance premiums to compound above CPI over the hold.
Questions for the listing agent
- What do current leases actually rent for vs. the listed asking? Can we see a recent rent roll and the last 12 months of T-12 income?
- It's been on market 71 days. Have you received any prior offers? Is the seller open to a 28% concession, seller financing, or rate buy-down credit?
- What's the actual annual flood-insurance premium (NFIP or private), and is the property in a SFHA with mandatory coverage?
- Why hasn't it sold? Are there any deal-killer items the seller is aware of (foundation, flood, title, zoning, code violations)?
- Is there a deadline driving the sale (1031 exchange, divorce, estate, relocation)? That informs how much negotiation room exists.
- Schools are D-rated, which usually means shorter tenancies and higher turnover. Who's the typical renter profile here, and what's been the actual vacancy rate?
- The area grade is low — what's the realistic commute time and amenity access for the typical tenant pool here? Any planned neighborhood developments (good or bad) we should know about?
- What's the average days-on-market for RENTAL listings here right now (not sales)? A rising rental-DOM trend means longer vacancies and softer asking-rent achievability than the comps imply.
- What's the recent tenant-quality profile in this submarket — average credit score on applications, eviction rate, late-payment / NSF rate, and stable-employment percentage? A property-management company in the area should have these aggregated.
- How much new for-sale + rental construction is in the pipeline within 1–3 miles? Heavy new supply typically softens prices + rents 12–24 months out; constrained supply supports both.
Investment metrics
- 1% rule
- 0.72% ✗
- Cap rate
- 5.84%
- Cash-on-cash
- -1.61%
- DSCR
- 0.93
- GRM
- 11.6
CMA / ARV
- ARV (median comp)
- $348,830
- List price
- $322,000
- Delta
- -7.69%
- Verdict
- FAIR
- Comps
- 20 within 1.0 mi
Show comp detail 12 sales within ~0.75 mi
| Address | Dist | Beds/Ba | Sqft | Sold | Price | $/sf | Match |
|---|---|---|---|---|---|---|---|
| 3717 Tangerine St | 0.15mi | 3/2.0 | 1,752 (-1%) | 2mo | $250,000 | $143 | 90 |
| 121 Booth Cir | 0.44mi | 3/2.0 | 1,796 (+2%) | 1mo | $239,000 | $133 | 76 |
| 124 Spanish Cove Dr | 0.28mi | 3/2.0 | 1,937 (+10%) | 6mo | $400,000 | $207 | 66 |
| 9321 Coconut Dr | 0.50mi | 3/3.0 | 1,836 (+4%) | 1mo | $270,000 | $147 | 66 |
| 3524 N 8th St | 0.52mi | 4/2.0 (+1) | 1,835 (+4%) | 2mo | $275,000 | $150 | 63 |
| 3300 N 9th St | 0.70mi | 3/2.0 | 1,858 (+5%) | 2mo | $315,000 | $170 | 57 |
| 3212 N 5th St | 0.69mi | 3/2.0 | 1,641 (-7%) | 1mo | $249,900 | $152 | 55 |
| 3301 N 7th St | 0.69mi | 4/2.0 (+1) | 1,829 (+4%) | 7mo | $275,000 | $150 | 52 |
| 803 Woodglen Dr | 0.73mi | 3/2.5 | 1,883 (+6%) | 3mo | $325,000 | $173 | 51 |
| 3424 N 5th St | 0.47mi | 3/2.0 | 1,502 (-15%) | 4mo | $245,000 | $163 | 50 |
| 3425 Beachview Dr | 0.50mi | 4/2.0 (+1) | 1,993 (+13%) | 5mo | $279,900 | $140 | 46 |
| 146 Booth Cir | 0.61mi | 3/2.0 | 1,539 (-13%) | 6mo | $269,000 | $175 | 45 |
Match score weights: distance 35% · size 25% · config 20% · recency 20%. Top-matched comps best support the ARV.
Projected returns pro-forma
-3.0% appreciation · 1.31% rent growth · sell at horizon
- IRR
- -22.2%
- Equity multiple
- 0.25×
- Total profit
- $-68,062
- Equity at exit
- $48,011
- IRR
- -20.5%
- Equity multiple
- -0.00×
- Total profit
- $-90,319
- Equity at exit
- $27,841
Cash invested: $90,160 (down + closing). Projections, not guarantees.
Landlord ↔ Tenant lean methodology
- Overall (STATE)
- 90 Strongly Landlord-Friendly
- State Mississippi
- 90 Strongly Landlord-Friendly · R+11
- County
- — inherits STATE
- City
- — inherits STATE
ZIP-level market 39564
- Home prices YoY
- -26.8%
- Rents YoY
- 1.3%
- Active inventory
- 723
- Price-to-rent
- 11.6×
Monthly cashflow live
- Estimated rent
- $2,305 high interval (Pro) →
- Mortgage (P&I)
- −$1,689
- Tax from tax record
- −$119 /mo · $1,427/yr
- Insurance
- −$134
- Flood insurance flood zone
- −$66 /mo · $798/yr
- HOA
- −$0
- Vacancy / Maint / Mgmt
- −$484
- Net cashflow
- $-187
Break-even live
Sensitivity live
| Price | -10% $-5 | -5% $-96 | +0% $-187 | +5% $-278 | +10% $-370 |
|---|---|---|---|---|---|
| Rent | -10% $-369 | -5% $-278 | +0% $-187 | +5% $-96 | +10% $-5 |
| Rate | -1.0pp $-25 | -0.5pp $-105 | base $-187 | +0.5pp $-271 | +1.0pp $-356 |
UW: 25.0% down · 7.5% · 30yr · 1.5% tax · 5.0% vac · 8.0% maint · 8.0% mgmt
Financing live
Cash to close
- Down payment
- $80,500
- Closing costs
- $9,660
- Reserves months
- —
- Total cash needed
- —
Loan-product check · same deal, 3 products live
Conventional
25% down · 7.5% · 30yr
- Down + closing
- —
- Monthly P&I
- —
- Monthly cashflow
- —
- DSCR
- —
- Eligible?
- —
Personal DTI + credit; lowest rate.
DSCR
20% down · 8.5% · 30yr
- Down + closing
- —
- Monthly P&I
- —
- Monthly cashflow
- —
- DSCR
- —
- Eligible?
- —
No personal income docs; deal must DSCR.
Hard money
10% down · 12.0% · 12mo
- Down + closing
- —
- Monthly P&I
- —
- Monthly cashflow
- —
- DSCR
- —
- Eligible?
- —
Short-term bridge; refi at stabilization.
Rent comps 7 comps
| Address | Beds | Baths | Sqft | Rent | $/sqft | DOM | Units | Dist |
|---|---|---|---|---|---|---|---|---|
| 106 Booth Cir Ocean Springs, MS | 4.0 | 2.0 | 2100 | $2,500 | $1.19 | 15d | 1 | 0.36mi |
| 3305 N 8th St Ocean Springs, MS | 4.0 | 2.0 | 1802 | $2,250 | $1.25 | 22d | 1 | 0.71mi |
| 132 Gettysburg Cir Ocean Springs, MS | 4.0 | 3.0 | 1689 | $2,195 | $1.30 | 22d | 1 | 1.14mi |
| 3825 Timberlake Dr Ocean Springs, MS | 3.0 | 2.0 | 1640 | $2,200 | $1.34 | 22d | 1 | 1.21mi |
| 3500 Groveland Rd Ocean Springs, MS | 2.0–3.0 | 2.0 | 1173 | $1,750 | $1.49 | 15d | 1 | 1.31mi |
| 4008 Breezy Hill Ln Ocean Springs, MS | 4.0 | 3.0 | 1600 | $3,200 | $2.00 | 15d | 1 | 1.43mi |
| 7003 Ute Ct Ocean Springs, MS | 4.0 | 2.0 | 2000 | $2,195 | $1.10 | 22d | 1 | 1.49mi |
Listing history 19 events
-
2026-06-21days on market $322,000 Active 71 DOM
-
2026-06-18days on market $322,000 Active 68 DOM
-
2026-06-17days on market $322,000 Active 67 DOM
-
2026-06-16days on market $322,000 Active 66 DOM
-
2026-06-15days on market $322,000 Active 65 DOM
-
2026-06-14days on market $322,000 Active 63 DOM
-
2026-06-13days on market $322,000 Active 62 DOM
-
2026-06-10days on market $322,000 Active 60 DOM
-
2026-06-09days on market $322,000 Active 59 DOM
-
2026-06-08days on market $322,000 Active 58 DOM
-
2026-06-07days on market $322,000 Active 57 DOM
-
2026-06-02days on market $322,000 Active 52 DOM
-
2026-06-01days on market $322,000 Active 51 DOM
-
2026-05-31days on market $322,000 Active 50 DOM
-
2026-05-30days on market $322,000 Active 49 DOM
-
2026-05-10status Active 319-char remark
Show marketing remark (319 chars)
Discover the hidden potential of this charming family home located on a site with pleasant views overlooking Davis Bayou. The home features office space inside the garage, a generator and a nice deck overlooking the canal of Davis Bayou. Come experience the relaxing views of Davis Bayou before it's gone! USDA Eligible
-
2026-03-24historical 319-char remark
Show marketing remark (319 chars)
Discover the hidden potential of this charming family home located on a site with pleasant views overlooking Davis Bayou. The home features office space inside the garage, a generator and a nice deck overlooking the canal of Davis Bayou. Come experience the relaxing views of Davis Bayou before it's gone! USDA Eligible
-
2026-03-02price $322,000 319-char remark
Show marketing remark (319 chars)
Discover the hidden potential of this charming family home located on a site with pleasant views overlooking Davis Bayou. The home features office space inside the garage, a generator and a nice deck overlooking the canal of Davis Bayou. Come experience the relaxing views of Davis Bayou before it's gone! USDA Eligible
-
2026-02-22$347,000 Active 319-char remark
Show marketing remark (319 chars)
Discover the hidden potential of this charming family home located on a site with pleasant views overlooking Davis Bayou. The home features office space inside the garage, a generator and a nice deck overlooking the canal of Davis Bayou. Come experience the relaxing views of Davis Bayou before it's gone! USDA Eligible
ⓘ Source: listings_history table (triggers on properties + properties_extension) + one-shot
backfill from property_details.listing_events for pre-trigger history.
Tax reassessment forecast MS · Resets to sale price
- Current annual tax
- $1,427 · $119/mo
- Projected year-2 tax
- $2,544 · $212/mo
- Expected delta
- +$1,117/yr (+$93/mo · 78.3%)
ⓘ Screening estimate from a state-policy table — verify with the county assessor before closing.
Climate risk First Street
- Flood 7/10 Severe FEMA zone X (shaded) · 74% chance over 30 yrs
- Wildfire 3/10 Moderate
- Heat 10/10 Extreme 7 d/yr ≥106°F today · 22 d/yr by 30 yrs out
- Wind 9/10 Extreme 99% chance of damaging wind over 30 yrs
- Air quality 2/10 Low 1 unhealthy d/yr today · 2 by 30 yrs out
Nearby sold comps map
Loading sold comps map…
Walkable amenities ~0.75 mi
Loading nearby amenities…
Taxation est. · year 1
- Rental income
- $27,657
- − Mortgage interest
- −$18,037
- − Property taxes
- −$1,427
- − Insurance
- −$2,408
- − Repairs & maintenance
- −$2,213
- − Management
- −$2,213
- − Depreciation
- −$9,367
- Taxable loss
- −$8,006
- Est. tax savings @ 24.0%
- +$1,921
- After-tax cash flow
- $-326/yr
For passive investors: Depreciation is non-cash, so a rental often shows a tax loss while cash-flowing — sheltering income. Rental losses are passive: they offset passive income freely, and up to $25,000/yr can offset ordinary (W-2) income if you actively participate and your MAGI is under $100k (phasing out to $0 by $150k); unused losses carry forward. On sale, claimed depreciation is recaptured at up to 25%, and gains may owe capital-gains tax (a 1031 exchange can defer both). Figures are a year-1 estimate at your 24.0% rate — not tax advice; consult a CPA.
Schools (NCES district)
- District
- Ocean Springs School District
- NCES district ID
- 2803360
- Math proficiency
- 64% ▼ -3.00%
- Reading proficiency
- 59% ▲ 1.00%
- Median HH income
- $60,485
- Composite
- 53.35/100
- National rank
- #1477
- State rank
- #1 of 130 in MS
Livability — Gulf Park Estates
- Score
- 70/100
- State rank
- #43
- US rank
- #7955
Category grades
Schools grade is shown separately in the Schools card above.
Census & demographics
- Census place
- Gulf Park Estates, MS
- County
- Jackson County · 82,196 people
- Metro
- Gulfport-Biloxi, MS
- Population (ZIP)
- 43,240
- Household income
- $78,596
- Rent vs Own
- Severe rent burden
- 734.0
Population outlook (Jackson County) Hauer SSP2
- Today (2025)
- 146,926 people
- By 2030
- 148,442 · +1.0%
- By 2040
- 149,631 · +1.8%
- By 2050
- 148,723 · +1.2%
- By 2075
- 147,845 · +0.6%
- By 2100
- 144,510 · -1.6%
Race, ethnicity, and origin ACS 2023
- Neighborhood character
- Predominantly White (74%)
- Race & ethnicity
- White 74% Black 10% Hispanic / Latino 8% Two or more races 7% Asian 4%
- Hispanic origin (detail)
- Mexican 3% Puerto Rican 2%
- Common ancestry
- Lithuanian 5% Slovak 4% Romanian 2%
- Foreign-born
- 5% · Canada, South Korea, Vietnam
- Languages at home
- 93% English-only · Spanish 3% Vietnamese 2% Tagalog/Filipino 1%
Political lean MEDSL · Jackson
- 2024 margin
- Solid R (+39.9) · D 29.5% · R 69.4% · Other 1.1%
- 2008→2024 swing
- -6.4pp toward R · 2008: -33.5pp · 2024: -39.9pp
- All cycles
- 2024: R+39.9 2020: R+34.6 2016: R+39.9 2012: R+36.1 2008: R+33.5
Not yet ingested
- Civics
- —
Market trends
- HPI YoY
- ▼ -74.77%
- Current HPI
- 204.2244
- Rent YoY
- ▲ 1.31%
- Metro
- Gulfport-Biloxi, MS
- State GDP YoY
- —
- F500 in state
- 0
Price history
-7.2% since first listed4 events — show timeline
- 2026-05-10 Relisted — MLSU
- 2026-03-24 Listing Removed — MLSU
- 2026-03-02 Price Changed $322,000 MLSU
- 2026-02-22 Listed $347,000 MLSU
Property tax history
+4.2%/yrLatest (2025): $1,427 · +0.7% YoY. Source: county tax records.
Cash-flow waterfall
monthlySold comps — $/sqft
last 12 mo · ≤1 miLoading sold comps…