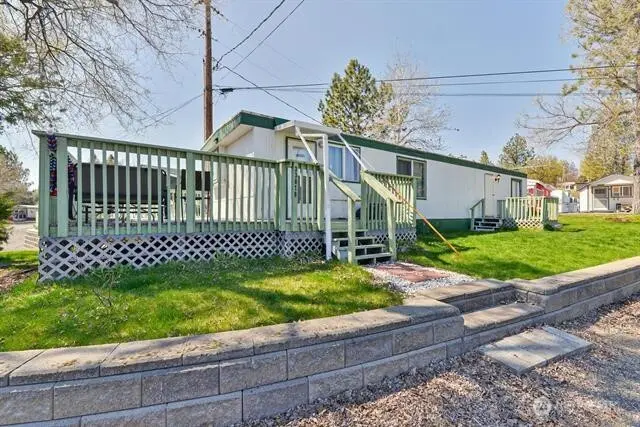
33816 Aztec Ln · Cheney, WA
Flood risk 1/10 · Minimal
- FEMA flood zone
- X (unshaded)
- Chance of flooding over 30 yrs
- 0.0%
- Est. flood insurance / yr
- $507 – $1,088
Fire risk 8/10 · Major
- Est. fire insurance / yr
- $604 – $1,122
Heat risk 3/10 · Minor
- Hot days now (above 94°F)
- 7 days/yr
- Hot days in 30 yrs
- 15 days/yr
Wind risk 1/10 · Minimal
- Chance of severe wind over 30 yrs
- —
Air-quality risk 7/10 · Major
- Unhealthy air days now
- 10 days/yr
- Unhealthy air days in 30 yrs
- 13 days/yr
Risk factors via First Street. Map © Google.
Why this score? — see what drove the C+ grade
The composite is a weighted blend of 9 inputs, each scored 0–100. Each bar is that input's sub-score; the figure is the points it added to the 100-point composite (weight × sub-score).
- Cash flow +30.0/30.0
- 1% rule +10.0/10.0
- DSCR +10.0/10.0
- Schools +4.6/10.0
- Livability +4.0/5.0
- Rent growth +3.1/5.0
- Condition / age +2.5/5.0
- ARV discount +0.0/15.0
- Appreciation +0.0/10.0
$68,000
🖨 Deal sheet 📄 Offer letter ✓ Due diligence
Listing remarks MLS
If boating, fishing, and lakeside living are at the top of your wish-list, this home delivers it ALL -- right outside your front door. Just steps from the water, this charming home offers the perfect retreat—only 45 minutes from Spokane. The home features an open-concept kitchen, dining and living area ideal for relaxing or entertaining, two bedrooms and one bathroom. Enjoy exclusive access to the park’s private boat launch, dock, boat slips, and sandy beach on Badger Lake year-round. Park has boat slip and off-season storage rentals available. So enjoy peaceful mornings on the porch overlooking the lake and quiet evenings surrounded by abundant wildlife in this retreat at Badger Lake!
Key facts
- Sandy beach
- Boat slips
- Open-concept kitchen
Tags
Neighborhood map
What this means for you Summary
Snapshot
- This is a 2-bed/1.0-bath manufactured listed at $68k.
Deal economics
- At list price, monthly cash flow is $558 ($7k/yr) — positive.
- The deal already cash-flows at list — no discount required.
- Meets the 1% rule at list price ($1k rent vs $68k).
- Recommended offer: $60k (12.0% below list) — sets the bar for market timing.
- Cap rate 16.1% vs local median 2.2% in Cheney — top-decile yield for the area; either an underpriced asset or a hidden risk that comps aren't pricing in. Stress-test before assuming the spread holds.
Location & tenants
- Location reads 79/100 on livability (#108 in WA, #2,146 nationally) — a middle-class / working-renter tenant base. Strengths: commute A+, health & safety A+, schools B+; Watch: crime C-, amenities C-, employment D.
- Cheney School District (town): math 47% / reading 56% proficiency, ranked #140 of 291 in WA (top 48%) — acceptable for families but not a draw, mixed tenant base, ~2y average lease.
- Market conditions: Rents rising (+2.3%/yr); 316 active listings in the ZIP; 3,608 units permitted in Spokane County in 2024 (1,792 in 5+ unit buildings).
Forward outlook
- Local home prices are declining (-3.0%/yr); year-one equity from $470 of loan paydown is wiped out by about $2k of value loss. Plan a longer hold.
- Spokane County population projected at +13% by 2050 — modest demand growth; plan on rents tracking national, not racing it.
- At projected returns (-3.0% appreciation + 2.3% rent growth), your $19k cash investment doubles in ~4 years — after that, you're playing with house money.
Negotiation context
- It's been on market 176 days — a 12% lower offer ($60k) is reasonable based on typical stale-listing flexibility.
- 4 sale attempts since 4y ago with the ask held roughly flat each time — persistent listings suggest the price (not the market) is what's stuck; bring a comps-based counter.
Risks & watch-outs
- Climate carrying-cost: severe wildfire risk — expect insurance premiums to compound above CPI over the hold.
Questions for the listing agent
- It's been on market 176 days. Have you received any prior offers? Is the seller open to a 12% concession, seller financing, or rate buy-down credit?
- Built in 1977 — when were the roof, HVAC, electrical panel, plumbing, and water heater last replaced?
- Why hasn't it sold? Are there any deal-killer items the seller is aware of (foundation, flood, title, zoning, code violations)?
- Is there a deadline driving the sale (1031 exchange, divorce, estate, relocation)? That informs how much negotiation room exists.
- Schools are B-rated — typically a magnet for longer-tenancy family renters. What's the average tenant stay here, and is there a school-zone premium baked into asking?
- What's the average days-on-market for RENTAL listings here right now (not sales)? A rising rental-DOM trend means longer vacancies and softer asking-rent achievability than the comps imply.
- What's the recent tenant-quality profile in this submarket — average credit score on applications, eviction rate, late-payment / NSF rate, and stable-employment percentage? A property-management company in the area should have these aggregated.
- How much new for-sale + rental construction is in the pipeline within 1–3 miles? Heavy new supply typically softens prices + rents 12–24 months out; constrained supply supports both.
Investment metrics
- 1% rule
- 1.86% ✓
- Cap rate
- 16.13%
- Cash-on-cash
- 35.14%
- DSCR
- 2.56
- GRM
- 4.5
CMA / ARV
- ARV (median comp)
- $55,639
- List price
- $68,000
- Delta
- 22.22%
- Verdict
- OVERPRICED
- Comps
- 9 within 1.0 mi
Projected returns pro-forma
-3.0% appreciation · 2.31% rent growth · sell at horizon
- IRR
- 29.9%
- Equity multiple
- 2.24×
- Total profit
- $23,626
- Equity at exit
- $10,139
- IRR
- 36.8%
- Equity multiple
- 4.30×
- Total profit
- $62,781
- Equity at exit
- $5,879
Cash invested: $19,040 (down + closing). Projections, not guarantees.
Landlord ↔ Tenant lean methodology
- Overall (STATE)
- 28 Tenant-Leaning
- State Washington
- 28 Tenant-Leaning · D+8
- County
- — inherits STATE
- City
- — inherits STATE
ZIP-level market 99004
- Home prices YoY
- -22.5%
- Rents YoY
- 2.3%
- Active inventory
- 316
- Price-to-rent
- 4.5×
Monthly cashflow live
- Estimated rent
- $1,266 medium interval (Pro) →
- Mortgage (P&I)
- −$357
- Tax from tax record
- −$57 /mo · $687/yr
- Insurance
- −$28
- HOA
- −$0
- Vacancy / Maint / Mgmt
- −$266
- Net cashflow
- $558
Break-even live
UW: 25.0% down · 7.5% · 30yr · 1.5% tax · 5.0% vac · 8.0% maint · 8.0% mgmt
Financing live
Cash to close
- Down payment
- $17,000
- Closing costs
- $2,040
- Reserves months
- —
- Total cash needed
- —
Loan-product check · same deal, 3 products live
Conventional
25% down · 7.5% · 30yr
- Down + closing
- —
- Monthly P&I
- —
- Monthly cashflow
- —
- DSCR
- —
- Eligible?
- —
Personal DTI + credit; lowest rate.
DSCR
20% down · 8.5% · 30yr
- Down + closing
- —
- Monthly P&I
- —
- Monthly cashflow
- —
- DSCR
- —
- Eligible?
- —
No personal income docs; deal must DSCR.
Hard money
10% down · 12.0% · 12mo
- Down + closing
- —
- Monthly P&I
- —
- Monthly cashflow
- —
- DSCR
- —
- Eligible?
- —
Short-term bridge; refi at stabilization.
Listing history 26 events
-
2026-06-18days on market $68,000 Active 176 DOM
-
2026-06-17days on market $68,000 Active 175 DOM
-
2026-06-16days on market $68,000 Active 174 DOM
-
2026-06-15days on market $68,000 Active 173 DOM
-
2026-06-14days on market $68,000 Active 171 DOM
-
2026-06-13days on market $68,000 Active 170 DOM
-
2026-06-10days on market $68,000 Active 168 DOM
-
2026-06-09days on market $68,000 Active 167 DOM
-
2026-06-08days on market $68,000 Active 166 DOM
-
2026-06-07days on market $68,000 Active 165 DOM
-
2026-06-05days on market $68,000 Active 162 DOM
-
2026-06-03days on market $68,000 Active 161 DOM
-
2026-06-02days on market $68,000 Active 160 DOM
-
2026-06-01days on market $68,000 Active 159 DOM
-
2026-05-31days on market $68,000 Active 158 DOM
-
2026-05-31days on market $68,000 Active 157 DOM
-
2025-12-24$68,000 Active
-
2025-12-22$68,000 Active 706-char remark
Show marketing remark (706 chars)
If boating, fishing, and lakeside living are at the top of your wish-list, this home delivers it ALL -- right outside your front door. Just steps from the water, this charming home offers the perfect retreat—only 45 minutes from Spokane. The home features an open-concept kitchen, dining and living area ideal for relaxing or entertaining, two bedrooms and one bathroom. Enjoy exclusive access to the park’s private boat launch, dock, boat slips, and sandy beach on Badger Lake year-round. Park has boat slip and off-season storage rentals available. So enjoy peaceful mornings on the porch overlooking the lake and quiet evenings surrounded by abundant wildlife in this retreat at Badger Lake!
-
2025-10-01historical
-
2025-07-18price $80,000
-
2025-07-03price $90,000
-
2025-05-20price $98,000
-
2025-04-21$100,000 Active
-
2022-06-28soldstatus $88,500 Sold
-
2022-05-31status Pending on Inspection
-
2022-05-26$89,500 New
ⓘ Source: listings_history table (triggers on properties + properties_extension) + one-shot
backfill from property_details.listing_events for pre-trigger history.
Tax reassessment forecast WA · Resets to sale price
- Current annual tax
- $687 · $57/mo
- Projected year-2 tax
- $687 · $57/mo
- Expected delta
- $0/yr ($0/mo · 0.0%)
ⓘ Screening estimate from a state-policy table — verify with the county assessor before closing.
Climate risk First Street
- Flood 1/10 Low FEMA zone X (unshaded) · 0% chance over 30 yrs
- Wildfire 8/10 Severe
- Heat 3/10 Moderate 7 d/yr ≥94°F today · 15 d/yr by 30 yrs out
- Wind 1/10 Low
- Air quality 7/10 Severe 10 unhealthy d/yr today · 13 by 30 yrs out
Nearby sold comps map
Loading sold comps map…
Walkable amenities ~0.75 mi
Loading nearby amenities…
Taxation est. · year 1
- Rental income
- $15,187
- − Mortgage interest
- −$3,809
- − Property taxes
- −$687
- − Insurance
- −$340
- − Repairs & maintenance
- −$1,215
- − Management
- −$1,215
- − Depreciation
- −$1,978
- Taxable income
- $5,943
- Est. tax owed @ 24.0%
- −$1,426
- After-tax cash flow
- $5,265/yr
For passive investors: Depreciation is non-cash, so a rental often shows a tax loss while cash-flowing — sheltering income. Rental losses are passive: they offset passive income freely, and up to $25,000/yr can offset ordinary (W-2) income if you actively participate and your MAGI is under $100k (phasing out to $0 by $150k); unused losses carry forward. On sale, claimed depreciation is recaptured at up to 25%, and gains may owe capital-gains tax (a 1031 exchange can defer both). Figures are a year-1 estimate at your 24.0% rate — not tax advice; consult a CPA.
Schools (NCES district)
- District
- Cheney School District
- NCES district ID
- 5301230
- Math proficiency
- 47% ▲ 1.00%
- Reading proficiency
- 56% ▲ 1.00%
- Median HH income
- $46,800
- Composite
- 45.66/100
- National rank
- #5637
- State rank
- #140 of 291 in WA
Livability — Cheney
- Score
- 79/100
- State rank
- #108
- US rank
- #2146
Category grades
Schools grade is shown separately in the Schools card above.
Census & demographics
- County
- Spokane County · 496,401 people
- City population
- 22,871
- Metro
- Spokane-Spokane Valley, WA
- Population (ZIP)
- 22,871
- Household income
- $67,337
- Rent vs Own
- Severe rent burden
- 1045.0
Population outlook (Spokane County) Hauer SSP2
- Today (2025)
- 531,314 people
- By 2030
- 549,278 · +3.4%
- By 2040
- 577,822 · +8.8%
- By 2050
- 598,188 · +12.6%
- By 2075
- 630,744 · +18.7%
- By 2100
- 622,360 · +17.1%
Race, ethnicity, and origin ACS 2023
- Neighborhood character
- Predominantly White (79%)
- Race & ethnicity
- White 79% Two or more races 10% Hispanic / Latino 8% Asian 2% Black 2%
- Hispanic origin (detail)
- Mexican 6%
- Common ancestry
- Portuguese 4% Lithuanian 3% Slovak 3%
- Foreign-born
- 6% · Canada, Vietnam
- Languages at home
- 91% English-only · Spanish 4% Russian/Polish/Slavic 1% Arabic 1%
Political lean MEDSL · Spokane
- 2024 margin
- Toss-up / Even · D 46.0% · R 51.0% · Other 3.0%
- 2008→2024 swing
- -3.8pp toward R · 2008: -1.1pp · 2024: -5.0pp
- All cycles
- 2024: R+5.0 2020: R+4.3 2016: R+8.3 2012: R+6.3 2008: R+1.1
Not yet ingested
- Civics
- —
Market trends
- HPI YoY
- ▼ -91.31%
- Current HPI
- 314.1254
- Rent YoY
- ▲ 2.31%
- Metro
- Spokane-Spokane Valley, WA
- State GDP YoY
- ▲ 4.65%
- F500 in state
- 22
Industry mix (Fortune 500 HQ in WA)
| Industry | F500 HQs | Revenue |
|---|---|---|
| Retail | 2 | $269B |
|
||
| Technology / Retail | 1 | $638B |
|
||
| Technology | 1 | $245B |
|
||
| Telecommunications | 1 | $38B |
|
||
| Food / Beverage | 1 | $36B |
|
||
| Automotive / Trucks | 1 | $34B |
|
||
Price history
-24.0% since first listed10 events — show timeline
- 2025-12-24 Listed $68,000 NWMLS as Distributed by MLS Grid
- 2025-12-22 Listed $68,000 SPOKANEMLS as Distributed by MLS Grid
- 2025-10-01 Listing Removed — SPOKANEMLS as Distributed by MLS Grid
- 2025-07-18 Price Changed $80,000 SPOKANEMLS as Distributed by MLS Grid
- 2025-07-03 Price Changed $90,000 SPOKANEMLS as Distributed by MLS Grid
- 2025-05-20 Price Changed $98,000 SPOKANEMLS as Distributed by MLS Grid
- 2025-04-21 Listed $100,000 SPOKANEMLS as Distributed by MLS Grid
- 2022-06-28 Sold (MLS) $88,500 SPOKANEMLS as Distributed by MLS Grid
- 2022-05-31 Pending — SPOKANEMLS as Distributed by MLS Grid
- 2022-05-26 Listed $89,500 SPOKANEMLS as Distributed by MLS Grid
Property tax history
+24.4%/yrLatest (2026): $687 · -15.3% YoY. Source: county tax records.
Cash-flow waterfall
monthlySold comps — $/sqft
last 12 mo · ≤1 miLoading sold comps…