 🏗️ New Construction
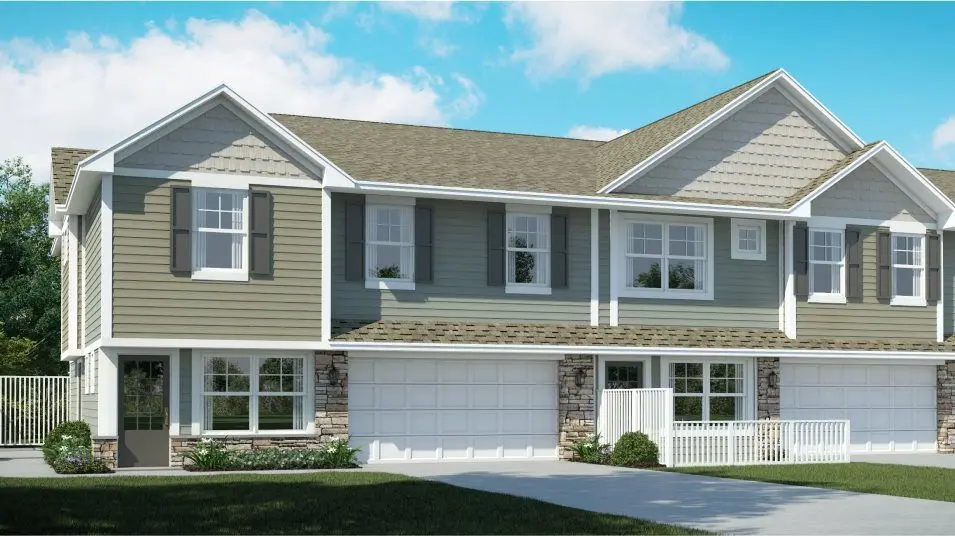
Franklin Plan · Woodbury, MN
Flood risk No data
- FEMA flood zone
- —
- Chance of flooding over 30 yrs
- —
- Est. flood insurance / yr
- —
Fire risk No data
- Est. fire insurance / yr
- —
Heat risk No data
- Hot days now (above threshold)
- —
- Hot days in 30 yrs
- —
Wind risk No data
- Chance of severe wind over 30 yrs
- —
Air-quality risk No data
- Unhealthy air days now
- —
- Unhealthy air days in 30 yrs
- —
Risk factors via First Street. Map © Google.
Why this score? — see what drove the F grade
The composite is a weighted blend of 9 inputs, each scored 0–100. Each bar is that input's sub-score; the figure is the points it added to the 100-point composite (weight × sub-score).
- ARV discount +7.5/15.0
- Cash flow +6.0/30.0
- Schools +5.2/10.0
- Livability +4.5/5.0
- Rent growth +3.2/5.0
- Condition / age +2.5/5.0
- 1% rule +1.3/10.0
- DSCR +0.4/10.0
- Appreciation +0.0/10.0
$362,990
🖨 Deal sheet (PDF) 📄 Offer letter ✓ Due diligence
Listing remarks
This new two-story townhome is an end unit featuring a contemporary design. The first floor offers a stylish open-concept layout among the Great Room, dining room and kitchen. Upstairs are a loft that adds shared living space, two secondary bedrooms and a luxe owner's suite with a retreat.
Key facts
- End unit
- Luxe owner's suite
- Open concept layout
Tags
Property features AI
Finance
- Other: Address: Franklin Plan, Woodbury, MN 55129; Status: Active; Last updated: 2026-05-21
- Financial info: List price $382,990
Exterior
- Parking: 2 garage spaces (2 total parking spaces)
- Home design: Single-family plan (Franklin)
- Exterior features: Living area approximately 1800
Interior
- Bedrooms: 3 bedrooms
- Bathrooms: 2 full bathrooms, 1 half bathroom (2.5 total)
- Interior features: Plan name: Franklin; New construction plan
Neighborhood map
What this means for you Summary
Snapshot
- This is a 3-bed/2.5-bath townhouse listed at $363k.
Deal economics
- At list price, monthly cash flow is $-816 ($-10k/yr) — negative.
- To cash-flow at today's rent, offer at most $308k (15.0% below list).
- To meet the 1% rule (rent ≥ 1% of price), the offer needs to be $270k (25.7% below list).
- Recommended offer: $270k (25.7% below list) — sets the bar for 1% rule.
- Cap rate 4.0% vs local median 3.2% in Woodbury — meaningfully above typical; check what's discounted (condition, days-on-market, listing class) to confirm the premium yield is real.
Location & tenants
- Location reads 89/100 on livability (#6 in MN, #153 nationally) — a professional / high-income tenant draw. Strengths: crime A+, commute A+, employment A+; Watch: cost of living F.
- South Washington County School District (suburban): math 52% / reading 61% proficiency, ranked #40 of 301 in MN (top 13%) — acceptable for families but not a draw, mixed tenant base, ~2y average lease; only 14% free/reduced lunch — higher-income household profile.
- Zoned schools: Gordon Bailey Elementary (math 61% / reading 65%, grade B, #168 of 857 statewide, top 20%, 653 students, 18% FRL); Woodbury Middle School (math 44% / reading 60%, grade C+, #63 of 258 statewide, top 25%, 1,108 students, 24% FRL); East Ridge High School (math 67% / reading 77%, grade B+, #13 of 471 statewide, top 3%, 2,021 students, 15% FRL) — zoned schools at 19% FRL track the district average.
- Market conditions: Rents rising (+2.9%/yr); 357 active listings in the ZIP; 6 comparable units currently listed for rent nearby; rentals at typical pace (median 22d on market — plan ~3-4 weeks tenant-placement turnaround); high-income renter base; 1,405 units permitted in Washington County in 2024 (121 in 5+ unit buildings).
Forward outlook
- Local home prices are declining (-3.0%/yr); year-one equity from $3k of loan paydown is wiped out by about $13k of value loss. Plan a longer hold.
- Washington County population projected at +16% by 2050 — long-run rental-demand tailwind backs the buy-and-hold thesis.
Negotiation context
- It's been on market 41 days — a 3% lower offer ($352k) is reasonable based on typical stale-listing flexibility.
Questions for the listing agent
- What do current leases actually rent for vs. the listed asking? Can we see a recent rent roll and the last 12 months of T-12 income?
- It's been on market 41 days. Have you received any prior offers? Is the seller open to a 26% concession, seller financing, or rate buy-down credit?
- Is there a deadline driving the sale (1031 exchange, divorce, estate, relocation)? That informs how much negotiation room exists.
- Schools are A-rated — typically a magnet for longer-tenancy family renters. What's the average tenant stay here, and is there a school-zone premium baked into asking?
- The area grade is low — what's the realistic commute time and amenity access for the typical tenant pool here? Any planned neighborhood developments (good or bad) we should know about?
- What's the average days-on-market for RENTAL listings here right now (not sales)? A rising rental-DOM trend means longer vacancies and softer asking-rent achievability than the comps imply.
- What's the recent tenant-quality profile in this submarket — average credit score on applications, eviction rate, late-payment / NSF rate, and stable-employment percentage? A property-management company in the area should have these aggregated.
- How much new for-sale + rental construction is in the pipeline within 1–3 miles? Heavy new supply typically softens prices + rents 12–24 months out; constrained supply supports both.
Investment metrics
- 1% rule
- 0.63% ✗
- Cap rate
- 4.00%
- Cash-on-cash
- -8.20%
- DSCR
- 0.64
- GRM
- 13.2
CMA / ARV
- ARV (median comp)
- $426,492
- List price
- $362,990
- Delta
- -14.89%
- Verdict
- UNDERPRICED
- Comps
- 3 within 2.0 mi
Projected returns pro-forma
-3.0% appreciation · 2.91% rent growth · sell at horizon
- IRR
- -30.8%
- Equity multiple
- -0.02×
- Total profit
- $-121,301
- Equity at exit
- $63,591
- IRR
- -33.9%
- Equity multiple
- -0.45×
- Total profit
- $-173,404
- Equity at exit
- $36,875
Cash invested: $119,418 (down + closing). Projections, not guarantees.
Landlord ↔ Tenant lean methodology
- Overall (STATE)
- 46 Balanced
- State Minnesota
- 46 Balanced · D+2
- County
- — inherits STATE
- City
- — inherits STATE
ZIP-level market 55129
- Home prices YoY
- -24.4%
- Rents YoY
- 2.9%
- Active inventory
- 357
- Price-to-rent
- 11.2×
Monthly cashflow live
- Estimated rent
- $2,698 high interval (Pro) →
- Mortgage (P&I)
- −$2,237
- Tax est. 1.5%
- −$533 /mo · $6,397/yr
- Insurance
- −$178
- HOA
- −$0
- Vacancy / Maint / Mgmt
- −$567
- Net cashflow
- $-816
Break-even live
Sensitivity live
| Price | -10% $-522 | -5% $-669 | +0% $-816 | +5% $-964 | +10% $-1,111 |
|---|---|---|---|---|---|
| Rent | -10% $-1,029 | -5% $-923 | +0% $-816 | +5% $-710 | +10% $-603 |
| Rate | -1.0pp $-601 | -0.5pp $-708 | base $-816 | +0.5pp $-927 | +1.0pp $-1,039 |
UW: 25.0% down · 7.5% · 30yr · 1.5% tax · 5.0% vac · 8.0% maint · 8.0% mgmt
Financing live
Cash to close
- Down payment
- $106,623
- Closing costs
- $12,795
- Reserves months
- —
- Total cash needed
- —
Loan-product check · same deal, 3 products live
Conventional
25% down · 7.5% · 30yr
- Down + closing
- —
- Monthly P&I
- —
- Monthly cashflow
- —
- DSCR
- —
- Eligible?
- —
Personal DTI + credit; lowest rate.
DSCR
20% down · 8.5% · 30yr
- Down + closing
- —
- Monthly P&I
- —
- Monthly cashflow
- —
- DSCR
- —
- Eligible?
- —
No personal income docs; deal must DSCR.
Hard money
10% down · 12.0% · 12mo
- Down + closing
- —
- Monthly P&I
- —
- Monthly cashflow
- —
- DSCR
- —
- Eligible?
- —
Short-term bridge; refi at stabilization.
Rent comps 6 comps
| Address | Beds | Baths | Sqft | Rent | $/sqft | DOM | Units | Dist |
|---|---|---|---|---|---|---|---|---|
| 5275 Long Pointe Pass Saint Paul, MN | 3.0 | 2.5 | 1782 | $2,500 | $1.40 | 45d | 1 | 0.15mi |
| 8797 Granite Cir Saint Paul, MN | 3.0 | 2.5 | 1894 | $2,450 | $1.29 | 23d | 1 | 0.65mi |
| 8047 Abercrombie Ln Saint Paul, MN | 3.0 | 3.0 | 1769 | $2,699 | $1.53 | 6d | 1 | 0.80mi |
| 8042 Abercrombie Ln Saint Paul, MN | 3.0 | 2.5 | 2046 | $2,445 | $1.20 | 12d | 1 | 0.84mi |
| 4799 Equine Trl Woodbury, MN | 3.0 | 2.5 | 1769 | $1,200 | $0.68 | 21d | 1 | 0.90mi |
| 10108 Sunbird Cir Saint Paul, MN | 2.0–4.0 | 2.0–3.0 | 1815 | $3,298 | $1.82 | 0d | 7 | 1.18mi |
Listing history 16 events
-
2026-06-21days on market $362,990 Active 41 DOM
-
2026-06-18days on market $362,990 Active 38 DOM
-
2026-06-17days on market $362,990 Active 37 DOM
-
2026-06-16days on market $362,990 Active 36 DOM
-
2026-06-15days on market $362,990 Active 35 DOM
-
2026-06-13days on market $362,990 Active 33 DOM
-
2026-06-13pricedays on market $362,990 Active 32 DOM
-
2026-06-09days on market $388,990 Active 29 DOM
-
2026-06-08pricedays on market $388,990 Active 28 DOM
-
2026-06-07days on market $386,990 Active 27 DOM
-
2026-06-04pricedays on market $386,990 Active 24 DOM
-
2026-06-03days on market $382,990 Active 23 DOM
-
2026-06-02days on market $382,990 Active 22 DOM
-
2026-06-01days on market $382,990 Active 21 DOM
-
2026-05-31days on market $382,990 Active 20 DOM
-
2026-05-11$382,990 Active 290-char remark
ⓘ Source: listings_history table (triggers on properties + properties_extension) + one-shot
backfill from property_details.listing_events for pre-trigger history.
Nearby sold comps map
Loading sold comps map…
Walkable amenities ~0.75 mi
Loading nearby amenities…
Taxation est. · year 1
- Rental income
- $32,372
- − Mortgage interest
- −$23,890
- − Property taxes
- −$6,397
- − Insurance
- −$2,132
- − Repairs & maintenance
- −$2,590
- − Management
- −$2,590
- − Depreciation
- −$12,407
- Taxable loss
- −$17,635
- Est. tax savings @ 24.0%
- +$4,232
- After-tax cash flow
- $-5,563/yr
For passive investors: Depreciation is non-cash, so a rental often shows a tax loss while cash-flowing — sheltering income. Rental losses are passive: they offset passive income freely, and up to $25,000/yr can offset ordinary (W-2) income if you actively participate and your MAGI is under $100k (phasing out to $0 by $150k); unused losses carry forward. On sale, claimed depreciation is recaptured at up to 25%, and gains may owe capital-gains tax (a 1031 exchange can defer both). Figures are a year-1 estimate at your 24.0% rate — not tax advice; consult a CPA.
Schools (NCES district)
- District
- South Washington County School District
- NCES district ID
- 2733810
- Math proficiency
- 52% ▼ -13.00%
- Reading proficiency
- 61% ▼ -7.00%
- Median HH income
- $88,285
- Composite
- 51.8/100
- National rank
- #1670
- State rank
- #40 of 301 in MN
Livability — Woodbury
- Score
- 89/100
- State rank
- #6
- US rank
- #153
Category grades
Schools grade is shown separately in the Schools card above.
Census & demographics
- Census place
- Woodbury, MN
- County
- Washington County · 235,613 people
- City population
- 78,305
- Metro
- Minneapolis-St. Paul-Bloomington, MN-WI
- Population (ZIP)
- 34,120
- Household income
- $143,795
- Rent vs Own
- Severe rent burden
- 639.0
Population outlook (Washington County) Hauer SSP2
- Today (2025)
- 278,554 people
- By 2030
- 290,465 · +4.3%
- By 2040
- 310,014 · +11.3%
- By 2050
- 324,118 · +16.4%
- By 2075
- 362,697 · +30.2%
- By 2100
- 381,491 · +37.0%
Race, ethnicity, and origin ACS 2023
- Neighborhood character
- Predominantly White (66%)
- Race & ethnicity
- White 66% Asian 17% Black 8% Two or more races 5% Hispanic / Latino 3%
- Common ancestry
- Portuguese 8% Romanian 5% Lithuanian 2%
- Foreign-born
- 16% · Canada, China, Vietnam
- Languages at home
- 77% English-only · Other Indo-European 5% Other Asian/Pacific 5% Spanish 3%
Political lean MEDSL · Washington
- 2024 margin
- Lean D (+8.9) · D 53.5% · R 44.6% · Other 1.9%
- 2008→2024 swing
- +4.6pp toward D · 2008: 4.3pp · 2024: 8.9pp
- All cycles
- 2024: D+8.9 2020: D+9.2 2016: D+1.9 2012: D+0.8 2008: D+4.3
Not yet ingested
- Civics
- —
Market trends
- HPI YoY
- ▼ -69.89%
- Current HPI
- 216.0248
- Rent YoY
- ▲ 2.91%
- Metro
- Minneapolis-St. Paul-Bloomington, MN-WI
- State GDP YoY
- ▲ 2.41%
- F500 in state
- 34
Industry mix (Fortune 500 HQ in MN)
| Industry | F500 HQs | Revenue |
|---|---|---|
| Healthcare | 2 | $407B |
|
||
| Retail | 2 | $150B |
|
||
| Consumer Goods | 2 | $32B |
|
||
| Industrial Machinery | 2 | $6B |
|
||
| Agriculture | 1 | $40B |
|
||
| Healthcare / Medical Devices | 1 | $32B |
|
||
Cash-flow waterfall
monthlySold comps — $/sqft
last 12 mo · ≤1 miLoading sold comps…